Abstract
Although organ transplants have been applied for decades, outcomes of somatic cell transplants remain disappointing, presumably due to lack of appropriate supporting stromal cells. Thus, cotransplantation with liver stromal cells, hepatic stellate cells (HSC), achieves long-term survival of islet allografts in mice via induction of effector T cell apoptosis and generation of regulatory T (Treg) cells. In this study, we provide evidence both in vitro and in vivo that HSC can promote generation of myeloid-derived suppressor cells (MDSC). HSC-induced MDSC demonstrate potent immune inhibitory activity. Induction of MDSC is dependent on intact IFN-γ signaling pathway in HSC, and is mediated by soluble factors, suggesting that the specific tissue stromal cells, such as HSC, play a crucial role in regulating immune response via inflammation-induced generation of MDSC. Large amounts of MDSC can be propagated in vitro from bone marrow derived myeloid precursor cells under the influence of HSC. Cotransplantation with in vitro generated MDSC can effectively protects islet allografts from host immune attack. Local delivery of potent immune suppressor cells for cell transplants holds a great clinical application potential.
Keywords: Immune inhibition, T regulatory cells, Islet transplantation, T cells, Dendritic cells
Introduction
The liver tolerogenic property was initially demonstrated by spontaneous acceptance of liver transplants in many species without requirements of immunosuppression (1–3). It was then supported by the fact that the liver contributes to tolerance to the antigens delivered via portal vein or oral route (4,5). In humans, weaning off immunosuppression has been attempted post liver transplants, and achieved total immunosuppression off for at least one year in ~20% liver transplant recipients, but not in other organs (6). On other hand, liver tolerogenic property may be exploited by hepatitis B and C viruses to induce persistent infections (7). Elucidating the underlying mechanisms is of great clinical significance.
Interestingly, although liver transplants in mice are accepted, hepatocyte transplants are promptly destroyed, which succumbs to an immune-mediated destructive mechanism since hepatocytes survive indefinitely in syngeneic recipients, as well as in allogeneic SCID recipients (8,9), suggesting that liver non-parenchymal cells (NPC) may protect hepatocytes from immune attack. We have recently identified that hepatic stellate cells (HSC), well known for storing retinols (vitamin A) and participating in the repairing following liver injury, have potent inhibitory activity against T cell response (10). Cotransplantation with HSC resulting in long-term survival in >60% islet allografts without requirement of immunosuppression, which was associated with enhanced CD8+ T cell apoptosis, as well as marked increase in Foxp3+ regulatory T (Treg) cells (increased from ~10% in controls to ~40% CD4+ cells). HSC eliminate antigen specific activated CD8+ cells via B7-H1 pathway, however, the mechanisms involved in Treg cells expansion remain unclear (11,12). There is accumulating data suggesting that peripheral Treg cells are generated from naïve T cells by stimulation of particular subsets of antigen-presenting cells (APC) in lymph nodes (LN) (13,14). Even though HSC can modestly expand nature existing Treg cells in vitro (15), it is unlikely that HSC can directly induce large amounts of Treg cells in vivo since co-transplanted GFP-HSC do not show ability to migrate to draining (d) LN (unpublished data). We hypothesize that induction of Treg cells may be mediated by other cells other than HSC.
Myeloid-derived suppressor cells (MDSC) were initially identified in cancer patients, and contribute to cancer evasion from immune surveillance. They contain heterogeneous myeloid cell populations, but share some common characteristics: immature phenotype, inability to differentiate into mature myeloid cells, high expression of arginase 1, and a high potential to suppress immune response (16). In this study, we provide both in vivo and in vitro evidence that HSC preferentially induce MDSC. These effects are dependent on the IFN-γ signaling pathway in HSC, and mediated by the soluble factor (s).
Materials and Methods
Animals
Male C57BL/6J (B6, H2b), BALB/c (H2d), C3H (H2k), IFN-γR1−/−, G-CSF−/−, GM-CSF−/− and OT-I and OT-II TCR transgenic mice were purchased from Jackson Laboratory (Bar Harbor, ME). The mice with chicken oval albumin (OVA) specific expression on hepatocytes (OVA-HEP) were provided by Dr. Marion Peters (University of California, San Francisco, CA). B7-H1 knockout mice were provided by Dr. Lieping Chen (Johns Hopkins University Medical School, Baltimore, MD). All animals were maintained and used following NIH guidelines.
Please see more Materials and Methods in Supplementary Data
Results
HSC cotransplantation promotes generation of CD11b+CD11c− cells
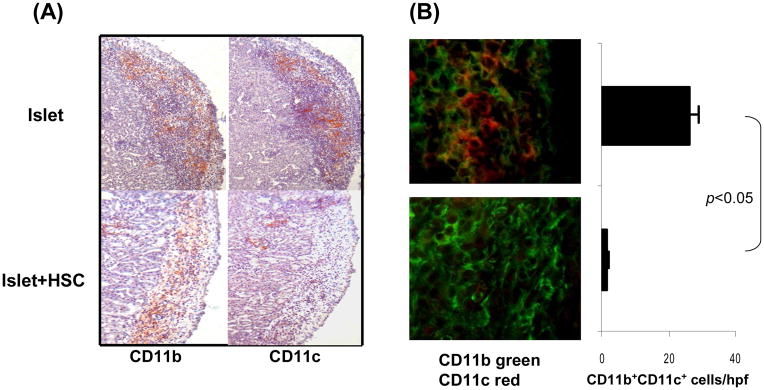
The influence of HSC on antigen presenting cells (APC) when they process antigens in the islet allografts was first investigated by histochemical staining following transplant under renal capsule of BALB/c (H2d) islets with or without B6 (H2b) HSC. The sections of the kidneys bearing islet allografts were stained with anti-CD11b or -CD11c mAbs. The mononucleocytes in islet alone grafts on POD 7 were predominantly CD11b+CD11c+, while almost all CD11b+ cells in islet/HSC grafts were CD11c− (Fig. 1A). This was confirmed by two color fluorescent staining; the islet/HSC grafts contained only 1.7±0.6 CD11b+CD11c+ cells/hpf, compared to islet alone grafts (26.3± 0.6/hpf, p<0.05) (Fig. 1B). The cells isolated from islet alone or islet/HSC grafts (yield numbers were similar in two groups) were multi-color stained for CD45, CD11b, CD11c and the key surface molecules for flow analysis. As shown in Fig. 1C, <20% of cells from either group were CD45−, which contained no CD11b+ or CD11c+ cells, indicating that they are non-leukocyte tissue cells. The majority (>80%) of the isolated cells were CD45+ which contained similar levels of CD11b+ cells in both groups (~19 and 16%, respectively), but consisted of marked different levels of CD11c cells (~17% in islet alone, but only ~5% in islet/HSC grafts), reflecting fewer DC were accumulated in islet/HSC grafts. The myeloid cells were further analyzed gated on CD11b+ cell populations. CD11b+ cells in both groups were host origin (H2Kb+H2Kd−IAb+IAd−). However, different from the islet alone grafts where ~50% of CD11b+ cells were CD11c+, ~90% of CD11b+ cells from islet/HSC grafts were CD11c−, and expressed low CD40, CD80 and CD86, indicating an immature phenotype. CD11b+ cells from both groups similarly expressed high B7-H1, CD45RB, and high Gr-1 (granulocyte), and intermediate levels of F4/80 (macrophage) and B220 (B cells and/or plasmacytoid DC) (Fig. 1C), suggesting a heterogenous nature.
Figure 1. Impact of cotransplantation HSC on development of myeloid cells.
300 BALB/c (H-2d) islets were mixed with 5 × 10⁵ HSC from B6 (H-2b) mice, and transplanted under renal capsule of STZ-induced diabetic B6 recipients (islet allografts alone served as control). The animals were sacrificed on post operative day (POD) 7 (n=3 in each group). (A) Islet graft cryostat sections were stained with anti-CD11b or -CD11c mAbs. The color was developed by an enzyme reaction using avidin-biotin-alkaline phosphatase complex as the substrate (red). (B) Islet graft cryostat sections were double stained with anti-CD11b (green) and -CD11c (red) mAbs, and evaluated under a fluorescent microscope. The double positive cells were counted in total 10 high power fields (hpf) that were randomly selected in each graft. The data are expressed as mean CD11b+CD11c+ cells/graft ± 1SD. (C) Cells isolated from the islet/HSC and islet alone grafts were multiple color stained with specific mAbs against CD45, CD11b and CD11c or the indicated key cell surface molecules for flow analyses. Expression of CD11b and CD11c was analyzed in CD45+ and CD45− populations. Expression of cell surface molecules were analyzed gated on CD11b+ cells in both groups, and demonstrated as histograms (filled area is isotype control). The number is percentage of the positive cells. The data are representative of three separated experiments.
Characterization of CD11b+ cells in islet/HSC cotransplanted grafts
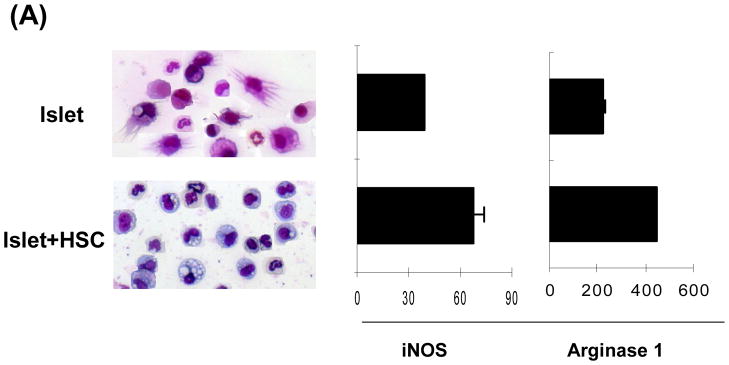
CD11b+ cells were purified by magnetic beads (with purity of >96% and without CD45− cell contamination by flow analysis,) and subjected to morphological, phenotypical and functional analyses. CD11b+ cells from islet alone grafts showed typical DC morphology, while that from islet/HSC grafts displayed eccentric nuclei with less cytoplasmic projections, and expressed markedly high mRNA for iNOS and arginase 1 (qPCR) (Fig. 2A). Their surface molecule expression were analyzed by flow cytometry, showing a pattern (Supplementary Fig. 1A) very similar to the CD11b+ cells before magnetic beads sorting (Fig. 1C), suggesting that ex vivo cell purification using magnetic beads does not affect expression of key surface molecules. We also examined the chemokines and receptors that are critical for leukocyte migration: CD62L and CCR7 that are required for migration through high endothelial venule (HEV) into LNs, as well as CCR2 and CCR5, expression of which are required for migration into inflamed tissues (19). HSC cotransplantation markedly enhanced expression of CD62L on infiltrated CD11b+ cells, but not others (Supplementary Fig. 1B).
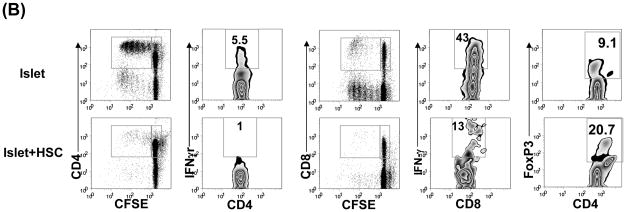
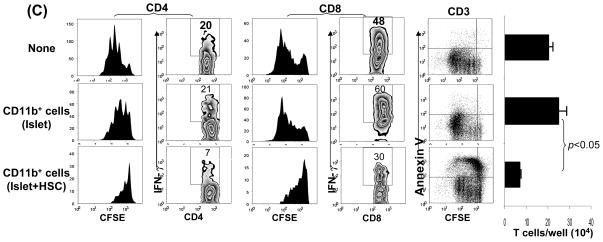
Figure 2. Characterization of CD11b+ cells isolated from islet/HSC grafts.
CD11b+ cells were purified by magnetic beads from cells isolated from BALB/c (H-2d) islet allografts cotransplanted with B6 (H-2b) HSC on POD 7. Islet alone allografts served for comparison (n=3 in each group). (A) Cell morphology (Giemsa staining) and expression of iNOS and arginase 1 [quantitative (q) PCR]. The data are expressed as mean relative to 18S ± 1SD. (B) Allo-stimulatory activity of the isolated CD11b+ cells. Irradiated CD11b+ cells pulsed with BALB/c spleen cell lysate (without alloantigen pulsing served as control), were cultured with CFSE labeled B6 spleen T cells at a 1:20 ratio for 5 days. Proliferative responses were determined by CFSE dilution. Expression of IFN-γ and Foxp3 was assayed by intracellular staining with specific mAbs, and analyzed by flow cytometry. The number is percentage of positive cells in CD4 or CD8 T cell subset. (C) CD11b+ cells from islet/HSC grafts inhibit T cell response. CD11b+ cells isolated from islet alone or islet/HSC grafts were added at the beginning into the culture of CFSE-labeled T cells, proliferation of which was elicited by anti-CD3 mAb (2 μg/ml) for 3 days. Without addition of CD11b+ cells served as control. Expression of IFN-γ was measured by intracellular staining with specific mAbs. Apoptotic activity was measured by staining with anti-annexin V mAb. The number is percentage of positive cells in T cells or their subsets. CD3+ cells in each well was counted, and expressed as mean ± 1SD.
The antigen stimulatory activity of these purified CD11b+ cells was examined in a one-way MLR culture where CFSE labeled B6 spleen T cells were stimulated by CD11b+ cells pulsed with BALB/c spleen cell lysate (without pulsing served as controls). CD11b+ cells from islet/HSC grafts elicited weaker proliferative response in both CD4 and CD8 T cells with less IFN-γ production, but generated more CD4+Foxp3+ cells, compared to islet alone group (Fig. 2B). To determine their immune regulatory activity, the isolated CD11b+ cells were added into the culture of CFSE-labeled T cells at a ratio of 1:10. T cell proliferation was elicited by anti-CD3 mAb. Addition of CD11b+ cells from islet/HSC, but not from islet alone grafts, markedly suppressed the proliferative response and IFN-γ production in both CD4+ and CD8+ T cells. This was associated with markedly reduction of T cells numbers (Fig. 2C right panels, p<0.05, islet vs. islet/HSC) due to enhanced T cell apoptosis as determined by annexin V staining (Fig. 2C). Taken these data together, CD11b+ cells in islet/HSC grafts demonstrated many characteristics of MDSC: CD11clow, immature phenotype, expressing high iNOS and arginase1, immune inhibitory activity (16,20), suggesting that cotransplanted HSC are potent inducers of MDSC.
Correlation of MDSC and Treg cell development
MDSC have been shown to mediate development of Treg cells (18). To study the correlation of MDSC and Treg cells induced by HSC cotransplantation, CD11b+CD11c− cells and CD4+Foxp3+ cells were kinetically analyzed by immunohistochemitry and flow cytometry in the grafts, draining LN and spleen following transplant. CD11b+CD11c− cells were remarkably increased in islet/HSC grafts, peaking on POD 7, compared to islet alone, gradually declined thereafter, and hardly to be found in long-term survived grafts (Fig. 3A). Increase in CD11b+CD11c− cells was also seen in dLN and spleen, and remained high there in the recipients with long-term survived grafts (Fig. 3B and C). The changes of CD11b+CD11c− cells (MDSC) were well correlated with that of CD4+Foxp3+ Treg cells, suggesting a close relationship of the two cell populations.
Figure 3. Kinetic analyses of the impact of cotransplantation with HSC on accumulation of MDSC and Treg cells.
(A) Cryostat sections of islet grafts harvested on POD7, 14 and >90 (long-term, LT) (n=3 in each group) were double stained with anti-CD11b (green) and -CD11c (red) or -CD4 (red) and -Fop3(green) mAbs, and evaluated under a fluorescent microscope. The double positive cells were counted in total 10 high power fields (hpf) that were randomly selected in each graft. The data are expressed as mean double positive cells/graft ± 1SD. (B and C) Lymphocytes isolated from draining LN or spleen at the indicated time points (n=3 in each group) were double stained with anti-CD11b and -CD11c or –CD4 and –Foxp3 mAbs, and analyzed by flow cytometry. The absolute numbers of CD11b+CD11c− and CD4+Foxp3+ cells are calculated. The data are expressed as mean cells/LN or spleen ± 1SD.
HSC deficient in IFN-γR1 lose ability to induce MDSC
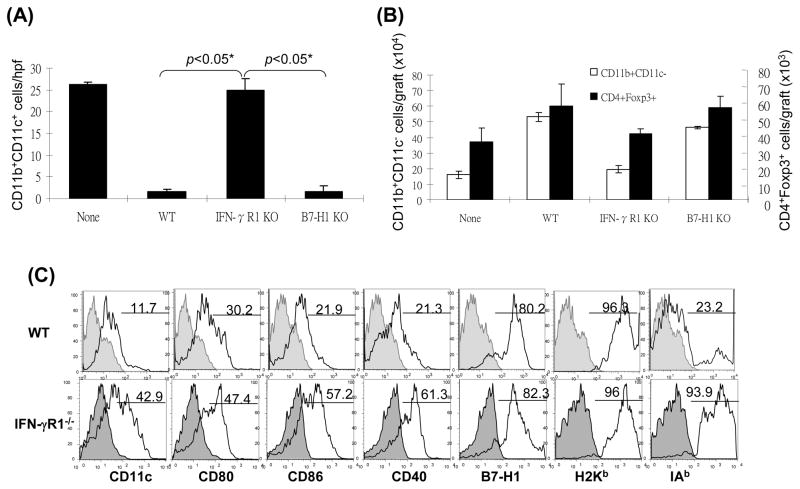
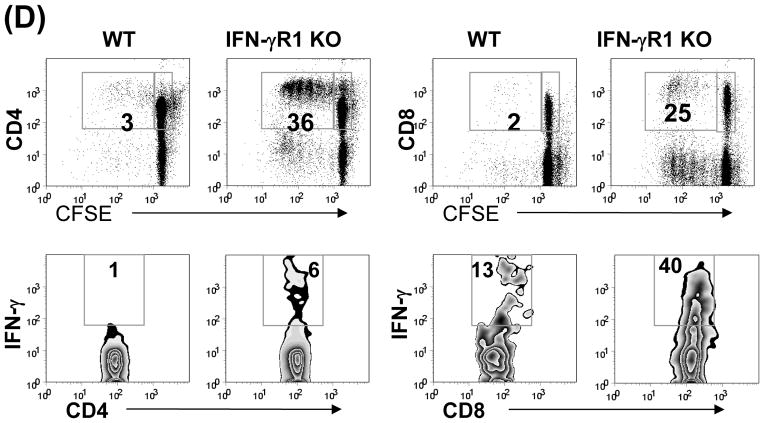
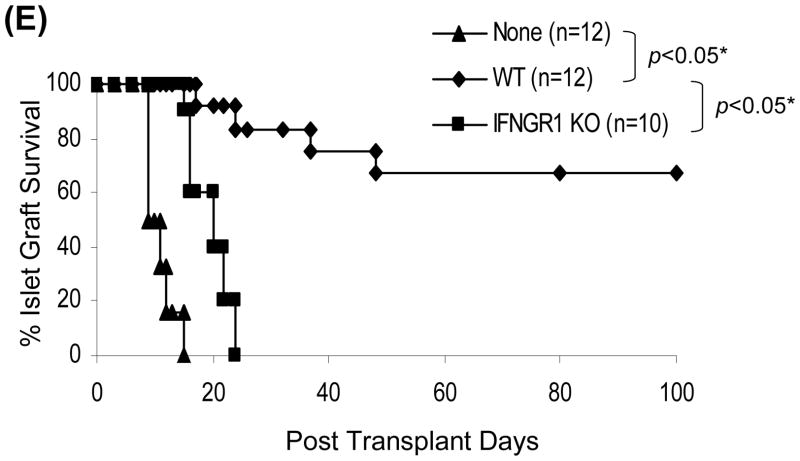
Induction of MDSC has been shown to require inflammatory stimulation (21.22). We hypothesized that HSC might lose their ability to induce MDSC when IFN-γ stimulation was blocked. This was tested by using HSC from IFN-γR1−/− mice for islet cotransplantation. Following transplantation, the graft CD11b+ and CD4+ cells were evaluated by both immunohistochemistry and flow cytometry for expression of CD11c and Foxp3, respectively. As shown in Fig. 4A and B, the pattern of graft CD11b+CD11c+ and CD11b+CD11c− cells in IFN-γR1−/− HSC group was almost totally reversed compared to WT HSC controls, reaching the levels similar to islet alone group, Consistently, the CD11b+ cells isolated from IFN-γR1−/− HSC/islet grafts expressed high CD11c with mature phenotype (Fig. 4C), and elicited potent T cell response (Fig. 4D). These results suggest that HSC deficient in IFN-γR1 largely lost their ability to induce MDSC. Blockade of MDSC induction by deficiency in IFN-γ signaling in HSC was associated with impaired generation of Treg cells (Fig. 4B), Indicating strong correlation of MDSC and Treg cell expansion. Since B7-H1 is an important product of IFN-γ signaling in HSC (10), we further examined the effect of B7-H1 on induction of MDSC using HSC isolated from B7-H1−/− mice. HSC deficiency in B7-H1 remained to inhibit accumulation of DC (Fig. 4A), as well as induce generation of MDSC (Fig. 4B), suggesting that induction of MDSC is unlikely mediated by B7-H1. Other product (s) of IFN-γ signaling must be involved. As expected, IFN-γR1−/− HSC largely lost their capacity of protecting cotransplanted islet allografts (Fig. 4E). These data demonstrate that inflammatory stimulation is absolutely required for HSC to execute immune regulatory activity via induction of MDSC and Treg cells.
Figure 4. Induction of MDSC by cotransplantation with HSC is dependent on IFN-γ signaling pathway.
300 BALB/c (H-2d) islet allografts were cotransplanted with 5 × 10⁵ B6 (H-2b) HSC from wild type (WT), INF-γR1 KO or B7-H1 KO mice. Islet allograft transplants without HSC served as controls (none). The animals were sacrificed on POD 7 (n=3 in each group). (A) Cryostat sections of islet allografts were double stained with anti-CD11b and -CD11c mAbs, and evaluated under a fluorescent microscope. The double positive cells were counted in total 10 high power fields (hpf) that were randomly selected in each graft. The data are expressed as mean CD11b+CD11c+ cells/hpf ± 1SD. (B) Cells isolated from the islet grafts were double stained for CD11b and CD11c, or for CD4 and Foxp3, and analyzed by flow cytometry. CD11b+CD11c− and CD4+Foxp3+ cell numbers were calculated, and expressed as mean cell number/graft ± 1SD. (C) CD11b+ cells were isolated and purified from the islet grafts cotransplanted with WT or IFN-γR1−/− HSC, double stained for CD11b and the indicated key surface molecule, analyzed by flow cytometry, and displayed as histograms. Grey areas are isotype controls. The number is percentages of positive cells in CD11b+ cell population. (D) Allo-stimulatory activity of the graft CD11b+ cells. Irradiated CD11b+ cells pulsed with BALB/c spleen cell lysate (without alloantigen pulsing were used as control) were cultured with CFSE labeled B6 spleen T cells at a 1:20 ratio for 5 days. Proliferative responses were measured by CFSE dilution. Expression of IFN-γ and Foxp3 was determined by intracellular staining. The analyses were performed by flow cytometry in CD4 or CD8 T cell population. The number is percentage of IFN-γ positive cells in the T cell subset. The data are representative of three separate experiments. (E) HSC deficient in IFN-γR1 expression loses ability to protect islet allografts. Survive of islet allografts cotransplanted with WT HSC or IFN-γ KO HSC [islet allografts alone (none) served as controls] was followed up as described in Methods.
HSC induce MDSC in vitro
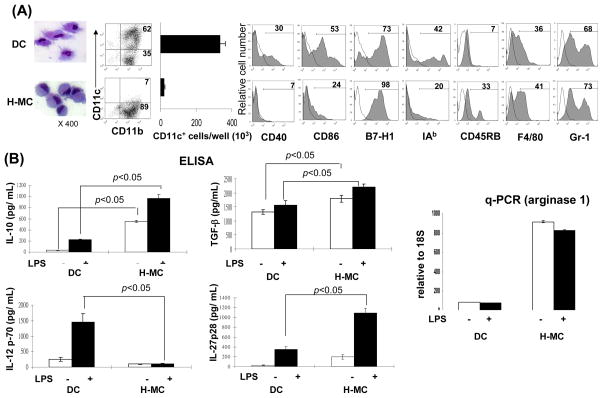
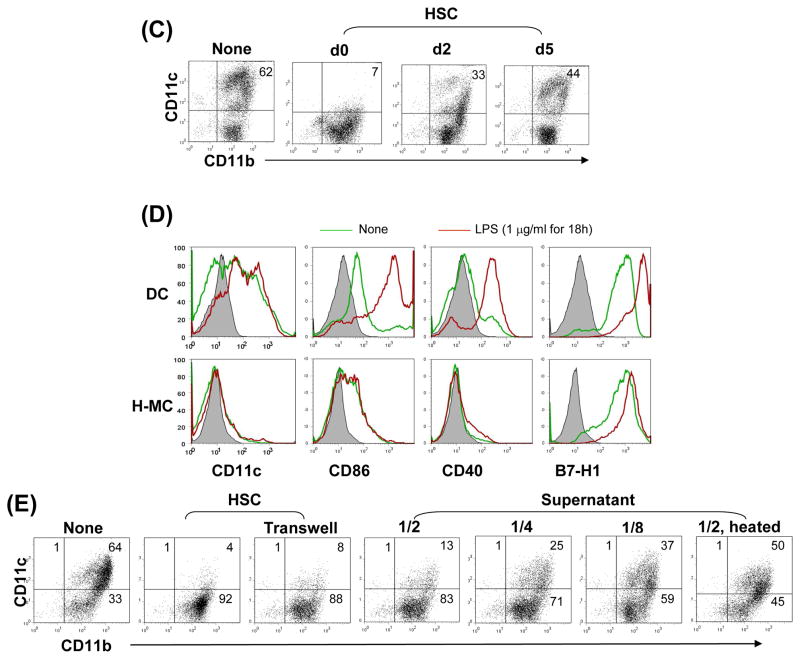
To obtain direct evidence that HSC induce MDSC propagation, B6 HSC were added at the beginning into the culture of B6 BM cell culture in the presence of GM-CSF. The floating cells were harvested and CD11b+ cells were purified via magnetic beads [hereafter referred as HSC-conditioned myeloid cells (H-MC)]. BM cell culture without HSC served as control (hereafter referred as DC). H-MC displayed eccentric nuclei and less cytoplasmic projections and contained only ~7% CD11c+ cells (CD11c+ cell number 19 ± 5.7 × 10³/well), while DC contained 62% CD11c+ cells (CD11c+ cell number 332 ± 31.1 × 10³/well, ~17.5 fold more compared to H-MC) (Fig. 5A), suggesting an inhibition of DC propagation, but generation of CD11b+CD11c− cells. H-MC expressed low CD40, CD86 and MHC II, relatively high CD45RB and similar high levels of B7-H1, F4/80 and Gr-1, compared to DC, (Fig. 5A). In contrast to DC that produced high IL-12 upon LPS stimulation, H-MC secreted very low IL-12, but high IL-10, TGF-β and IL-27. H-MC expressed extremely high mRNA of arginase 1 regardless of LPS stimulation (Fig. 5B). To determine the effect timing of HSC addition on H-MC development, HSC were added at day 0, 2 or 5 of the culture. Interference of differentiation of CD11b+CD11c− cells was maximal when HSC were added early (Fig. 5C), emphasizing the importance of early interaction. Unlike DC on which expression of CD40 and CD86 was markedly enhanced following exposure to LPS, H-MC failed to display a mature phenotype following LPS stimulation, reflecting resistance to maturation (Fig. 5D). Compared to GM-CSF alone, similar levels of CD11b+CD11c− H-MC with immature phenotype were also generated when HSC were added into BM cell culture in the presence of both GM-CSF and IL-4, (Supplementary Fig. 2A), cotransplantation with which also effectively protected islet allografts from rejection (Supplementary Fig. 2B). Induction of H-MC by HSC was not a strain specific phenomenon, since the similar results were seen in other strains, BALB/c and C3H (data not shown).
Figure 5. Impact of HSC on BM-derived DC propagation in vitro.
HSC (B6) were added (HSC:BM cells = 1:80) at the beginning of the culture of B6 BM cells (2 × 10⁶/well) in the presence of mouse rGM-CSF (8 ng/ml) for 5 days. The floating cells were harvested, washed, and re-suspended in RPMI 1640 medium (H-MC). The culture in the absence of HSC served as control (DC). (A) Cells were stained with Giemsa for morphology examination. Cells were stained for CD11b, CD11c and indicated key surface molecules, and analyzed by flow cytometry. The absolute numbers of CD11c+ cells/well were calculated (n=3), expressed as mean ± 1SD. The flow histograms show the expression of the indicated key surface molecules. The number is percentage in CD11b+ cell population. (B) The levels of IL-10, IL-12p70, TGF-β and IL-27p28 were measured in culture supernatant by ELISA. Expression of arginase 1 mRNA was determined by q-PCR. For further stimulation, the cells were exposed to LPS (1μg/ml) for the last 18 hours of culture. (C) Time course of HSC effect. HSC were added on day 0, 2 or 5 of BM cell culture. Cells were harvested on day 7 and analyzed for expression of CD11b and CD11c by flow cytometry. (D) H-MC are resistant to maturation. DC or H-MC were exposed to LPS (1μg/ml) for 18 hours. Expression of CD11c and the indicated co-stimulatory molecules was analyzed by flow cytometry, and displayed as histograms gated on CD11b+ cells. (E) Induction of H-MC is mediated by soluble factor (s). BM cells and HSC were cultured in transwell or regular plates. Expression of CD11b and CD11c was analyzed by flow cytometry. Comparable CD11b+CD11c− cells were generated in transwell plate comparable to regular one. This was reexamined by addition of HSC culture supernatant into BM cell culture at various concentrations (1/2, 1/4 or 1/8 of total culture medium volume). The generation of CD11b+CD11c− cells was correlated with concentrations of the added supernatant. To determine the nature of the soluble factor (s), HSC culture supernatant treated at 57°C for 30 minutes failed to induce CD11b+CD11c− cells. The data are representative of three separate experiments.
Induction of H-MC is mediated by soluble factor (s)
To determine whether the induction of H-MC was mediated by cell-cell direct contact or by soluble factor (s), BM cells and HSC were cultured in transwell plates which blocked cell-cell direct contact but allowed free communication of soluble factors. Generation of CD11b+CD11c− cells in transwell plates was similar to culture in conventional plates, suggesting that soluble factor (s) secreted by HSC plays a pivotal role in induction of H-MC (Fig. 5E). This was confirmed by addition of HSC culture supernatant into the BM cell culture. The generation of CD11b+CD11c− cells correlated with the dose of the added supernatant (Fig. 5E). The responsible soluble factor(s) were likely to be proteins or peptides since their biological activity was largely impaired following heating at 56°C for 30 minutes (Fig. 5E, right panel).
Upon activation, HSC produce multiple factors, including VEGF, GM-CSF, G-CSF (11), which have been shown to promote expansion of MDSC (16). We tested the role of these factors using the HSC isolated from G-CSF or GM-CSF knockout mice. Because knockout of VEGF causes embryonic lethality, and the neutralizing anti-mouse Ab is not available, VEGF in HSC was silenced by treatment with specific siRNA. The results displayed that none of these factors appeared to be responsible for induction of H-MC (Supplementary Fig. 3A).
To identify the responsible soluble factor (s), the interference of bovine serum proteins was avoided by using serum free medium, which induced similar levels of H-MC to medium containing serum. the HSC culture was fractioned according to molecular size using the centrifugal filters (Millipore). The 100–250KD portion was most bioactive in inducing H-MC. Electrophoresis analysis (SDS-PAGE) revealed a few bands from 75 to 250KD in HSC supernatant that was absent in control (Supplementary Fig. 3B). These bands were analyzed for peptide sequences by capillary LC-tendem MS and the CID spectra. The sequences were searched against the mouse RefSeq Database (NCBI), as well as against Bovine Protein Database (to rule out possible bovine protein interferences). Two groups of molecules were detected (Supplementary Table 1): 1) extracellular matrices, which were expected; 2) complement, including complement component 3 (C3) and complement factor H (FH), which was beyond expectation, because C3 and FH are mainly produced by hepatocytes. The contamination of hepatocytes in HSC culture was ruled out by 1) no detectable albumin in supernatant (ELISA), 2) no hepatocytes were morphologically identified microscopically (data not shown). Western blotting data showed bands of C3 subunits C3α and β and FH in the HSC culture supernatant (serum free medium) (Supplementary Fig. 3C). Depletion of C3 (by addition of specific mAb into HpSC supernatant, precipitated and removed using protein-A agarose followed by centrifugation) markedly reduced (not entirely inhibited) the ability to induce H-MC (Supplementary Fig. 3D), suggesting a crucial role of C3 produced by HSC, and other factor (s) may also be involved. Indeed, flow analysis of intracellular staining showed that almost all HSC that were used for cotransplantation were C3 positive (Supplementary Fig. 3E). Consistently, the histochemical staining of islet/HSC grafts demonstrated that the islets were surrounded by HSC (α-SMA+) cells that were C3 positive. Single α-SMA+ cells scattered in the islet grafts were vessel smooth muscle cells (Supplementary Fig. 3F).
H-MC demonstrate immunosuppressive activity in vitro
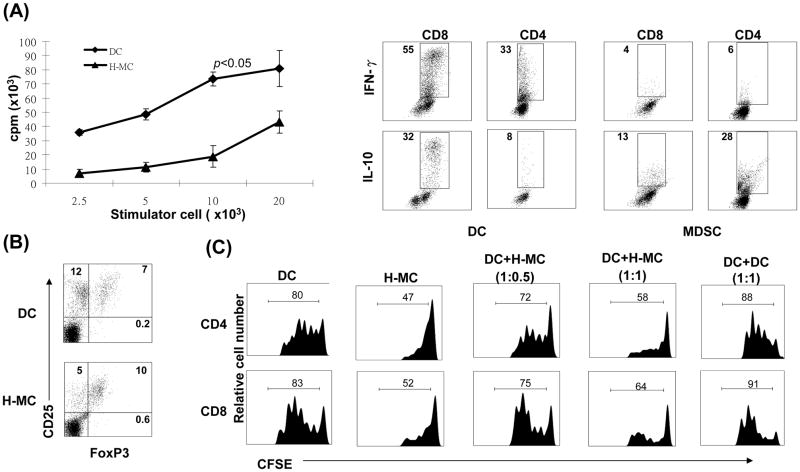
The immune stimulatory activity of H-MC was examined in a one-way MLR assay. H-MC elicited significantly lower proliferative responses in allogeneic T cells, compared to DC (Fig. 6A). Intracellular staining revealed that, compared to DC, T cells stimulated by H-MC produced less IFN-γ, but more IL-10 (Fig. 6A). The impact of H-MC on generation of Treg cells was examined by multiple color staining for CD4, CD25 and Foxp3. Compared to DC, H-MC inhibited generation of CD25+Foxp3− effector cells, but preferentially enhanced the frequency of CD25+Foxp3+ Treg cells, resulting in a marked increase in Treg:effector ratio (0.6 in DC vs. 2.0 in H-MC group) (Fig. 6B).
Figure 6. H-MC inhibit T cell response in vitro.
(A) H-MC elicit low T cell proliferative response. Spleen T cells (2 × 10⁶/well) from BALB/c (H-2d) were cultured with graded numbers of irradiated DC or H-MC from B6 (H-2b) mice in triplicate for 3 days. The proliferative response was determined by 3H-thymidine incorporation, and expressed as mean cpm ± 1SD. Expression of IFN-γ and IL-10 was determined by intra-cellular staining with specific mAbs. The number is percentage of positive cells in CD4+ or CD8+ population. (B) Treg cells were identified by multi-color stained for CD4, CD25 and Foxp3, and analyzed by flow cytometry. The number is percentage of positive cells in CD4+ population. (C) H-MC inhibit T cell proliferative response. CFSE labeled BALB/c spleen T cells were cultured with irradiated B6 DC at a ratio of 20:1 for 3 days. B6 H-MC were added at the beginning into the culture at an DC: H-MC ratio of 1:0.5 or 1:1. Addition of DC, instead of H-MC, at a ratio of 1:1 served as control. The proliferation of T cells was determined by CFSE dilution gated in CD4+ and CD8+ populations. The data are representative of three separate experiments.
To test the ability of H-MC to suppress T cells responses, H-MC were added into an MLR culture in which CFSE-labeled T cells were stimulated by allogeneic DC. Addition of H-MC suppressed proliferative responses (CFSE dilution) in both CD4+ and CD8+ T cells in a dose dependent manner. T cell inhibition was not due to overcrowding of APC in the culture since addition of the same number of DC did not inhibit T cell proliferation (Fig. 6C), indicating that the T cell response was inhibited by H-MC.
H-MC inhibit T cell responses in vivo
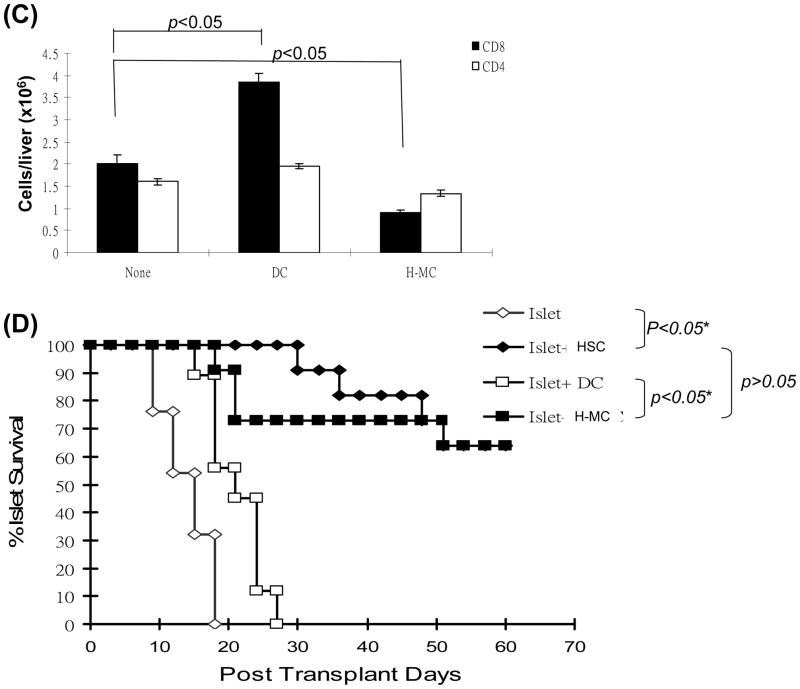
We first tested the inhibitory effect of H-MC in vivo using the OVA-HEP transgeneic mice in which membrane-bound OVA is specifically expressed on hepatocytes (23). Adoptive transfer of OVA specific CD4+ (2 × 10⁶) and CD8+ T cells (5 × 10⁶) led to elevation of ALT in OVA-HEP mice, peaking on day 3 post transfer (Fig. 7A). This was associated with infiltration of CD4+ and CD8+ T cells in the portal areas of the liver peaking on day 6 (Fig. 7B). When 1.5 × 10⁶ DC were intravenously injected immediately after adoptive transfer of OVA specific CD4+ and CD8+ T cells, serum ALT was elevated. Whereas, H-MC treatment maintained ALT levels comparable to controls (Fig. 7A). Immunohistochemical staining demonstrated that administration of DC increased OVA-specific CD8+ cell infiltration in the portal areas, while limited infiltration of specific CD8+ cells was seen following H-MC administration (Fig. 7B and C), suggesting that H-MC inhibit effector T cell response in vivo. This was reexamined in a cell transplant model. 300 BALB/c islets were mixed with 5 × 10⁶ H-MC or DC and transplanted into diabetic recipients. Cotransplantation with MDSC, but not DC, protected islet allografts as effectively as cotransplantation with 5 × 10⁵ HSC (Fig. 7D).
Figure 7. H-MC inhibit T cell response in vivo.
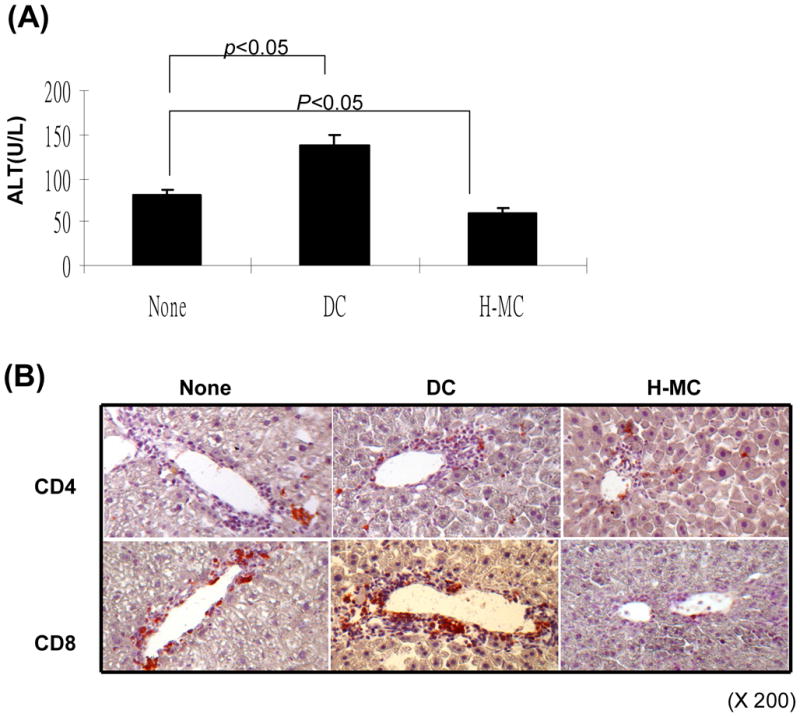
(A) Administration of H-MC attenuates liver damage. DC or H-MC (1.5 × 10⁶) that had been pulsed with OVA were intravenously injected into OVA-HEP mice whose liver injury was induced by adoptive transfer of T cells from OT-1 (5 × 10⁶) and OT-II (2 × 10⁶) mice. Serum was obtained on day 3 post cell injection, and tested for ALT with specific kit. (B) Administration of H-MC leads to less antigen specific CD8+ infiltrating cells in the liver. The animals were sacrificed on day 6 post cell transfer. The liver cryostat sections were histochemically stained with anti-CD4 or -CD8 mAb, and examined by microscopy. (C) A total of 30 high power fields (hpf) were randomly selected in each liver (n=3), and counted for CD4+ and CD8+ cells. The data are expressed as cell number/hpf ± 1SD. (D) Cotransplantation with H-MC effectively protects islet allografts. 300 BALB/c islets were mixed with 2, 5 × 10⁶ of H-MC or DC generated from B6 BM by co-culture with HSC either from B6, BALB/c or C3H strain, and transplanted into diabetic B6 recipients. Islet allografts alone served as controls. The islet graft survival was monitored by blood glucose level as described in Methods.
Taken together, these results demonstrate that the H-MC share many properties with MDSC, and that in vitro generated MDSC can replace HSC for protecting cell transplants, but 10 times more cells are required.
Discussion
It is not surprising that the liver contains cells that have powerful immune regulatory activity as liver is an immune privilege organ (6). Due to the anatomical location and function, the liver is continuously exposed to various antigens, including dietary and commensal proteins. In the long journey of evolution, the liver has acquired ability to control inappropriate immune response to those harmless antigens. HSC appear to be the main players in regulating immune response, as that cotransplantation with HSC effectively protect islet allografts via induction of effector T cell apoptosis and induction of Treg cells (10–12). The current study demonstrates that, different from islet alone grafts where accumulate DC (CD11c+), islet/HSC grafts recruit CD11b+CD11c− cells that shared many characteristics with MDSC (16,20,24), suggesting that HSC are potent MDSC inducers. This is strongly supported by the in vitro data that addition of HSC into BM cell culture markedly inhibits propagation of CD11c+ DC, while promotes generation of CD11b+CD11c− cells that display potent MDSC activity, which is mediated by soluble factor (s).
The data in this study suggested that C3 produced by HSC is important in mediating MDSC. This interesting finding raises several questions. Most importantly, since C3 is abundant in serum, why are MDSC only induced by HSC-produced C3? There are several possiblities: 1) C3 produced by HSC is different from that in serum possibly due to an alternative slicing process and/or posttranslational modification which affect its bioactivity; 2) C3 is produced as an inactive form. MDSC differentiation may be mediated by ligation of an activated C3 product to its associated receptor (e.g. C3aR/C5aR) expressed on myeloid progenitors. It remains unclear what activated product of C3 is involved and how it is activated, and whether the ligation will further modulate HSC activities through autocrine fashion, which may lead to releasing other MDSC promoting factors by HSC; 3) locally high concentration of C3 is critical in the interaction between HSC and myeloid progenitors. We will address these questions using HSC or BM or islets from C3−/− and C3aR−/− or C5aR−/− mice in future investigations.
MDSC are heterogeneous mixture of myeloid cells with potent immunosuppressive functions. Expression of CD11b and Gr-1 (a cell surface marker for mature granulocytes), has been used in some studies as a marker for mouse MDSC, although there is no gene equivalent to Gr-1 in humans (16). The data in this study show a significant portion of CD11b+ cells isolated from islet/HSC grafts being Gr-1+, while similar levels of Gr-1 are also expressed on CD11b+ cells from islet alone grafts (do not display MDSC activity), suggesting that many CD11b+Gr-1+ cells are not MDSC, therefore, Gr-1 is unlikely a reliable marker for MDSC in this experimental setting. This is in agreement with other reports (25).
It has been shown that inflammation is required for induction of MDSC, although the underlying mechanisms are not completely understood (21,22). The results of this study suggest that specific tissue stromal cells, such as HSC, play a role in mediating induction of MDSC. Use of IFN-γR1 knockout mice has allowed us to conclusively show that the IFN-γ signaling in HSC is absolutely required for induction of MDSC, which is however, unlikely mediated by B7-H1, an important IFN-γ signaling product of HSC (12), implicating an involvement of other yet to be identified IFN-γ signaling product (s). Our findings that IFN-γR1 knockout HSC induce markedly reduced, almost background, levels of MDSC is consistent with the concept that IFN-γ is an essential trigger for the induction of MDSC.
MDSC have been shown to induce Treg cells (18), raising the possibility that, in addition to the direct effect of HSC on Treg cell differentiation (28), MDSC may also play an important role in induction of Treg cells. In the current study, an increase in MDSC numbers in islet/HSC cotransplantation is well correlated with increase in Treg levels, suggesting that both MDSC and Treg are contributing to immune dysfunction in protection of islet allografts. This is in agreement with a recent report that a highly significant correlation between the changes in MDSC and Treg cells in response to cancer chemotherapy (29,30). It has been shown that MDSC promote the expansion of a preexisting pool of Treg cells (18,31). On other hand, depletion of Treg hampers accumulation of MDSC (32), reflecting close, but complicated interactions between these two suppressor cell populations. Although depletion of MDSC is a definitive approach to verify the role of MDSC, we hesitated to use anti-Gr-1 mAb as suggested by others (33), since expression of Gr-1 in CD11b+ cells from islet/HSC grafts was similar to that from islet alone grafts (Fig. 1C), making the anti-Gr-1 administration data difficult to interpret. This is consistent with other reports demonstrating that CD11b+Gr-1low, but not CD11b+Gr-1high, cells exerted T cell inhibition (34). Further investigation is therefore warranted to determine whether this is due to the each other influence of MDSC and Treg cells or rather due to a common target of HSC, which is shared by MDSC and Treg cells.
The scenario that, under inflammatory stimulation (an environment of allografting), HSC recruit both Treg cells and MDSC by that help the islet allografts evade host immunity leads us to speculating that HSC may implement a strategy similar to malignant cells that evade immune surveillance by the formation of lymphoid tissue-like structure recruiting Treg cells and myeloid suppressor cells under condition of persistent inflammation or infection (35–37). It remains unclear why HSC cotransplantation did not induce systemic tolerance, at least in early phase, as showing in our previous report; transplant HSC/islet in left kidney failed to protect islet allografts simultaneously transplanted in right kidney (11). It could be that establishment of systemic tolerance takes time. We will kinetically examine the tolerance status of the recipients bearing long-term survival islet allografts. Nevertheless, an increase in suppressor cells is not always associated with graft acceptance, thus, enhanced Tregs are also seen in allograft rejection (12). The ultimate fate of a transplanted graft results from the balance between immune effectors and regulators, which involves an elaborate mechanism at multiple levels.
Supplementary Material
Acknowledgments
We thank Dr. Lieping Chen (Johns Hopkins University Medical School) for providing B7-H1 knockout mice (B6).
Financial Support: This study was partially supported by funds from US National Institute of Health Grant R01DK084192 to L. Land AI090486 to S.Q.
Abbreviations
- APC
antigen-presenting cells
- ABC
avidin-biotin-alkaline phosphatase complex
- BM
bone marrow
- CFSE
carboxyfluorescein diacetate succinimidyl ester
- DC
dendritic cells
- ELISA
enzyme-linked immunosorbent assay
- Gr-1
granulocyte-differentiation antigen-1
- HSC
hepatic stellate cells
- H-MC
HSC-conditioned myeloid cells, hpf, high power field
- LN
lymph node
- MLR
Mixed leukocyte reaction
- mAb
monocloncal antibody
- MDSC
myeloid-derived suppressor cells
- NPC
nonparenchymal cells
- POD
post operative day
- qPCR
quantitative polymerase chain reaction
- SMA
smooth muscle actin
- Treg
T regulatory
- WT
wild type
References
- 1.Calne RY, Sell RA, Pena JR, Davis DR, Millard PR, Herbertson BM, Binns RM, et al. Induction of immunological tolerance by porcine liver allografts. Nature. 1969;233:472–474. doi: 10.1038/223472a0. [DOI] [PubMed] [Google Scholar]
- 2.Kamada N, Brons G, Davies HS. Fully allogeneic liver grafting in rats induces a state of systemic nonreactivity to donor transplantation antigens. Transplantation. 1980;29:429–431. doi: 10.1097/00007890-198005000-00021. [DOI] [PubMed] [Google Scholar]
- 3.Qian S, Demetris AJ, Murase N, Rao AS, Fung JJ, Starzl TE. Murine liver allograft transplantation: Tolerance and donor cell chimerism. Hepatology. 1994;19:916–923. doi: 10.1002/hep.1840190418. [DOI] [PMC free article] [PubMed] [Google Scholar]
- 4.Inobe J, Slavin AJ, Komagata Y, Chen Y, Liu L, Weiner HL. IL-4 is a differentiation factor for transforming growth factor-beta secreting Th3 cells and oral administration of IL-4 enhances oral tolerance in experimental allergic encephalomyelitis. Eur J Immunol. 1998;28:2780–2790. doi: 10.1002/(SICI)1521-4141(199809)28:09<2780::AID-IMMU2780>3.0.CO;2-J. [DOI] [PubMed] [Google Scholar]
- 5.Cantor HM, Dumont AE. Hepatic suppression of sensitization to antigen absorbed into the portal system. Nature. 1967;215:744–745. doi: 10.1038/215744a0. [DOI] [PubMed] [Google Scholar]
- 6.Orlando G, Soker S, Wood K. Operational tolerance after liver transplantation. J Hepatology. 2009;50:1247–1257. doi: 10.1016/j.jhep.2009.03.006. [DOI] [PubMed] [Google Scholar]
- 7.Bowen DG, Walker CM. Adaptive immune responses in acute and chronic hepatitis C virus infection. Nature. 2005;436:946–952. doi: 10.1038/nature04079. [DOI] [PubMed] [Google Scholar]
- 8.Bumgardner GL, Orosz CG. Unsual patterns of alloimmunity evoked by allogeneic liver parenchymal cells. Immunological Reviews. 2000;175:260–279. doi: 10.1034/j.1600-0528.2002.017409.x. [DOI] [PubMed] [Google Scholar]
- 9.Bumgardner GL, et al. A functional model of hepatocyte transplantation for in vivo immunologic studies. Transplantation. 1998;65:53–61. doi: 10.1097/00007890-199801150-00011. [DOI] [PubMed] [Google Scholar]
- 10.Yu MC, Chen C-H, Liang X, Wang L, Gandhi CR, Fung JJ, et al. Inhibition of T cell responses by hepatic stellate cells via B7-H1 mediated T cell apoptosis. Hepatology. 2004;40:1312–1321. doi: 10.1002/hep.20488. [DOI] [PubMed] [Google Scholar]
- 11.Chen CH, Kuo L-M, Chang Y, Wu W, Goldbach C, Ross MA, et al. In vivo immune modulatory activity of hepatic stellate cells in mice. Hepatology. 2006;44:1171–1181. doi: 10.1002/hep.21379. [DOI] [PubMed] [Google Scholar]
- 12.Yang HR, Chou HS, Gu X, Wang L, Brown KE, Fung JJ, et al. Mechanistic insights into immunomodulation by hepatic stellate cells in mice: a critical role of interferon-γ signaling. Hepatology. 2009;50:1981–1991. doi: 10.1002/hep.23202. [DOI] [PMC free article] [PubMed] [Google Scholar]
- 13.Benson MJ, Pino-Lagos K, Rosemblatt M, Noelle RJ. Alltrans retinoic acid mediates enhanced T reg cell growth, differentiation, and gut homing in the face of high levels of co-stimulation. J Exp Med. 2007;204:1765–1774. doi: 10.1084/jem.20070719. [DOI] [PMC free article] [PubMed] [Google Scholar]
- 14.Sakaguchi S, Yamaguchi T, Nomura T, Ono M. Regulatory T Cells and Immune Tolerance. Cell. 2008;133:775–787. doi: 10.1016/j.cell.2008.05.009. [DOI] [PubMed] [Google Scholar]
- 15.Jiang G, Yang H-R, Wang L, Wildey GM, Fung JJ, Qian S, et al. Hepatic stellate cells preferentially expand allogeneic CD4+CD25+FoxP3+ regulatory T cells in an IL-2 dependent manner. Transplantation. 2008;86:1492–1502. doi: 10.1097/TP.0b013e31818bfd13. [DOI] [PMC free article] [PubMed] [Google Scholar]
- 16.Gabrilovich DI, Nagaraj S. Myeloid-derived suppressor cells as regulators of the immune system. Nat Rev Immunol. 2009;9:162–174. doi: 10.1038/nri2506. [DOI] [PMC free article] [PubMed] [Google Scholar]
- 17.Lu L, McCaslin D, Starzl TE, Thomson AW. Bone marrow-derived dendritic cell progenitors (NLDCs 145+, MHC class II+, B7-1dim. B7-2−) induce alloantigen-specific hyporesponsiveness in murine T lymphocytes. Transplantation. 1995;60:1539–1545. doi: 10.1097/00007890-199560120-00028. [DOI] [PMC free article] [PubMed] [Google Scholar]
- 18.Huang B, Pan PY, Li Q, Sato AI, Levy DE, Bromberg J, et al. Gr 1+ CD115+ immature myeloid suppressor cells mediate the development of tumor-induced T-regulatory cells and T-cell anergy in tumor-bearing host. Cancer Res. 2006;66:1123–1131. doi: 10.1158/0008-5472.CAN-05-1299. [DOI] [PubMed] [Google Scholar]
- 19.Zhang N, Schroppel B, Lai G, Jakubzick C, Mao X, Chen D, et al. Regulatory T cells sequentially migrate from inflamed tissue to draining lymph nodes to suppress the alloimmune response. Immunity. 2009;30:458–469. doi: 10.1016/j.immuni.2008.12.022. [DOI] [PMC free article] [PubMed] [Google Scholar]
- 20.Gallina G, Dolcetti L, Serafini P, De Santo C, Marigo I, Colombo MP, et al. Tumors induce a subset of inflammatory monocytes with immunosuppressive activity on CD8+ T cells. J Clin Invest. 2006;116:2777–2790. doi: 10.1172/JCI28828. [DOI] [PMC free article] [PubMed] [Google Scholar]
- 21.Bunt SK, Sinha P, Clements VK, Leips J, Ostrand-Rosenberg S. Inflammation induces myeloid-derived suppressor cells that facilitate tumor progression. J Immunol. 2006;176:284–290. doi: 10.4049/jimmunol.176.1.284. [DOI] [PubMed] [Google Scholar]
- 22.Sinha P, Clements VK, Fulton AM, Ostrand-Rosenberg S. Prostaglandin E2 promotes tumor progression by inducing myeloid-derived suppressor cells. Cancer Res. 2007;67:4507–4513. doi: 10.1158/0008-5472.CAN-06-4174. [DOI] [PubMed] [Google Scholar]
- 23.Buxbaum J, Qian P, Allen PM, Peters MG. Hepatitis resulting from liver-specific expression and recognition of self-antigen. J Autoimmunity. 2008;31:208–215. doi: 10.1016/j.jaut.2008.04.015. [DOI] [PMC free article] [PubMed] [Google Scholar]
- 24.Hoechst B, Ormandy LA, Ballmaier M, Lehner F, Kruger C, Manns MP, et al. A New Population of Myeloid-Derived Suppressor Cells in Hepatocellular Carcinoma Patients Induces CD4+CD25+Foxp3+ T Cells. Gastroentrol. 2008;135:234–243. doi: 10.1053/j.gastro.2008.03.020. [DOI] [PubMed] [Google Scholar]
- 25.Sawanobori Y, Ueha S, Kurachi M, Shimaoka T, Talmadge JE, et al. Chemokine-mediated rapid turnover of myeloid-derived suppressor cells in tumor-bearing mice. Blood. 2008;111:5457–5466. doi: 10.1182/blood-2008-01-136895. [DOI] [PubMed] [Google Scholar]
- 26.Kusmartsev S, Gabrilovich DI. Immature myeloid cells and cancer-associated immune suppression. Cancer Immunol Immunother. 2002;51:293–298. doi: 10.1007/s00262-002-0280-8. [DOI] [PMC free article] [PubMed] [Google Scholar]
- 27.Bronte V, Chappell DB, Apolloni E, Cabrelle A, Wang M, Hwu P, et al. Unopposed production of granulocyte-macrophage colony-stimulating factor by tumors inhibits CD8+ T cell responses by dysregulating antigen-presenting cell maturation. J Immunol. 1999;162:5728–5737. [PMC free article] [PubMed] [Google Scholar]
- 28.Jiang G, Yang H-R, Wang L, Wildey GM, Fung JJ, Qian S, et al. Hepatic stellate cells preferentially expand allogeneic CD4+CD25+FoxP3+ regulatory T cells in an IL-2 dependent manner. Transplantation. 2008;86:1492–1502. doi: 10.1097/TP.0b013e31818bfd13. [DOI] [PMC free article] [PubMed] [Google Scholar]
- 29.Ko JS, Zea AH, Rini BI, Ireland JL, Elson P, Cohen P, et al. Sunitinib mediates reversal of myeloid-derived suppressor cell accumulation in renal cell carcinoma patients. Clin Cancer Res. 2009;15:2148–2157. doi: 10.1158/1078-0432.CCR-08-1332. [DOI] [PubMed] [Google Scholar]
- 30.Vincent J, Mignot G, Chalmin F, Ladoire S, Bruchard M, Chevriaux A, et al. 5-fluorouracil selectively kills tumor-associated myeloid-derived suppressor cells resulting in enhanced T cell–dependent antitumor immunity. Cancer Res. 2010;70:3052–3061. doi: 10.1158/0008-5472.CAN-09-3690. [DOI] [PubMed] [Google Scholar]
- 31.Serafini P, Mgebroff S, Noonan K, Borrello I. Myeloid-derived suppressor cells promote cross-tolerance in B-Cell lymphoma by expanding regulatory T cells. Cancer Res. 2008;68:5439–5449. doi: 10.1158/0008-5472.CAN-07-6621. [DOI] [PMC free article] [PubMed] [Google Scholar]
- 32.Ambrosino E, Spadaro M, Iezzi M, Curcio C, Forni G, Musiani P, et al. Immunosurveillance of Erbb2 carcinogenesis in transgenic mice is concealed by a dominant regulatory T-cell self-tolerance. Cancer Res. 2006;66:7734–7740. doi: 10.1158/0008-5472.CAN-06-1432. [DOI] [PubMed] [Google Scholar]
- 33.Serafini P, Meckel K, Kelso M, Noonan K, Califano J, Koch W, et al. Phosphodiesterase-5 inhibition augments endogenous antitumor immunity by reducing myeloid-derived suppressor cell function. J Exp Med. 2006;203:2691–2702. doi: 10.1084/jem.20061104. [DOI] [PMC free article] [PubMed] [Google Scholar]
- 34.Connolly MK, Clair JM, Bedrosian AS, Mahotra A, Vera V, Ibrahim J, et al. Distinct populations of metastases-enabling myeloid cells expand in the liver of mice harboring invasive and preinvasive intra-abdominal tumor. J Leukoc Biol. 2010;87:713–725. doi: 10.1189/jlb.0909607. [DOI] [PMC free article] [PubMed] [Google Scholar]
- 35.Shields JD, Kourtis IC, Tomei AA, Roberts JM, Swartz MA. Induction of lymphoid like stroma and immune escape by tumors that express the chemokine CCL21. Science. 2010;328:749–752. doi: 10.1126/science.1185837. [DOI] [PubMed] [Google Scholar]
- 36.Aloisi F, Pujol-Borrell R. Lymphoid neogenesis in chronic inflammatory diseases. Nat Rev Immunol. 2006;6:205–217. doi: 10.1038/nri1786. [DOI] [PubMed] [Google Scholar]
- 37.Cupedo T, Jansen W, Kraal G, Mebius RE. Induction of secondary and tertiary lymphoid structures in the skin. Immunity. 2004;21:655–667. doi: 10.1016/j.immuni.2004.09.006. [DOI] [PubMed] [Google Scholar]
Associated Data
This section collects any data citations, data availability statements, or supplementary materials included in this article.


