Abstract
Protein adsorption is fundamental to thrombosis and to the design of biocompatible materials. We report a two-dimensional electrophoresis and mass spectrometry study to characterize multiple human plasma proteins adsorbed onto four different types of model surfaces: silicon oxide, dextranized silicon, polyurethane and dextranized polyurethane. Dextran was grafted onto the surfaces of silicon and polyurethane to mimic the blood-contacting endothelial cell glycocalyx surface. Surface topography and hydrophobicity/hydrophilicity were determined and analyzed using atomic force microscopy and water contact angle measurements, respectively. Using two-dimensional electrophoresis, we show that, relative to the unmodified surfaces, dextranization significantly inhibits the adsorption of several human plasma proteins including IGHG1 protein, fibrinogen, haptoglobin, Apo A-IV, Apo A-I, immunoglobulin, serum retinal-binding protein and truncated serum albumin. We further demonstrate the selectivity of plasma protein adsorbed onto the different functionalized surfaces and the potential to control and manipulate proteins adsorption on the surfaces of medical devices, implants and microfluidic devices. This result shows that adsorption experiments using a single protein or a binary mixture of proteins are consistent with competitive protein adsorption studies. In summary, these studies indicate that coating blood-contacting biomedical applications with dextran is an effective route to reduce thrombo-inflammatory responses and to surface-direct biological activities.
Introduction
Thousands of blood-contacting medical implants and devices are used every year; however, patients continue to suffer complications from blood clotting, tissue inflammation, and infection [1]. In particular, vascular catheters and stents often lead to surface-induced thrombosis, initiated by plasma protein adsorption onto the surfaces [2]. Protein adsorption is the first event that impacts bioresponses including platelet activations, cell adhesion, cell migration and bacteria adhesion, and consequently, determines the biocompatibility of a biomaterial [3-5]. Here, we describe a two-dimensional electrophoresis and mass spectrometry study to identify and evaluate multiple plasma proteins adsorbed onto dextranized surfaces and their synthetic analogues. Understanding the adsorption of plasma protein components onto surfaces is critical to elucidate the mechanisms leading to surface-induced thrombosis and inflammation. Additionally, this has potential to direct and select specific proteins as a route to improve the design of materials for medical devices and implants.
The endothelial glycocalyx plays an important role in vascular wall homeostasis. It is a carbohydrate-rich surface layer of the vascular endothelium connected to the endothelium through several backbone molecules [6;7]. Mimicking endothelial glycocalyx as a coating strategy for surfaces of catheters, stents and other intravascular medical devices has potential to confer advantages of a biological structure that naturally minimizes the events leading to thrombosis and inflammation [8]. Dextran is chosen as a simple approach since sugars are prevalent constituents of model the endothelial glycocalyx layer. Previously, our laboratories have demonstrated dextranized silicon inhibits adsorption of bovine serum albumin, bovine fibrinogen and their binary mixture [9]. Marchant's group has covalently linked poly (vinyl amine) with dextran and show such surfactant polymer coating reduces platelet adhesion on polycarbonate surface [10]. Other laboratories have applied other components of the endothelial glycocalyx to surfaces to improve the material's biocompatibility and hemocompatibility. For example, Stile et al. have grafted hyaluronic acid to glass substrates; and others have improved biocompatibility by employing heparin to coat the surfaces [11-14]. Interestingly, the adsorption of antithrombin among the plasma proteins can be increased by immobilizing antithrombinheparin complex to the surface of a catheter [15].
Various strategies can be utilized to graft biomacromolecules to synthetic polymeric surfaces. One common method is immobilization by gas-plasma-activated polymer surfaces. Dai et al. covalently linked polysaccharides to the surfaces of Teflon and poly-1-trimethylsilyl-1-propyne by plasma treatment using ammonia gas [16]. Another technique is to functionalize the surfaces with amine groups by diamines [17] or silanes [18] and then couple to the acid groups in the biomacromolecules [19;20]. In this work, we covalently linked dextran onto the surfaces of polyester-based polyurethane, a common biomaterial for medical devices, and silicon wafers for applications related to biochips. The polysaccharide dextran is FDA approved, and thus, an excellent biopolymer as an initial step in incorporating macromolecules comprising the endothelial glycocalyx. Amine groups were introduced to the surfaces of polyurethane and silicon by 1,6-diaminohexane and aminopropyl-triethoxysilane, respectively. The dextranized layer was characterized using ellipsometry, contact angle, fluorescence microscopy and atomic force microscopy to understand its surface chemistry and topography.
Several studies have elucidated the kinetics and thermodynamics of protein adsorption [21;22] onto biomimetic surfaces [23], polymeric surfaces [24], glass [22] and metals [25]. However, most experiments are limited to the adsorption of one to two proteins [26-28]. Some experiments have identified several proteins using SDS-PAGE and immunoblots [26;29], but this method is restricted to proteins that have antibody probes and to analysis that separates proteins by their molecular weight alone. Use of the Western blot approach such as in [30] has served an important foundational role for positive identification of individual proteins and provides a gateway for use of more discrete electrophoresis methods. Two-dimensional electrophoresis is a promising method because it does not rely on radiolabeling or the availability of antibodies [31;32]. The technique allows analysis on a range of different proteins based on their isoelectric points and molecular weights [30;33-35]. Two-dimensional electrophoresis has been used extensively to evaluate protein adsorption onto nanoparticles designed for targeted drug delivery [34;36-41], yielding important information regarding effects of surface hydrophobicity, influence of surfactants, as well as effects of surface charge density on protein adsorption profiles. In other biomaterials applications investigating cell-material interactions, fluorescence two-dimensional difference gel electrophoresis (DiGE) has proven to be a valuable research tool in the study of cellular responses to biomaterials [42]. There are additional techniques for evaluating the molecular basis for cell interactions with biomaterials which rely on proteomic and transcriptomic technologies [43].
Regarding blood contact with biomaterial surfaces, Rosengren et al. [44] reported the use of two-dimensional electrophoresis and found preferential plasma protein adsorption of fibronectin and fibrinogen on the bioactive glass-ceramics, nevertheless, a diluted plasma protein was used in their study. Feng et al. [45] identified 25 plasma proteins using plasma that was diluted 30-fold.
In our study, we have investigated competitive protein adsorption using undiluted human plasma and by measuring the relative absorbed amount of various proteins using two-dimensional electrophoresis coupled with mass spectrometry for molecular identification. We hypothesized that dextranized surfaces would resist adsorption of multiple plasma proteins in the native human plasma concentration and that differences in the specific adsorption profiles would relate directly to distinct structural features of the grafted dextran layers on the different substrates.
Materials and Methods
Surface Preparation and Characterization
Materials
All reagents and solvents were used as received unless otherwise stated. 3-Aminopropyl triethoxysilane (APTES), sodium periodate (NaIO4), sodium cyanoborohydrate (NaBH3CN), 1, 6-diaminohexane, and dimethylformamide were purchased from Sigma-Aldrich Co. and Fisher Scientific. Dextran is from Leuconostoc mesenteroides with MW of 64,000 - 76,000 (Sigma # D4751). Silicon oxide surfaces were purchased from Silicon Quest International (Santa Clara, CA).
Dextranized silicon surfaces
A monolayer of dextran was synthesized on silicon wafers as has been described in Miksa et al. [46] and Martwiset et al. [47]. Briefly, dextran is covalently grafted onto silicon via amine-functional self-assembled monolayer (SAMs) of (3-Aminopropyl) triethoxysilane or APTES, Figure 1A. All silicon surfaces were cleaned by immersion in “piranha” solution (70% H2SO4 and 30% H2O2, v/v) for 20 min. at 80 °C to ensure a homogeneous silanol layer that could react with APTES. The surfaces were washed with copious amounts of water and dried in an oven. Upon obtaining a dried clean silicon surface, the silane APTES reaction was carried out immediately, followed by dextranization of the amine surfaces. The APTES surfaces were immersed in aqueous oxidized dextran solution. Dextran solution (2 mg/mL) was prepared and oxidized using 1.5 g of NaIO4 in the reaction. After oxidizing for 1 hour, NaBH3CN (15 mg) was dissolved into the oxidized solution. Our previous investigation shows that increasing oxidation time increases the formation of the aldehyde groups [46]. The one hour oxidation time is chosen for the optimal dextran thickness and coverage. This oxidation time gives approximately 30% oxidation, as reported previously using 1H NMR and pH measurements [46]. The amine functionalized surfaces were immersed in the oxidized dextran solution and the reaction was placed on an orbital shaker for 1 day. The dextranized surfaces were removed from the solution and washed with copious amounts of water. Contact angle and film thickness were measured to ensure consistency of covalently attached dextran layers on the amine functionalized surfaces. Surfaces were further examined using scanning force microscopy (Veeco Dimension 3100) and the images obtained were analyzed for the characteristics and dimensions of those features present.
Figure 1.
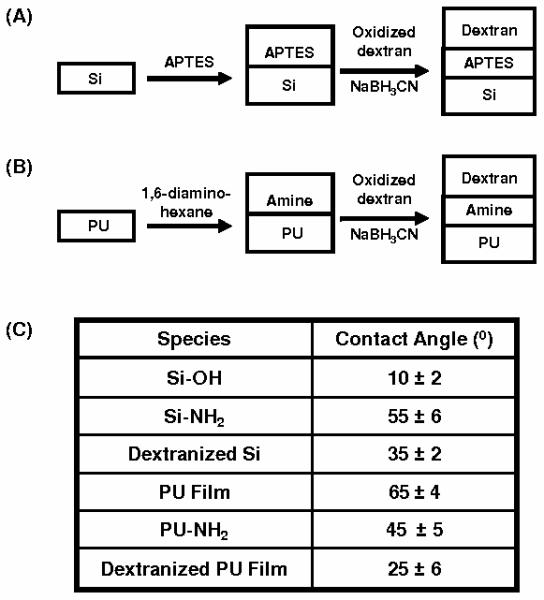
Schematic representation of (A) grafting of dextran to silanized (APTES) silicon surfaces; (B) aminolysis reaction of PU film followed by grafting of dextran molecules and (C) the contact angle for each surfaces.
Dextranized polyurethane films
Polyester-based polyurethane [48] tubes (Fisher Scientific; Nalgene 280 Polyurethane Tubing; # 14-176-174) were cut into small pieces and dissolved in 15 ml of tetrahydrofuran (THF) over two days. The PU films were formed by solution casting, allowing the THF solvent to evaporate over four days, yielding a transparent film. The PU films were then functionalized using 1,6-diaminohexane in water at 25 °C. The samples were removed from the solution after the grafting reaction, washed with water, and then dried. Oxidized dextran macromolecules were grafted onto the aminated PU film using 15 mg of NaBH3CN for one day, Figure 1B. Dextrans were oxidized using the same procedure as described for silicon wafers. As with dextranized silicon, the dextranized PU surfaces were characterized using contact angle measurements, ellipsometry and atomic force microscopy.
Human plasma protein adsorption and desorption
Human plasma proteins
Using a University of Pennsylvania Institutional Review Board approved protocol for blood sample acquisition by venipuncture, human blood was obtained from adult volunteers. Blood was drawn into citrated syringes (9:1 blood:citrate ratio) and immediately centrifuged at 3200 rpm and separated to obtain fresh platelet-rich plasma. Subsequently, plasma proteins were adsorbed onto the study surfaces by immersing the prepared surface samples in the plasma without dilution for one and two hours on a shaker at 37 °C. Surfaces were moved to new Petri dishes to avoid collecting proteins absorbed to the Petri dishes. The samples were then rinsed with PBS (0.15M NaCl and 0.01M NaH2PO4) to remove loosely bound proteins. Surfaces were immersed in 1.5 mL of 1% sodium dodecyl sulfate (SDS) solution, placed in a sonicator for 20 minutes to elute the adsorbed proteins, and the eluent containing the adsorbed proteins was collected. This elution step was repeated and followed by another sonication with water, and the solution was again collected. In total, we obtained the eluted protein solutions from the three separate washes. These samples were combined and then dialyzed to remove the SDS, followed by lyophilization to obtain white powder proteins. Water was added to the lyophilized proteins to obtain a highly concentrated protein solution for two-dimensional gel electrophoresis.
X-ray photoelectron spectroscopy
The surfaces were evaluated for the completeness of protein elution using X-ray photoelectron spectroscopy (XPS) with a Physical Electronics Quantum 2000 spectrometer with a 200 μm spot size and monochromatic Al Kα radiation (1486.68 eV). The X-ray source was operated at 50 W and 15 kV. Core-level signals were obtained at photoelectron takeoff angles of 45° with respect to the sample surface.
Two-dimensional gel electrophoresis
All experiments were conducted twice to ensure repeatability of the gels. This resulted in our obtaining a total of 16 samples – two (Sample A and Sample B) for each of the four surface types studied at each of two plasma exposure durations (one and two hours) examined. The concentration of the desorbed protein solution was measured using a Shimadzu UV-Mini 1240 UV/Vis Spectrophotometer. For isoelectric focusing, at least 140 μg of the eluted plasma protein solutions were loaded onto rehydrated immobilized pH 3-10 nonlinear gradient strips (7 cm, BioRad). The IPG strips were rehydrated with plasma proteins for 12 hours at 20 °C. Isoelectric focusing was carried out from 0 to 300 V over 30 min, linearly increased to 4000 V over 3.5 hours, linearly increased to 5000 V over 2 hours and kept constant at 55,000 V-h at 5000 V. The gels were incubated for 10 min with equilibration buffer 1 (50 mM Tris-HCl, pH 8.8, 6 M urea, 30% glycerol, 69.3 mM SDS and 65 mM DL-DTT) and then with equilibration buffer 2 (50 mM Tris-HCl, pH 8.8, 6 M urea, 30% glycerol, 69.3 mM SDS and 260 mM iodoacetamide) for 10 min. The second dimension was applied on 12% gradient polyacrylamide gels at constant 150 V per gel until the dye front reached the lower end of the gel. For staining, each gel was stained with Coomassie Brilliant Blue R-250.
Two-dimensional gel image processing and software analysis
Two-dimensional gels were scanned using Typhoon 9410 Variable Mode Imager imaging with Typhoon Scanner Control 3.0 software. The PMT was set at 600V with normal sensitivity and 16-bit color depth. The resolution was set at 50 μm pixel size. Each gel image was saved in the original .gel format. The staining volume of the protein spots using Coomassie Brilliant Blue R-250 increases linearly with the protein loaded. In addition, each gel was scanned three times to verify the reproducibility of the gel-to-gel optical density. Images were analyzed using Progenesis software (Nonlinear Dynamics, Durham, NC, USA). Protein desorbed from a silicon wafer following two hours of plasma exposure was used to create one gel defined as the reference gel. Because the 16 gels are not exactly the same size, an image registration method is required in order to quantify the protein spots accurately. To do this, all gels were aligned to the reference gel. Progenesis Samespot software was utilized to warp the gels automatically to match specific spots on the reference gel to all the other gels. Each spot on the gels analyzed was also verified manually for removal of any artifacts. The software was then used to generate three-dimensional images of the spots and to calculate their resultant volumes. The lowest intensity around any one spot was taken as the background intensity and this was subtracted from the calculated volume. After the background subtraction step, the data were normalized. The software normalized the spot volume by multiplying the volume of the spot with a scaling factor, defined as 10RM, in which RM is the robust mean serving as the average of log (Vspot/Vreference) for all spots, excluding the outliers. The normalized volume is the quantification of the amount of protein eluted off the surface. None of the spots was manually edited to enhance image quality or to alter the quantitative analysis.
Protein identification via mass spectrometry
Selected protein spots were excised from the gel, placed in a tube and sent to the Proteomics Core Facility of the Genomics Institute and the Abramson Cancer Center, University of Pennsylvania for mass spectrometry (MS). Protein spots were trypsin digested and analyzed with a nanoLC/nanospray/LTQ mass spectrometer following typical procedures [49]. Briefly, 3 μl of the trypsin digested samples was injected with an autosampler from Eksigent. The digested samples were separated using 10 cm C18 columns, using nanoLC from Eksigent with a 200 nl/min flow rate, 45 min gradient. Online nanospray was used to spray the separated peptides into LTQ (Thermo Electron), and Xcalibur was utilized to acquire the raw data. The raw data files were searched using Mascot against the NCBI (National Center for Biotechnology Information) database with a cutoff protein score of 70. The cutoffs for confident protein identification have the following constraints: peptide score ≥ 30; P value of peptide < 0.05; protein score ≥ 70; number of unique peptides ≥ 2. The proteins identified are shown in Table 1 with the specific spot locations shown subsequently in a characteristic gel.
Table 1.
Corresponding protein spots on a typical gel (Figure 3) identified using mass spectrometry. Both protein spots in locations D and F were identified as IGHG1 proteins. Here, we differentiate the spots at locations D and F with superscript 1 and 2, respectively.
| Location | Protein Name | Structure (protein folding)§ |
|---|---|---|
| A* | Human serum albumin precursor |
Multihelical |
| B* | Human serum albumin | Multihelical |
| C* | Transferrin | Mixed beta-sheet of 5 strands |
| D* | IGHG1 Protein1 | Unknown |
| E | Fibrinogen gamma chain | Not a true fold; includes oligomers of shorter identical helices |
| F | IGHG1 Protein2 | Unknown |
| G | Haptoglobin precursor & Apolipoprotein A-IV precursor |
Two α- and two β-chains & Nearly all-beta |
| H | Apolipoprotein A-I | Tetrameric antiparallel coiled coil, closed in a circuit |
| I | Immunoglobulin light chain & Immunoglobulin kappa |
Sandwich; 7 strands in 2 sheets; greek-key & |
| J | Serum retinol-binding protein |
Unknown |
| K | Haptoglobin Hp2 | Two α- and two β-chains |
| L | Serum albumin (truncated) |
Multihelical |
Note: Spots A, B, C and D were not included in the quantitative analysis in Figures 5 and 6 since the spots were smeared out and connected with other protein spots.
The protein structure was searched under the general protein family, based on using SCOP: Structural Classification of proteins (http://scop.mrc-lmb.cam.ac.uk/scop/).
Results and Discussion
Dextran immobilization, surface morphology and contact angle
The surface of the dextranized silicon has a contact angle of 35 ± 2°, ranging from 33° to 37°, Figure 1C. The average thickness of dried dextran is 9 Å, with a range of 5 – 27 Å. These values are consistent with the values reported earlier. After solution casting and drying, the contact angle of polyurethane film is 65 ± 4°, as expected [50]. The contact angle for aminated PU film and dextranized PU film are 45 ± 5° and 25 ± 6°, respectively, showing the surface has become more hydrophilic, which is consistent with attachment of dextran on the surfaces. By this measure, the dextranized silicon and dextranized PU surfaces are not markedly different in regard to hydrophilicity. We also used rhodamine-dextran in certain experiments to confirm its binding to the PU film by fluorescence microscopy images showing bright area where confluent grafting occurs. Fluorescence imaging of control experiments carried out without NaBH3CN indicates the presence of the rhodamine-dextran. Together these findings indicate that rhodamine-dextran is present on the surfaces.
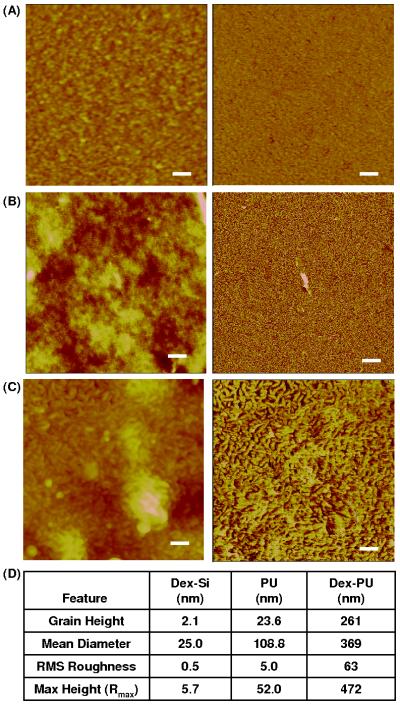
Figure 2 shows representative topography (left) and phase (right) scans of the surfaces of dextranized silicon (Figure 2A), polyurethane film (Figure 2B) and dextranized polyurethane film (Figure 2C). The AFM images were used to characterize the average dimensions of the features and the overall surface roughness, Figure 2D. The grain diameter is calculated by assuming the irregular feature as a circle having the same area. In all samples, the PU film and the dextranized PU film are rougher than the native silicon and dextranized silicon surfaces, respectively. The solution casted films generally have rough surfaces due to uneven solvent evaporation and undulations on the surfaces of the PU solution. The surface morphology for the dextranized silicon is comparable to the previously reported measurements.
Figure 2.
AFM images of dry (A) dextranized silicon, (B) PU film, and (C) dextranized PU film. The scanning sizes are 1 × 1 μm2 for dextranized silicon, and 5 × 5 μm2 for PU film and dextranized PU film. The scale bars are 100 nm for dextranized silicon, and 500 nm for PU film and dextranized PU film. The left and right images are topographical and phase data, respectively. (D) Quantitative analysis of the surface roughness.
Since PU is a block copolymer containing flexible and rigid segments, nanophase separation occurs. Figure 2B displays the typical PU morphology for solvent cast films having well distributed nano-sized domains with roughness on the order of several nanometers [51]. These nanophase separated segment domains are enhanced on the phase image, and become more prevalent after exposure to 1,6-diaminohexane. This leads us to speculate that a thin top layer covers the surface of PU film due to the low surface energy of one of the segments. McLean et al. [52] and Garret et al. [51] also observed a similar morphology and a thin top layer. After the 1,6-diaminohexane treatment, this top layer was removed, as shown by the distinct cylindrical domains in both the height and phase images. These nano-sized structures were retained after covalently attaching the dextran molecules, as seen in Figure 2C. The combination of the etching from diaminohexane, revealing the nanostructure of PU's block polymer, and the roughness presented by the solution casting, give larger grain height, mean diameter, roughness and maximum height for the surface of dextranized PU film compared to that of PU film. Overall, the feature size (grain height, mean diameter) and roughness of the dextranized PU surfaces are one to two orders of magnitude larger for those of the dextranized silicon surfaces.
X-ray photoelectron spectroscopy (XPS)
In using XPS to evaluate the effectiveness of the protein elution, sodium dodecyl sulfate (SDS) was used as the detergent to elute and solubilize proteins effectively [53;54]. These prior studies suggested possible incomplete desorption of proteins from the surfaces. In this paper, sonication was used to facilitate the removal of proteins. The surface concentration of nitrogen (at 45° or 2.5 nm) was negligible (< 0.1%) for the silicon oxide surface following use of 1% SDS in PBS plus sonication, repeated twice, plus one wash with water. This supports the premise that the elution method completely removes all proteins from the silicon wafers.
For dextranized silicon surfaces, XPS multiplex surveys at 45° or 2.5 nm detection depths showed the ratio of C to N on average is 11.1 for the control and 7.3 for the dextranized silicon having protein eluted with SDS and sonication. Our experimental value for the APTES layer is 7.6 for the aminated silicon. Others reported values ranges from 5.5 to 10.8, depending on the extent of hydrolysis [55]. Because the dextran thickness can range from 5 to 27 Å, detecting nitrogen from the APTES layer is highly possible. Moreover, the possibility of the amine groups exposed within the layer of dextran is also likely since the dextran layer looks patchy in the AFM image. It is difficult to determine whether the nitrogen is from the APTES or proteins. The XPS measurement also detected 2.7% sulfur and 2.1% sodium. Since the ratio of S to Na is close to 1, one can conclude that SDS has remained on the dextranized silicon; and that sulfur is most likely entirely from SDS and not from proteins. Based on the desorption studies on silicon and dextranized silicon, we conclude that the elution method used in this study removes the vast majority of the proteins from the dextranized surface.
For PU and dextranized PU substrates, XPS analysis of surfaces after desorption are difficult to interpret because the PU substrate contains nitrogen. As with dextranized silicon, sulfur and sodium were detected on the surfaces of the dextranized PU; the specific measures were 4.1% sulfur and 3.7% sodium. With an S:Na ratio of ~1, this result indicates that proteins containing sulfur are most likely completely eluted from the surface. Although XPS did not provide irrefutable evidence that our elution method completely removed all the proteins that adsorbed onto each of our four surfaces, we draw on other experimental evidence to demonstrate that our conclusion remains valid, as is discussed below.
Two-dimensional electrophoresis gels and spectrometry
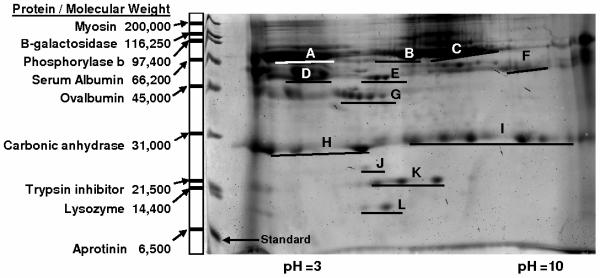
Figure 3 shows a typical Coomassie Blue stained two-dimensional electrophoresis 7 cm gel of the plasma proteins eluted from the surfaces of silicon. Coomassie Blue was used instead of silver staining, given that silver staining is not compatible with mass spectrometry for definitive identification of the proteins occupying the spots. The left lane in the gel is the standard protein ladder with the corresponding molecular weights. Notice, a few protein lines are slightly distorted due to the edge affects. The plasma proteins collected were separated by their isoelectric points in the horizontal direction (from pH 3 to 10) and by their molecular weight in the vertical direction (from 6,500 to 200,000 Da). There are dark smears which appear in the vertical direction in the background at low and high pH. These smears usually result from contamination that is difficult to remove. In our analysis, the software subtracts the background intensity around each individual protein spot. As a result, these vertical background smears do not contribute to the final quantification. Also, each protein spot bears a distinct background intensity due to its geographic location within either darker or lighter regions of the gel. By subtracting the background of each protein spot individually, we eliminate a potential compounding effect of variable background intensity throughout the gel.
Figure 3.
Representative two dimensional electrophoresis gel for protein adsorbed on silicon film. The left lane is the standard proteins with their corresponding molecular weights.
The software detected 208 spots. Artifacts were manually removed, leaving 34 significant spots. In Figure 3, each location is labeled to correspond with the protein that has the highest probability match in the proteomic database as evidenced by the MASCOT score and the high peptides matched. These are listed in greater detail in Table 1. Because we are using a small gel (7 cm), the protein spots do not precisely map to, or align to, the spots found on the larger gel in the protein gel database. Therefore we positively identified protein spots experimentally using mass spectrometry. A few proteins spots were identified to be different isoforms or truncated forms of a single protein. For example, all seven spots in location I are immunoglobulin, and all three spots in location K are Haptoglobin Hp2. A total of 12 different proteins were identified and listed in Table 1. In addition, the protein's molecular weight or pI in the gel does not necessarily have to correspond exactly to the protein identified in the NCBI database. As illustration, spot L is identified as human serum albumin and the molecular weight identified in the database is 66,472 Daltons. However, inspection of location L on the gel indicates the molecular weight is roughly 10,000 Daltons. This difference is attributed to the various forms of protein which exist following post-translational modification or phosphorylation [56]. For this reason, specific molecular weights and isoelectric points of the proteins identified are not listed in Table 1.
We have positively identified eight specific plasma proteins whose adsorption onto the dextranized silicon and PU surfaces is reduced in comparison to the native counterparts, namely, IGHG1 protein, fibrinogen, haptoglobin, Apo A-IV, Apo A-I, immunoglobulin, serum retinal-binding protein and truncated serum albumin. Furthermore, we have quantified the degree to which these surfaces resist or reduce protein adsorption at one and two hours of plasma exposure. Four additional proteins were rejected from the analysis because the spots on the gels were either too smeared out or connected to other spots. In general, two-dimensional electrophoresis of plasma proteins is challenging because the highly abundant proteins such as albumin and IgG, representing 85% of plasma proteins, mask the detection of the minor proteins [54]. Moreover, not all proteins can be assessed by two-dimensional gel analysis. Large proteins such as Apo-B100 are not readily analyzed because the protein may be trapped outside the gel. In other cases the protein may not be adequately separated by its isoelectric point or molecular weight. Furthermore, Coomassie Blue staining is less sensitive than other approaches (e.g., silver staining) for detection of minor protein constituents of plasma. For these reasons, we have undoubtedly missed detection of proteins such as the complement proteins, plasminogen, serum amyloid, transthyretin and others related to coagulation. Future studies using an effective albumin or IgG depletion method [57], larger gels or other proteomic techniques may increase the number of proteins identified [58].
Figure 4 represents a typical gel for each of the surfaces tested at one hour of plasma exposure. These gels end up being different sizes, but no shrinking or enlargement of the gel scans was edited during analysis the images. This size variation among the many samples is expected for gels undergoing staining during which each gel swells at its own unique rate.
Figure 4.
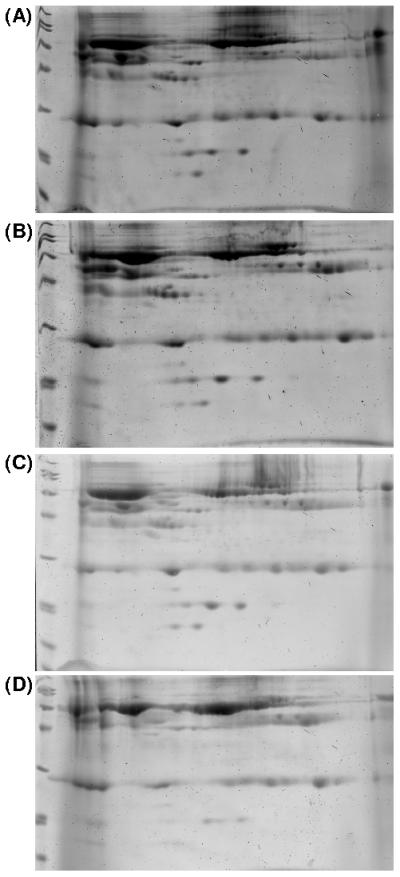
Representative Coomassie Blue 2D-PAGE gels of plasma protein adsorbed for one hour on (A) silicon wafer, (B) dextranized silicon, (C) polyester-based polyurethane and (D) dextranized polyester-based polyurethane film.
Typical problems encountered in spot quantification include detecting spots, matching spots and determination of spot boundary by estimation. We manually remove any artifacts presented in the gels to eliminate these potential sources of error, as well as limit our analysis to well defined spots. For instance, spots at location A, B, C and D for human serum albumin precursor, human serum albumin, transferrin and IGHG1, respectively, were not quantified since the spots were spread out and connected to other protein spots. When there is an overwhelming amount of protein, such as serum albumin, loaded into the gel, the protein spot usually bleeds into other regions and spreads out. Methodologically this serves as evidence for the presence of an abundant quantity of protein in the desorbed sample used for the gels. This thorough recovery of the proteome for analysis is accompanied by the presence of smeared protein spots at the low pI, and these are not further quantified.
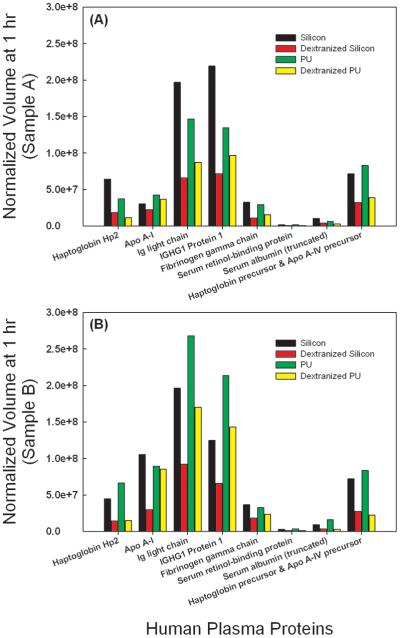
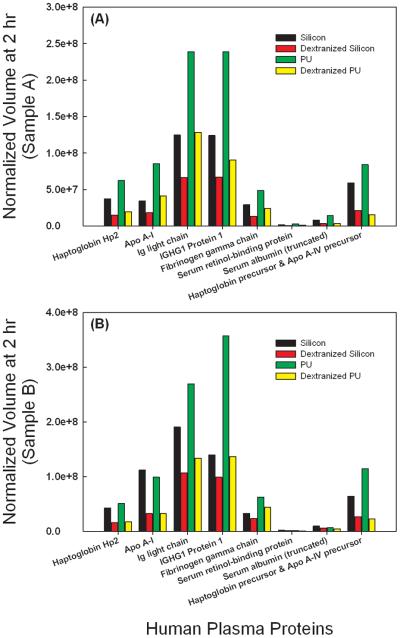
The dextranized surfaces were compared to their native substrates for each of two independent experiments. Results from the two separate trials were not averaged due to inter-individual variability for the different blood donors and lack of statistical power from averaging the small sample number. The individual results are still shown for direct comparison holding the source of the blood sample as a constant. Protein spots showing conflicting trends for the repeated gel were eliminated from the analysis. Thus, we present data for eight distinct proteins at both one (Figure 5) and two hours (Figure 6). Data with the same correlation for the two replicates were plotted in Figures 5 and 6 in subpanels A and B, separating out blood donors into either Sample A or Sample B for the gels developed. For proteins having more than one spot, isoforms of the same protein, spot volumes were added to quantify the total amount desorbed. For example, location I has seven spots for immunoglobulin or Ig light chain, and thus, the sum of all seven spot volumes is calculated to compare the adsorption of immunoglobulin on either the dextranized or the native, dextran-free surfaces. Following this technique, three spots were summed for Haptoglobin Hp2 and two spots were summed for truncated serum albumin, respectively.
Figure 5.
Direct comparison of normalized spot volumes of the two dimensional electrophoresis gel from protein eluted from silicon, dextranized silicon surfaces, PU and dextranized PU surfaces at one hour for samples A and B.
Figure 6.
Direct comparison of normalized spot volumes of the two dimensional electrophoresis gel from protein eluted from silicon, dextranized silicon surfaces, PU and dextranized PU surfaces at two hours for samples A and B.
Although others investigators have employed two-dimensional electrophoresis to examine a multitude of plasma proteins, those prior studies were commonly limited to use of diluted plasma proteins. Rosengren et al. [44] used 1 mg/ml and Ho et al. [59] diluted plasma to one third of its original concentration. Plasma protein concentration of a normal adults is about 7.7 g/100 mL [60]. We chose to conduct these experiments with no dilution to reflect an in vivo condition for blood contact with biomaterials. The results show that both dextranized silicon and dextranized polyurethane resist the adsorption of various human plasma proteins. This resistance continues up to two hours of plasma incubation, as depicted in Figures 6A and 6B. This is consistent with Ombelli et al.'s finding that dextranized silicon resists fibrinogen adsorption [9], as well as Holland's measurements using oligosaccharides [8]. Our results suggest that experiments with a single protein or with a two-protein mixture to study competition between select species yield important clues for understanding the more complex system of multi-component protein solutions such as human plasma.
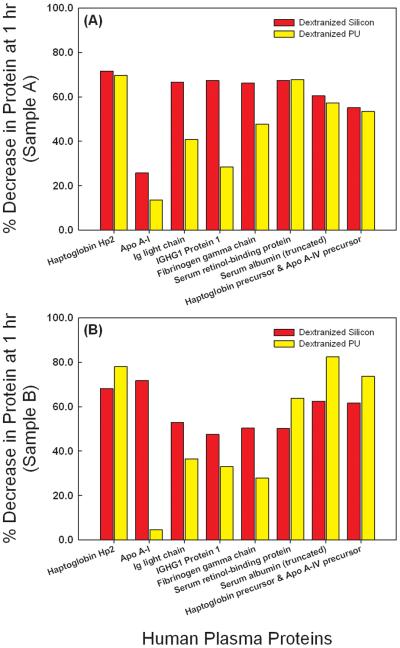
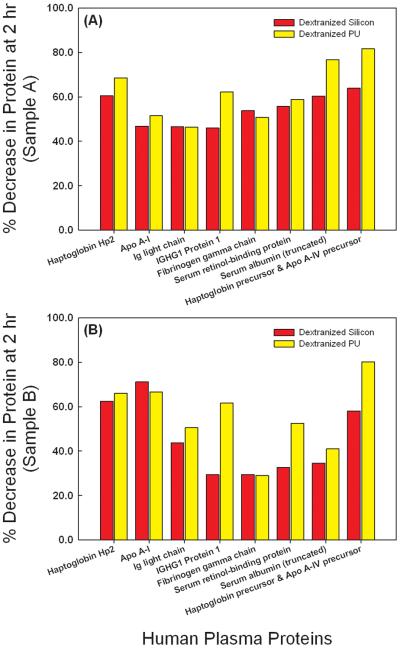
For the eight proteins identified and analyzed, the dextranized surfaces provide resistance to their individual adsorption in the range of 28-80% compared to the relevant native surfaces for both one hour and two hours incubation, as shown in Figures 7 and 8 and consistent for both Sample A and Sample B. The lone exception was resistance to Apo A-I, which was found to be small at 1 hour especially on dextranized PU (Figure 7) for both Sample A and Sample B, but comparable to resistance of the other proteins listed at 2 hours (Figure 8A and 8B). The protein adsorption onto the dextranized surfaces was reduced by an average of 53.8% at one-hour of plasma incubation, which was not different from the average result of 54.3% at two hours. However, the resistance is substantially variable based on individual protein type and surface type.
Figure 7.
Percent decrease for plasma proteins eluted from dextranized silicon and dextranized PU surfaces at one hour for samples A and B.
Figure 8.
Percent decrease for plasma proteins eluted from dextranized silicon and dextranized PU surfaces at two hours for samples A and B.
The large reductions in protein adsorption observed with the coated materials is in agreement with Ombelli et al.'s results [9] using single protein or a mixture of two proteins. This suggests that protein adsorption experiments of single or binary components are reliable data to predict phenomena in multi-component systems. The literature suggests that the kinetics of protein adsorption is such that the amount of protein adsorbed saturates the surface after one hour of incubation with little changes occurring beyond one hour. We have studied protein adsorption at the same and later time points and found that the kinetics vary for individual proteins, but overall the major effect of dextranization is to suppress protein adsorption for the limited two hour time window examined. This is a promising result, especially for short duration exposures that do occur in common medical applications of blood contact with surfaces such as take place with extracorporeal circulation in cardiopulmonary bypass and hemodialysis [61;62]. Nonetheless, it is possible that protein adsorption onto the dextranized surfaces is simply delayed or that with longer term exposures degradation of the coating could result in loss of protein resistance. However, we have yet to observe degradation of the grafted dextran based on the initial attachment chemistry we employ in our experiments. Studies conducted for longer times may show results different from those reported here.
Surface properties and protein adsorption
Based on the two-dimensional gel electrophoresis results, there does not appear to be any preferential resistance to protein adsorption onto the surfaces studied in terms of the isoelectric points or the molecular weights of the proteins. Indeed, the resistance appears to be invariant with regard to protein structure, given that the proteins identified represent a full range of isoelectric points, molecular weights and a variety of protein structures. Moreover, both the rough dextranized PU surfaces and the relatively smooth dextranized silicon surfaces inhibit several different families of plasma protein. This may be more a result of the relatively constant hydrophilicity of the two types of dextranized surfaces having been shown to have comparable wettability, and less a feature of the significant nanostructure variability determined to exist between the dextranized PU and dextranized silicon surfaces. Independent of the substrate (i.e., silicon vs. PU), the average reduction of the adsorption of the various proteins quantified was in the range of ~ 50% and, with the exception of Apo A-I on dextranized PU, was not overtly dependent on exposure duration, as shown in Figures 7 and 8.
In previous two dimensional gel electrophoresis studies of plasma protein adsorption to surfaces, exposure times to the plasma have commonly been on the order of 5 minutes [36;37;39-41], though studies with controlled exposure times of 20 minutes [34] or as long as four hours [38] have been conducted. Historically this body of work has brought focus to the study of protein adsorption onto the surface of very small particles (nanoparticles, microparticles) having potential use as drug carriers for injection into the bloodstream. Their surface coating with proteins is important to their uptake and distribution through the circulation into various organs. In certain instances, via dilution the effects of plasma concentration (e.g., 1.2 - 75%) has been investigated [38]. Major findings of these studies point toward the association of higher surface charge density with increased protein deposition on the particle surface and the direct correlation between surface hydrophobicity and protein adsorbed. In a recent clinically-based proteomic analysis of human blood serum proteins adsorbed to a polysulfone hemodialyser used in treatment of kidney failure, the total number of two dimensional gel electrophoresis spots identified was similar to the total report in the present study [62]. The authors described a similar number of unique proteins to that defined above as well, and noted preferential adsorption to have occurred for ten select proteins. Of these, only apolipoprotein A1 clearly overlapped with those proteins adsorbed to our dextranized surfaces.
We recognize a limitation of our study to be that the proteins may not have completely eluted off the PU and the dextranized surfaces. Our main conclusion of the paper is that dextranized surfaces are indeed resistant to human plasma protein adsorption. There exist, then, two competing possibilities for why we measure less protein: because either there were proteins which remained on the surfaces, or because less protein adsorbed onto the surfaces. We offer three observations that strongly support the latter, that is, the dextranized surfaces are indeed resistant to human plasma protein adsorptions. First, we previously demonstrated that dextranized surfaces resist protein adsorption relative to the native, dextran free surfaces using chromatography [10]. Second, our current experiments, using patterned surfaces of dextranized and glass, show that serum albumin and fibrinogen preferentially adsorb onto the nondextranized region [63]. And finally, the XPS data indicate that protein elution from the SiO2 surface is complete, and thorough for other surfaces as well. This gives us considerable confidence that the dextranized surfaces resist adsorption of multiple plasma proteins.
It is worthwhile to note that a greater number of plasma proteins absorbed onto silicon than onto PU at one hour. However, an opposite trend is observed at two hours. The surface of a silicon wafer is known to be atomically smooth, and thus, dextranized silicon retains a relatively smooth surface topography as compared to the surfaces of PU or dextranized PU. This is shown in the quantitative analysis of the AFM images, Figure 2. The dextranized silicon has grain height of 2.1 nm compared to 23.6 nm for PU surfaces. In addition to the roughness, the silicon surface is hydrophilic, while the PU surface is hydrophobic. It is difficult to interpret the observed trend in protein adsorption and surface resistance due to the combination of the differences in surface topography and chemistry. Nevertheless, the chemistry of the dextranization plays a more definitive role in preventing protein adsorption onto the surfaces. Given the differences in hydrophobicity, surface charge density, surface roughness and surface features among the various studies already present in the literature, including our own, it is evident that the landscape of protein adsorption to biomaterials depends on molecular features and surface-molecule interactions that occur at length scales which are not well defined by macroscopic properties such as wettability.
A similar situation is observed for dextranized silicon and dextranized PU. The surfaces of dextranized silicon appear to resist plasma protein adsorption better than do dextranized PU surfaces at one hour (Figure 7), and again, the reverse relationship is seen at two hours as shown in Figure 8. In this case, surface roughness may play an important role in the kinetics of protein adsorption. Overall, we show differences in protein adsorption over a range of times for the four model surfaces in our study. Part of our hypothesis is borne out, namely that our dextranized surfaces do, in fact, resist adsorption of multiple plasma proteins in the native human plasma concentration. However, the molecular basis for distinguishing how specific adsorption profiles relate to structural features of the grafted dextran layers on the different substrates remains to be defined. Nonetheless, our findings further expand previous work in providing an opportunity for development of potential biomaterials applications in which surface-directed protein selectivity is important. For example, at both one and two hours of protein adsorption, IGHG1 and Ig light chain absorbed the most onto the uncoated silicon and PU surfaces (Figures 5A,B and 6A,B). This might have utility in future diagnostic applications for protein-related diseases or for therapeutic interventions such as plasmapheresis procedures. Future advances will depend on whether or not clear examples of molecular specificity for adsorption of select bioactive proteins on a particular surface are identifiable.
Conclusions
When a biomaterial is implanted in a human body, protein adsorption determines the subsequently events such as blood coagulation, cell adhesion and migration. By assessing the types of proteins and the kinetics of plasma proteins adsorbed onto a surface, an improved biocompatible material can be designed and developed. We successfully show that the surfaces of silicon and polyurethane can be modified to incorporate a major molecular constituent of the endothelial glycocalyx. Using two-dimensional gel electrophoresis coupled with gel analysis software and mass spectrometry, the glycocalyx-like surfaces prove to be effective in resisting adsorption of many plasma proteins. This proteomic technique is a powerful tool for evaluation of multiple proteins simultaneously using undiluted human plasma derived from blood samples. One can potentially modify the surfaces to include other components of endothelial glycocalyx and use proteomics methods to determine which species of the multitude of plasma proteins yield specific biological interactions and functions.
Acknowledgments
This work was supported by NIH grants R01-HL060230 and T32-GM007612. We thank our blood donors. RJC acknowledges partial support from NSF/NSEC (DMR08-32802 for facility use) and NSF/Polymer Program (DMR09-07493). We thank Thomas P. Russell and Jack Hirsch (Materials Research Science and Engineering Center at University of Massachusetts) for XPS measurements; and Chao-Xing Yuan of The Proteomics Facility at University of Pennsylvania for useful discussion on mass spectrometry.
References
- 1.Vogler EA, Siedlecki CA. Biomaterials. 2009;30:1857. doi: 10.1016/j.biomaterials.2008.12.041. [DOI] [PMC free article] [PubMed] [Google Scholar]
- 2.Colman RW, et al. Ann NY Acad Sci. 1987;516:253. doi: 10.1111/j.1749-6632.1987.tb33046.x. [DOI] [PubMed] [Google Scholar]
- 3.Gray JJ. Curr Opin Struct Biol. 2004;14:110. doi: 10.1016/j.sbi.2003.12.001. [DOI] [PubMed] [Google Scholar]
- 4.Vroman L. Science. 1974;184:585. doi: 10.1126/science.184.4136.585. [DOI] [PubMed] [Google Scholar]
- 5.Monchaux E, Vermette P. J Biomed Mater Res. 2008;85A:1052. doi: 10.1002/jbm.a.31580. [DOI] [PubMed] [Google Scholar]
- 6.Reitsma S, et al. Pflugers Arch. 2007;454:345. doi: 10.1007/s00424-007-0212-8. [DOI] [PMC free article] [PubMed] [Google Scholar]
- 7.Van Teeffelen JW, et al. Trends Cardiovasc Med. 2007;17:101. doi: 10.1016/j.tcm.2007.02.002. [DOI] [PubMed] [Google Scholar]
- 8.Holland NB, et al. Nature. 1998;392:799. doi: 10.1038/33894. [DOI] [PubMed] [Google Scholar]
- 9.Ombelli M, et al. J Chromatogr B Analyt Technol Biomed Life Sci. 2005;826:198. doi: 10.1016/j.jchromb.2005.09.002. [DOI] [PubMed] [Google Scholar]
- 10.Gupta AS, et al. Biomaterials. 2006;27:3084. doi: 10.1016/j.biomaterials.2006.01.002. [DOI] [PubMed] [Google Scholar]
- 11.Kopp R, et al. ASAIO J. 2002;48:598. doi: 10.1097/00002480-200211000-00005. [DOI] [PubMed] [Google Scholar]
- 12.Yang JM, et al. J Membr Sci. 1998;138:19. [Google Scholar]
- 13.Stile RA, et al. J Biomed Mater Res. 2002;61:391. doi: 10.1002/jbm.10154. [DOI] [PubMed] [Google Scholar]
- 14.Herrmann K, et al. J Mater Sci Mater Med. 1994;5:728. [Google Scholar]
- 15.Du YJ, et al. J Biomed Mater Res. 2007;80A:216. doi: 10.1002/jbm.a.30977. [DOI] [PubMed] [Google Scholar]
- 16.Dai LM, et al. Surf Interface Anal. 2000;29:46. [Google Scholar]
- 17.Bech L, et al. J Polym Sci A. 2007;45:2172. [Google Scholar]
- 18.Fadeev AY, McCarthy TJ. Langmuir. 1998;14:5586. [Google Scholar]
- 19.McLean KM, et al. Colloids Surf B Biointerfaces. 2000;18:221. doi: 10.1016/s0927-7765(99)00149-6. [DOI] [PubMed] [Google Scholar]
- 20.Farrell M, Beaudoin S. Colloids Surf B Biointerfaces. 2010;81:468. doi: 10.1016/j.colsurfb.2010.07.059. [DOI] [PMC free article] [PubMed] [Google Scholar]
- 21.Fang F, Szleifer I. Biophys J. 2001;80:2568. doi: 10.1016/S0006-3495(01)76228-5. [DOI] [PMC free article] [PubMed] [Google Scholar]
- 22.Kaufmann E, et al. J Biomed Mater Res. 2000;52:825. doi: 10.1002/1097-4636(20001215)52:4<825::aid-jbm28>3.0.co;2-m. [DOI] [PubMed] [Google Scholar]
- 23.McArthur SL, et al. Colloids Surf B Biointerfaces. 2000;17:37. [Google Scholar]
- 24.Li L, et al. J Phys Chem B. 2006;110:16763. doi: 10.1021/jp062442o. [DOI] [PubMed] [Google Scholar]
- 25.Ball V, et al. Langmuir. 1996;12:1614. [Google Scholar]
- 26.Cornelius RM, et al. Biomaterials. 2002;23:3583. doi: 10.1016/s0142-9612(02)00083-2. [DOI] [PubMed] [Google Scholar]
- 27.Takami Y, et al. J Biomed Mater Res. 1998;40:24. doi: 10.1002/(sici)1097-4636(199804)40:1<24::aid-jbm3>3.0.co;2-t. [DOI] [PubMed] [Google Scholar]
- 28.Dubois J, et al. Colloids Surf B Biointerfaces. 2009;71:293. doi: 10.1016/j.colsurfb.2009.03.002. [DOI] [PubMed] [Google Scholar]
- 29.Klomp AJA, et al. Biomaterials. 1999;20:1203. doi: 10.1016/s0142-9612(99)00009-5. [DOI] [PubMed] [Google Scholar]
- 30.Cornelius RM, et al. J Biomed Mater Res. 2002;60:622. doi: 10.1002/jbm.10117. [DOI] [PubMed] [Google Scholar]
- 31.Allemann E, et al. J Biomed Mater Res. 1997;37:229. doi: 10.1002/(sici)1097-4636(199711)37:2<229::aid-jbm12>3.0.co;2-9. [DOI] [PubMed] [Google Scholar]
- 32.Derhami K, et al. J Biomed Mater Res. 2001;56:234. doi: 10.1002/1097-4636(200108)56:2<234::aid-jbm1090>3.0.co;2-#. [DOI] [PubMed] [Google Scholar]
- 33.Rosengren A, et al. Biomaterials. 2002;23:1237. doi: 10.1016/s0142-9612(01)00244-7. [DOI] [PubMed] [Google Scholar]
- 34.Kim HR, et al. Electrophoresis. 2007;28:2252. doi: 10.1002/elps.200600694. [DOI] [PubMed] [Google Scholar]
- 35.Magnani A, et al. Electrophoresis. 2004;25:2413. doi: 10.1002/elps.200305826. [DOI] [PubMed] [Google Scholar]
- 36.Blunk T, et al. Electrophoresis. 1993;14:1382. doi: 10.1002/elps.11501401214. [DOI] [PubMed] [Google Scholar]
- 37.Gessner A, et al. Eur J Pharm Biopharm. 2002;54:165. doi: 10.1016/s0939-6411(02)00081-4. [DOI] [PubMed] [Google Scholar]
- 38.Goppert TM, Muller RH. Int J Pharm. 2005;302:172. doi: 10.1016/j.ijpharm.2005.06.025. [DOI] [PubMed] [Google Scholar]
- 39.Goppert TM, Muller RH. Eur J Pharm Biopharm. 2005;60:361. doi: 10.1016/j.ejpb.2005.02.006. [DOI] [PubMed] [Google Scholar]
- 40.Goppert TM, Muller RH. J Drug Target. 2005;13:179. doi: 10.1080/10611860500071292. [DOI] [PubMed] [Google Scholar]
- 41.Carrillo-Conde B, et al. J Biomed Mater Res. 2010;95A:40. doi: 10.1002/jbm.a.32815. [DOI] [PubMed] [Google Scholar]
- 42.McNamara LE, et al. J R Soc Interface. 2010;7:S107. doi: 10.1098/rsif.2009.0177.focus. [DOI] [PMC free article] [PubMed] [Google Scholar]
- 43.Gallagher WM, et al. Biomaterials. 2006;27:5871. doi: 10.1016/j.biomaterials.2006.07.040. [DOI] [PubMed] [Google Scholar]
- 44.Rosengren A, et al. Biomaterials. 2003;24:147. doi: 10.1016/s0142-9612(02)00272-7. [DOI] [PubMed] [Google Scholar]
- 45.Feng L, Andrade JD. Colloids Surf B Biointerfaces. 1996;6:149. [Google Scholar]
- 46.Miksa D, et al. Biomacromolecules. 2006;7:557. doi: 10.1021/bm050601o. [DOI] [PubMed] [Google Scholar]
- 47.Martwiset S, et al. Langmuir. 2006;22:8192. doi: 10.1021/la061064b. [DOI] [PMC free article] [PubMed] [Google Scholar]
- 48.Baskin JL, et al. Lancet. 2009;374:159. doi: 10.1016/S0140-6736(09)60220-8. [DOI] [PMC free article] [PubMed] [Google Scholar]
- 49.Strader MB, et al. Anal Chem. 2006;78:125. doi: 10.1021/ac051348l. [DOI] [PubMed] [Google Scholar]
- 50.Zhu YB, et al. Biomaterials. 2004;25:423. [Google Scholar]
- 51.Garrett JT, et al. Macromolecules. 2001;34:7066. [Google Scholar]
- 52.McLean RS, Sauer BB. Macromolecules. 1997;30:8314. [Google Scholar]
- 53.Gibson DS, et al. J Prot. 2009;72:656. doi: 10.1016/j.jprot.2009.01.022. [DOI] [PMC free article] [PubMed] [Google Scholar]
- 54.Sihlbom C, et al. Journal of Proteome Research. 2008;7:4191. doi: 10.1021/pr800340c. [DOI] [PubMed] [Google Scholar]
- 55.Howarter JA, Youngblood JP. Langmuir. 2006;22:11142. doi: 10.1021/la061240g. [DOI] [PubMed] [Google Scholar]
- 56.Yuan CX, et al. Proc Natl Acad Sci U S A. 1998;95:7939. doi: 10.1073/pnas.95.14.7939. [DOI] [PMC free article] [PubMed] [Google Scholar]
- 57.Seferovic MD, et al. J Chromatogr B Analyt Technol Biomed Life Sci. 2008;865:147. doi: 10.1016/j.jchromb.2008.01.052. [DOI] [PubMed] [Google Scholar]
- 58.Bjorhall K, et al. Proteomics. 2005;5:307. doi: 10.1002/pmic.200400900. [DOI] [PubMed] [Google Scholar]
- 59.Ho CH, et al. J Biomed Mater Res. 1991;25:423. doi: 10.1002/jbm.820250402. [DOI] [PubMed] [Google Scholar]
- 60.Wadsworth GR, Oliveiro CJ. BMJ. 1953;2:1138. doi: 10.1136/bmj.2.4846.1138. [DOI] [PMC free article] [PubMed] [Google Scholar]
- 61.Bonomini M, et al. J Proteome Res. 2006;5:2666. doi: 10.1021/pr060150u. [DOI] [PubMed] [Google Scholar]
- 62.Mares J, et al. Kidney Int. 2009;76:404. doi: 10.1038/ki.2009.138. [DOI] [PubMed] [Google Scholar]
- 63.Ferrer MCC, et al. Langmuir. 2010;26:14126. doi: 10.1021/la102315j. [DOI] [PMC free article] [PubMed] [Google Scholar]


