

Abstract
Background
Current work in motivational interviewing (MI) has supported the role of in-session client and therapist language in predicting post-intervention substance use outcomes. In particular, a relationship has been found between specific therapist language (e.g., MI-consistent behaviors), specific types of client speech (e.g., change talk; CT and counter-change talk; CCT), and subsequent drinking outcomes. One hypothesis to explain this phenomenon is that CT is an indication of a neurocognitive shift that happens during the course of the psychosocial intervention. And, it is possible that this shift is responsible for catalyzing and maintaining changes in drinking behaviors following MI interventions. To investigate this question, the effect of CT on blood oxygen level dependent (BOLD) response during the presentation of alcohol cues using fMRI was evaluated.
Methods
To examine changes in neural response to alcohol cues following client language, 10 adults with alcohol dependence (50% male; 40% Caucasian; 40% Hispanic; M age = 42.6; M years of education = 13.3) were presented with CT and CCT derived from their pre-scan MI session during the presentation of alcohol cues.
Results
Following CCT, there was significant neural response to alcohol cues in several key reward areas (cluster-corrected p<.05, z > 2.3; orbitofrontal cortex, nucleus accumbens, anterior insula, posterior insula, caudate, putamen). On the contrary, there were no areas of significant activation during exposure to alcohol cues following CT.
Conclusions
These results indicate that CT may be effectively inhibiting activation in brain regions that respond to the salience of alcohol cues. These findings provide preliminary biological support of the psychosocial literature findings, highlighting the critical importance of change talk during psychosocial interventions.
Keywords: alcohol dependence, neuroimaging, motivational interviewing, fMRI, client statements
Introduction
In the United States, approximately 17% of men and 8% of women engage in drinking that is problematic enough to meet criteria for alcohol dependence at some point during their lives (Hasin et al., 2007). Problem drinking results in significant morbidity and mortality (79,000 deaths/year; CDC, 2008), and is the third leading lifestyle-related cause of death in the nation (Mokdad et al., 2004). Despite the prevalence and profound consequences of alcohol addiction, empirically-supported psychosocial alcohol interventions have widely varying outcomes (Anton et al., 2006; ProjectMatchResearchGroup, 1998; Team, 2005); this range indicates the need to gain a better understanding of key active ingredients and how they may operate.
An understanding of the mechanisms that drive the efficacy of psychotherapy is emerging. One promising avenue has involved deconstructing in-session client and therapist statements. Amhrein, Miller, and colleagues have pioneered this work, demonstrating that client statements uttered within motivational interviewing (MI)-based interventions (e.g., commitment language, “I will not use again”) positively predicted percent days abstinent at 12 months (Amrhein et al., 2003). Building upon this work, Moyers and colleagues (Moyers et al., 2009; 2006; 2007) found evidence for a more sophisticated relationship between therapist behaviors (e.g., MI-consistent behaviors, such as emphasis on patient autonomy), subsequent client speech (e.g., Change Talk, CT; “I think that I need to cut back on my drinking”) and long-term drinking outcomes (e.g., drinks per drinking day/drinks per drinking week). Ultimately, they found that both Change Talk (CT), operationalized as client speech in favor of behavioral change (e.g., “I need to stop drinking like this – it is ruining my life”) and CounterChange Talk (CCT), operationalized as client language supporting the status quo (e.g., “Drinking is not a problem for me”) significantly predicted drinking outcomes up to 15 months post-MI intervention (CT negatively associated with drinking, and CCT positively associated with drinking; Moyers et al., 2009; Moyers et al., 2007). One hypothesis to explain this phenomenon is that CT is an indication of a neurocognitive shift that happens during the course of the psychosocial intervention. However, this neurocognitive shift had not yet been tested in an experimental context.
At present, the current alcohol intervention literature lacks the translational studies that could help elucidate the neurobiological mechanisms that may mediate the link between psychosocial active ingredients, such as Change Talk (CT), and behavior (such as craving). Functional neuroimaging offers a unique opportunity to identify and test putative neurobiological mediators and moderators (Hutchison, 2010). One set of neurobiological mediators that seems particularly promising are those involved in the attribution of incentive salience to cues. This network has been strongly implicated for its role in addiction, due to its intimate involvement in incentive salience and subsequent perception of reward (e.g., Kalivas and Volkow, 2005; Robinson and Berridge, 2001). Key areas in this system include, but are not limited to, the orbitofrontal cortex (OFC), nucleus accumbens, insula, caudate, and putamen.
Through examining potentially critical neurobiological mechanisms, it may be possible to better understand how psychosocial interventions like motivational interviewing work (MI; Miller and Rollnick, 2002), which may ideally subsequently contribute to the improvement of intervention efficacy. To take a first step in this direction, we employed an fMRI paradigm to examine neural structures activated after exposure to alcohol cues (e.g., Filbey et al., 2008a) following client statements in order to directly test the extent to which CT reduces cue-elicited activation of these neural substrates. Based upon prior research in this area (e.g., Filbey et al., 2008a; Hutchison, 2010), we posited that CT would operate by reducing the ability of alcohol cues to access mesocorticolimbic structures and initiate craving. Thus, we hypothesized that CT would be associated with activation in cortical regions associated with reward (e.g., OFC, nucleus accumbens, insula, caudate, and putamen).
Materials and Methods
Participants
This study was a component of a larger translational study (PI: last author) investigating the relationship between biological risk factors and response to a psychosocial and pharmacological intervention for alcohol dependence. With institutional review board approval, 13 treatment-seeking volunteers in the southwest were recruited through local advertisements (newspaper and radio) to participate in a study for those interested in quitting drinking. All participants provided informed written consent. To participate, interested adults had to be between the ages of 21 and 55 years, have a primary diagnosis of alcohol dependence, be within 21 days of their last drink, have been drinking >14 drinks per week (female) or >21 drinks per week (male) during 4 consecutive weeks within three months of beginning the study, have a CIWA score less than 8 (indicating no need for medical detox), and have a breath alcohol level of 0 at each session. Exclusion criteria included taking antipsychotics or anti-convulsants, being pregnant as indicated by a pregnancy test, meeting criteria for psychotic disorder, bipolar disorder, or major depression with suicidal ideation, and having a history of injury to the brain or brain related medical problems.
Of the 13 participants, 3 were excluded due to technical problems with the imaging data (e.g., n=3 incomplete scan), leaving a total sample size of 10. Participants included 5 females and 5 males, with an average age of 42.6 (SD = 5.93; see Table 1). This sample self-identified as Caucasian (40%; n = 4), Hispanic (40%; n = 4), African-American (10%, n = 1), and multiracial (10%, n = 1). In terms of employment, 30% of the sample reported being employed full time, 30% half time, and 40% were unemployed. Most of the sample had a modest income; 60% earned less than $20,000/year (<$19,999 = 60%, $20,000-$59,999 = 40%). Additional demographic characteristics are presented in Table 1.
Table 1.
Demographic Characteristics of Participating Sample (N = 10).
| Mean (SD) | Range | |
|---|---|---|
| Gender | Male = 5 (50%) | |
| Female = 5 (50%) | ||
| Self-Reported Race/Ethnicity | Caucasian = 4 (40%) | |
| Hispanic = 4 (40%) | ||
| African-American = 1 (10%) | ||
| Multi-racial = 1 (10%) | ||
| Employment status | Unemployed = 4 (40%) | |
| Part-time = 3 (30%) | ||
| Full-time = 3 (30%) | ||
| Current Income | 0-9,999 = 4 (40%) | |
| 10-19,000 = 2 (20%) | ||
| 20-29,000 = 1 (10%) | ||
| 30-39,000 = 1 (10%) | ||
| 40-49,000 = 1 (10%) | ||
| 50-59,000 = 1 (10%) | ||
| Age | 42.6 (5.93) | 35.00-52.00 |
| Years of Education | 13.3 (2.00) | 10.00-16.00 |
| Alcohol Dependence Symptoms (ADS) | 16.8 (8.89) | 6.00-32.00 |
| Hazardous Drinking Symptoms (AUDIT) | 23.5 (6.21) | 11.00-31.00 |
| Average Drinks per Drinking Day | 9.50 (5.04) | 2.00-21.00 |
Measures
Participants completed several questionnaires, including a demographic questionnaire, a clinical assessment of alcohol dependence (Structured Clinical Interview for DSM-IV; SCID; First et al., 1997), an evaluation of the quantity and frequency of drinking (Alcohol History Questionnaire as employed in Filbey et al., 2008a; example items included, “In the past month, what is the average number of drinks you've had each time you've drank?”), an evaluation of hazardous drinking (Alcohol Use Disorders Identification Test; AUDIT; Babor, 2006), an evaluation of alcohol dependence symptoms (Alcohol Dependence Scale; ADS; Skinner and Horn, 1984), and an fMRI-based (in scanner) evaluation of subjective urge for drinking (the Alcohol Urge Questionnaire; AUQ; Bohn et al., 1995).
Procedures
Assessment Procedures
At baseline, all participants completed a baseline packet that included demographics, drinking, and craving measures. Immediately upon completion of the baseline measures, all participants completed their intervention session.
Intervention Session
Following a manualized motivational interviewing (MI) approach created by Feldstein Ewing and Moyers (2008), the intervention condition was delivered by a PhD level therapist (first author; e.g., Feldstein Ewing et al., 2009), The MI condition included a single one-hour session, which consisted of an open-ended exploration of participants' drinking behaviors, a values clarification task (Miller et al., 2001), and an overview of the session and evaluation of the participant's post-session drinking goals (e.g., the “what next” exercise). The therapist relied on MI-consistent approaches (see Moyers et al., 2007), including reliance on reflections, open-ended questions, affirmations, and summary statements, with the goal of decreasing resistance, demonstrating accurate empathy, developing discrepancy between ideal and current alcohol use, and supporting self-efficacy (Miller and Rollnick, 2002). In addition, the therapist employed reflections and empathic, open-ended questioning to develop participants' ambivalence regarding current drinking, and to elicit statements for change.
Notably, this session also included the MI-based “talking into and out of change exercise” (Feldstein Ewing and Moyers, 2008) from which CT and CCT statements were pulled for the fMRI session. Consistent with prior studies (e.g., Moyers and Martin, 2006), a minimum of 5 CT and CCT statements were consistently generated in this exercise during every MI session within this study. All sessions were audio-recorded with participant approval to gather the requisite statements for the neuroimaging paradigm.
Scan Session
Within one week of their MI session, all participants were scheduled for an fMRI scan session. Before scanning, participants abstained from alcohol for 24 hours, from caffeine and cigarettes for the preceding 2 hours, and had a confirmed breath alcohol level of .000 at the start of their session. Participants were compensated $60 for their participation.
Cue Exposure with Client Statements
Once comfortable with the fMRI procedures, participants were inserted into the bore of the magnet for a high-resolution structural scan collected for image registration and normalization. All participants underwent a high-resolution anatomical scan (see Imaging Parameters), a volume set-up to establish ideal audio settings above the scanner noise, and an fMRI scan. The fMRI task was designed to assess the effects of salient client statements on cue-elicited craving for alcohol. CT and CCT statements were taken from each participant's MI session (e.g., CT statements regarding their motivation to change; “I need to stop drinking like this”) and CCT statements regarding their reasons for drinking; “Drinking is not a problem for me.”) Specifically, through the counterbalanced “Talking into and out of change exercise” within the MI session where participants were prompted to provide five reasons for changing and five reasons for staying the same (see Feldstein Ewing and Moyers, 2008), five different 14-second CT statements and five different 14-second CCT statements were taken from each participant's MI session. Thus, in the scanner, participants were simultaneously presented with their own CT and CCT statements by sight (seeing the written words of their statements) and sound (hearing their own audio-recorded voice from their session) followed by alcohol cues from a cue-exposure task as developed in previous fMRI-based cue-exposure studies (e.g., Filbey et al., 2008a; Hutchison et al., 2008).
To assess the effects of CT and CCT statements on cue-elicited craving, participants were pseudorandomly presented with a single run of each of the 4 statement/cue combinations. Each of the 4 runs consisted of 10 × 60 second trials (TR 2s/volume; 1 run=10 trials×60 seconds/30 TRs per trial=300 TRs/5 minutes). These included (1) CT/alcohol, (2) CCT/alcohol, (3) CT/control, and (4) CCT/control. Each statement was presented to the participants two times yielding 10 CT and 10 CCT statements per participant for the entire experiment. For a single run, each trial started with a 16 second audio clip (recorded from participant's MI session) simultaneously presented with a visual presentation (seeing the written words) of a CT or CCT statement, followed by the cue-exposure period (see Figure 1). The cue exposure period followed methods described in Filbey et al. (2008a). Specifically, a continuous taste delivery of a total of 1 ml of liquid (i.e., participant's favorite alcoholic beverage or an isocaloric control beverage, specifically, litchi juice) was delivered for 24 seconds through small teflon tubing using a computer-controlled gustometer. The exposure period was followed by a 16-second washout period. Then, participants were asked to rate their subjective urge to drink alcohol on a scale from 1 (no urge at all) to 4 (very high urge) using a fiber optic 4-button box. It should be noted that several studies have used similar administration procedures to examine the brain regions associated with the rewarding value of juice (e.g., Pagnoni et al., 2002). Consistent with previous studies (e.g., Filbey et al., 2008a; Hutchison et al., 2008), the administration of this small amount of liquid (∼ ¼ teaspoon) did not present difficulties for the subject. The inclusion of both taste stimuli enabled the comparison of brain activation during an alcohol cue versus activation during exposure to a control cue. It also enabled examination of the effect of CT and CCT statements on cue-elicited activation of the reward areas.
Figure 1.

Schematic of a single trial of the fMRI paradigm. In each of the 4 runs, participants were presented with either CT or CCT (1 type of talk during each run) with either exposure to alcohol or an isocaloric control
-
*Runs were counterbalanced in order of presentation (e.g., CT/alcohol, CT/litchi, CCT/alcohol, CCT/litchi).
-
*TR 2s/volume
-
*1 run = 10 trials × 60 seconds / 30 TRs per trial = 300 TRs/5 min
-
*CT and CCT presented via audio (replay of their voice) and visual (written text of their statements)
Imaging Parameters
fMRI images were collected using a 3T Siemens Trio whole body scanner equipped with Sonata gradient subsystem (40 mT/m amplitude, 200 μs rise time, 100% duty cycle). A 12-channel receive head phased array coil combined with body coil transmission to achieve greater sensitivity in cortical areas was employed. fMRI scans were collected using a gradient echo, echoplanar sequence with ramp sampling correction using the intercomissural line (AC-PC) as a reference (TR: 2.0 s, TE: 27ms (39ms for 1.5T), α: 70°, matrix size: 64×64, 32 slices, voxel size: 3×3×4 mm3). Because the orbitofrontal cortex (OFC) is involved in the craving/reward system and can suffer from severe signal drop-out caused by susceptibility effects, a tilting acquisition was applied. The high resolution anatomical MRI scan was collected with a T1-weighted multi-echo Magnetization Prepared Rapid Gradient Echo or MPRAGE (MEMPR) sequence with the following parameters: TR/TE/TI = 2300/2.74/900 ms, flip angle = 8°, FOV = 256×256 mm, Slab thickness = 176 mm, Matrix = 256×256×176, Voxel size =1×1×1 mm, Number of echos = 4, Pixel bandwidth = 650 Hz. Total scan time = 56 min. With 4 echoes, the TR, TI and time to encode partitions for the MEMPR are similar to that of a conventional MPRAGE, resulting in similar GM/WM/CSF contrast. The fMRI task was presented using a rear projection to a mirror system the subject views while in the head coil. Responses were recorded using a fiber-optic pad that has four response buttons. Stimulus presentation was delivered using E-Prime.
fMRI Data Preprocessing
Before statistical analysis, the first seven volumes of each EPI run were discarded to allow the MR signal to reach steady state. The remaining volumes in each participant's time series were motion corrected using FSL's (FMRIB's Software Library, www.fmrib.ox.ac.uk/fsl) McFLIRT Version 5.0 [Motion Correction using FMRIB's Linear Image Registration Tool (Jenkinson et al., 2002)].
fMRI Data Analyses
fMRI data analyses employed FEAT (FMRI Expert Analysis Tool) Version 5.63, part of FSL using the following pre-statistics processing: non-brain tissue/skull removal using BET (Brain Extraction Tool; Smith, 2002); spatial smoothing using a Gaussian kernel of FWHM 8 mm; mean-based intensity normalization of all volumes by the same factor; highpass temporal filtering (Gaussian-weighted least-squares straight line fitting, with sigma = 50.0 s). Time-series statistical analysis employed FILM (FMRIB's Improved Linear Model) with local autocorrelation correction (Woolrich et al., 2001). The analyses modeled the activation of the mesocorticolimbic structures after the initial swallow prompt until the end of the washout period (see Filbey et al., 2008a). Explanatory variables (e.g., exposure periods for alcohol or control cues during CT or CCT condition,) were created by convolving the stimulus timing files with a double gamma hemodynamic response function in FEAT. A multiple linear regression analysis was performed to estimate the hemodynamic parameters for the different explanatory variables and a corresponding t-statistic indicates the significance of the activation of the stimulus. To determine the difference in response to alcohol cues following CT and CCT, BOLD response to alcohol cues was then contrasted between CT and CCT conditions. Statistical maps were then registered to the Montreal Neurological Institute (MNI) template using FLIRT (FMRIB's Linear Image Registration Tool; Jenkinson et al., 2002; Jenkinson and Smith, 2001).
Group-level analyses were carried out using a mixed effects analysis with FLAME (Beckmann et al., 2003; Woolrich, 2004). To control for multiple comparisons, a cluster-threshold of p < .05, z = 2.3 was employed. Specifically, a Z statistic threshold was first used to define contiguous clusters (e.g., z > 2.3). Then, each cluster's estimated significance level (from GRF-theory) was compared with the cluster probability threshold (e.g., p < 0.05; see Smith, 2004). Notably, a height threshold of z = 2.3 (or one-tailed p < 0.01) was applied simply to determine contiguous clusters (e.g., clusters also had to be compared with the cluster probability threshold). For visualization and display of significant activation, the z-maps were overlaid on the T1 canonical MNI template using MRIcro visualization software (Rorden and Brett, 2000).
Results
Alcohol Use
Based upon the SCID, all of the adults in this sample met criteria for alcohol dependence. In addition, this sample evidenced heavy drinking as demonstrated by their scores on the alcohol dependence scale (ADS; M = 16.8, SD = 8.89; note: total score ≥ 9 is predictive of alcohol dependence), the alcohol use disorders identification test (AUDIT; M = 23.5, SD = 6.21; note: total score > 8 is indicative of harmful or hazardous alcohol use), and their average quantity of use per drinking occasion (see Table 1). Specifically, in the past month, this sample drank an average of 9.50 (SD = 5.04) drinks per drinking day.
In-Session Client Statements and Alcohol Cue Responsivity
Main Effects of Change Talk (CT) and CounterChange (CCT) on response to alcohol cues
Change Talk (CT)
There was minimal activation during the CT condition, highlighting the participants' response to alcohol cues after seeing and hearing their statements in support of changing their drinking behavior (e.g., “It is time to stop drinking.”). Specifically, no significant activation emerged in the reward networks. However, significant activation emerged in the postcentral gyrus, precentral gyrus, and superior temporal gyrus (cluster corrected p < .05, z = 2.3, 1 cluster, total number of voxels = 1,321; see Table 2 and Figure 2a).
Table 2.
Maximum loci of activation for BOLD response to cues following [A] Change Talk (CT) [B], CounterChange Talk (CCT) [C], the difference between CT and CCT (cluster-corrected p<.05, z=2.3), and [D] subjective cravings for alcohol following CT and CCT. Each cluster is listed below with the corresponding peak voxels of activation. (R=right, L=left, BA= Brodmann's area).
| Localization | BA | x | y | z | Max Z | |
|---|---|---|---|---|---|---|
| A. Main Effect of Change Talk (CT) During Alcohol Exposure (1,321 voxels) | ||||||
| R. Precentral Gyrus | 6 | 64 | 4 | 12 | 5.23 | |
| R. Postcentral Gyrus | 43 | 66 | -4 | 14 | 5.2 | |
| R. Superior Temporal Gyrus | 22 | 66 | 14 | 0 | 3.25 | |
| R. Precentral Gyrus | 6 | 64 | -8 | 42 | 2.4 | |
Figure 2.
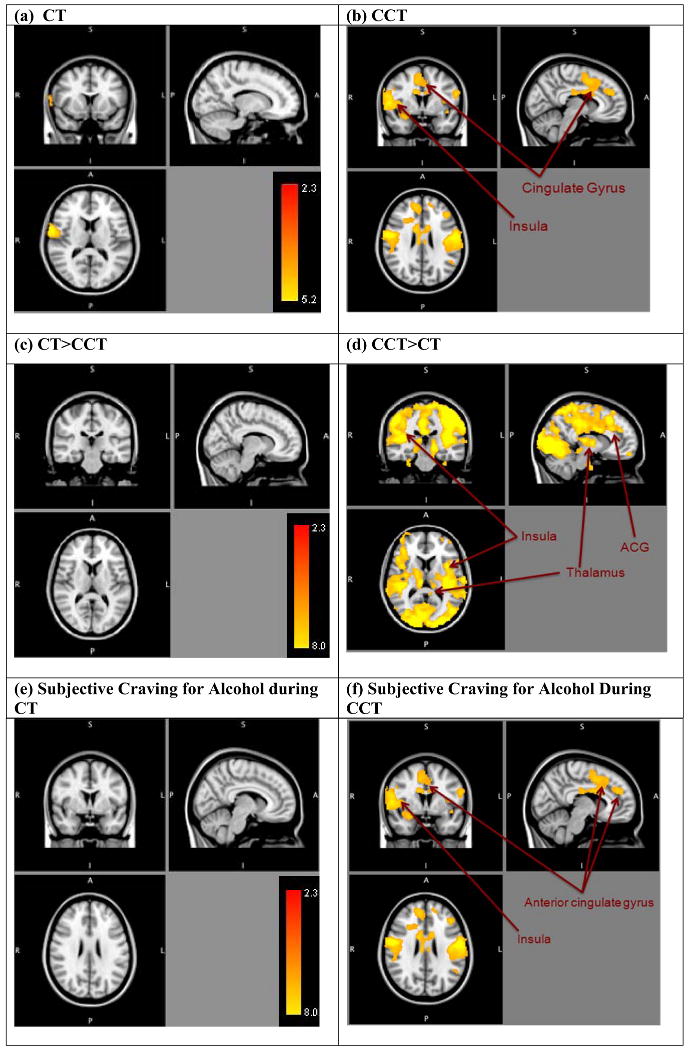
Areas of significantly positive correlation between [a] ChangeTalk (CT) and [b] CounterChange Talk (CCT) with BOLD response to alcohol taste cues (vs. control cues) (cluster-corrected p<.05, z=2.3), between [c] Change Talk vs. Counterchange Talk (CT>CCT), [d] and CounterChange Talk vs. Change Talk (CCT>CT), and BOLD response to alcohol taste cues (vs. control cues) (cluster-corrected p<.05, z=2.3), and between subjective ratings for alcohol during [e] Change Talk (CT) and [f] CounterChange Talk (CCT) with BOLD response to alcohol taste cues (cluster-corrected p<.05, z=2.3). Right side represents right hemisphere activations.
CounterChange Talk (CCT)
There were widespread areas of activation during the CCT condition, highlighting the participants' response to alcohol cues after seeing and hearing their statements in support of sustaining their drinking behavior (e.g., “I deserve a drink.”). Specifically, significant activation emerged in reward areas, including the OFC, nucleus accumbens, insula (anterior and posterior), caudate, putamen, along with other salient and relevant areas including the thalamus, posterior cingulate, anterior cingulate gyrus (ACG), and supplemental motor area (SMA; cluster corrected p < .05, z = 2.3, 1 cluster, total number of voxels = 42,740; see Table 3 and Figure 2b).
Table 3.
Maximum loci of activation for BOLD response to cues following Counter Change Talk (CCT). Each cluster is listed below with the corresponding peak voxels of activation. (R=right, L=left, BA= Brodmann's area).
| Localization | BA | x | y | z | Max Z | |
|---|---|---|---|---|---|---|
| Main Effects of Counter Change Talk (CCT) During Alcohol Exposure (42,740 voxels) | ||||||
| R. Precentral Gyrus | 4 | 60 | -6 | 24 | 7.26 | |
| L. Postcentral Gyrus | 2 | -58 | -18 | 28 | 7.14 | |
| R. Precentral Gyrus | 43 | 58 | -6 | 10 | 6.81 | |
| R. Superior Temporal Gyrus | 22 | 66 | 8 | 2 | 5.38 | |
| R. Superior Temporal Gyrus | 38 | 64 | 14 | -4 | 5.02 | |
| R. Precentral Gyrus | 4 | 56 | -16 | 36 | 4.98 | |
Summary
Together, these data highlight that exposure to alcohol cues following CT did not result in reward area activation, whereas no such effect was found following CCT (i.e., reward areas were activated in response to alcohol cues).
Comparison of Change Talk (CT) versus CounterChange (CCT) on response to alcohol cues
Change Talk vs. Counterchange Talk (CT>CCT)
In the comparison of response to alcohol cues following CT vs. CCT, no significant activation emerged, indicating that there were no areas where the response to CT was greater than the response to CCT (see Table 2 and Figure 2c).
CounterChange Talk vs. Change Talk (CCT>CT)
Significant activation emerged in this analysis, whereby response to alcohol cues following CCT demonstrated significant activation in the insula (anterior and posterior), thalamus, posterior cingulate, ACG, and SMA (cluster corrected p<.05, z = 2.3, 1 cluster, total number of voxels = 81,778; see Table 4 and Figure 2d), indicating that the response to alcohol cues following CCT was greater than the response to alcohol cues following CT. Contrary to expectations, no activation emerged in striatal areas (i.e., nucleus accumbens, putamen, and caudate).
Table 4.
Maximum loci of activation for BOLD response to cues following the difference between CT and CCT (cluster-corrected p < .05, z = 2.3). Each cluster is listed below with the corresponding peak voxels of activation. (R=right, L=left, BA= Brodmann's area).
| Localization | BA | x | y | z | Max Z | |
|---|---|---|---|---|---|---|
| CT (Alcohol) >CCT (Alcohol) (0 voxels) | ||||||
| No significant difference. | -- | -- | -- | -- | -- | |
| CCT (Alcohol) >CT (Alcohol) (81,778 voxels) | ||||||
| L. Postcentral Gyrus | 3 | -40 | -28 | 56 | 6.32 | |
| L. Inferior Parietal Lobule | 40 | -46 | -36 | 54 | 6.15 | |
| L. Postcentral Gyrus | 3 | -40 | -22 | 54 | 6.12 | |
| L. Postcentral Gyrus | 3 | -40 | -16 | 50 | 6.08 | |
| R. Culmen | -- | 26 | -48 | -24 | 6 | |
| L. Superior Frontal Gyrus | 11 | -24 | -62 | -14 | 5.98 | |
Associations between subjective ratings for Alcohol During CT and CCT and response to cues
To evaluate how this neural activation is related to behavior, we examined the correlation between the subjective urge for alcohol (see Figure 2e and 2f) following exposure to alcohol in the CT and CCT conditions and BOLD response to alcohol cues. In terms of subjective ratings, participants reported an average urge of 2.20 (SD = .926) after the CT condition and 2.43 (SD = .940) after the CCT condition. No significant correlation emerged between subjective urge ratings in the CT condition (see Table 5 and Figure 2e), indicating that there was no significant association between behavior and neural response to cues in the CT condition. In contrast, significantly correlated areas of activation emerged between subjective urge for alcohol and neural response to cues following CCT in several areas, including the insula (anterior and posterior) and cingulate gyrus (cluster corrected, p < .05, z = 2.3, 3 clusters, total number of voxels = 14,126; see Table 5 and Figure 2f), indicating a significantly positive association between subjective urge to drink and the neural response to alcohol cues following CCT, such that brain activation increased with subjective urge during the CCT condition following the alcohol exposure.
Table 5.
Maximum loci of activation for BOLD response to cues following subjective cravings for alcohol following CT and CCT. Each cluster is listed below with the corresponding peak voxels of activation. (R=right, L=left, BA= Brodmann's area).
| Localization | BA | x | y | z | Max Z | |
|---|---|---|---|---|---|---|
| Subjective craving ratings for alcohol during CT condition (0 voxels) | ||||||
| No significant activation | -- | -- | -- | -- | -- | |
| Subjective craving ratings for alcohol during CCT condition (3 clusters; 14,126 voxels) | ||||||
| Cluster 3 (5,220 voxels) | ||||||
| L. Precentral Gyrus | 4 | -56 | -12 | 28 | 4.01 | |
| L. Precentral Gyrus | 43 | -52 | -12 | 12 | 3.63 | |
| L. Transverse Temporal Gyrus | 42 | -58 | -16 | 14 | 3.61 | |
| L. Precentral Gyrus | 4 | -40 | -14 | 48 | 3.11 | |
| L. Superior Parietal Lobule | 7 | -40 | -64 | 52 | 3.09 | |
| L. Inferior Parietal Lobule | 40 | -56 | -30 | 40 | 2.98 | |
| Cluster 2 (4,991 voxels) | ||||||
| L. Precentral Gyrus | 6 | 58 | -4 | 24 | 4.03 | |
| R. Superior Temporal Gyrus | 22 | 58 | -4 | 8 | 3.78 | |
| R. Transverse Temporal Gyrus | 42 | 62 | -12 | 14 | 3.73 | |
| R. Postcentral Gyrus | 43 | 54 | -12 | 14 | 3.57 | |
| R. Superior Temporal Gyrus | 22 | 64 | -8 | 8 | 3.5 | |
| R. Superior Temporal Gyrus | 22 | 64 | 8 | 2 | 3.4 | |
| Cluster 1 (3,995 voxels) | ||||||
| L. Middle Frontal Gyrus | 46 | -42 | 32 | 24 | 3.06 | |
| R. Cingulate Gyrus | 24 | 12 | 6 | 28 | 3.05 | |
| R. Cingulate Gyrus | 24 | 10 | 6 | 46 | 3.01 | |
| R. Medial Frontal Gyrus | 9 | 10 | 46 | 24 | 2.99 | |
| R. Medial Frontal Gyrus | 32 | 8 | 10 | 44 | 2.98 | |
| R. Angerior Cingulate | 33 | 10 | 10 | 24 | 2.96 | |
Manipulation Check
To determine whether the observed results were unique to alcohol or simply a response to all appetitive cues, the effects of CT and CCT in the context of the appetitive control (litchi) were examined. In evaluating this relationship [Alcohol (CCT>CT) vs. Litchi (CCT>CT)], the difference between the talk conditions was found to be greater for alcohol than for litchi, with significant difference emerging in the insula (anterior and posterior), caudate, anterior cingulate, cingulate gyrus, precuneus and SMA. In addition, in the second contrast [Litchi (CCT>CT) vs. Alcohol (CCT>CT)], a significant difference only emerged in a non-reward area, specifically, the mid-temporal gyrus. Together, these data indicate that the significant patterns that emerged during the talk conditions were specific to alcohol.
Discussion
The goal of this study was to provide a preliminary investigation of the biological basis for the pattern of response observed during an empirically-supported alcohol intervention (motivational interviewing; Miller and Rollnick, 2002). Prior research has highlighted the importance of reward areas in addiction (see Kalivas and Volkow, 2005; Robinson and Berridge, 1993). It was therefore proposed that salient client statements (e.g., change talk; CT) might be involved in behavior change through activation of the reward network during high-risk situations (e.g., when alcohol is present). Using sight (having participants view the written words of their statements) and sound (replaying their own voice) clients were re-presented with their in-session CT and CCT statements during an fMRI alcohol cue-exposure paradigm. Significant differences emerged in response to the alcohol cues, such that participants evidenced significant activation during the CCT condition, but not during the CT condition (See Figure 2). These results suggest that CT may effectively inhibit activation in salient reward areas during high-risk situations (e.g., when presented with alcohol).
In this preliminary study, following presentation of the CCT statements, or statements in favor of maintaining the status quo (e.g., “Drinking is not a problem for me”), the pattern of brain response to the alcohol cues paralleled that observed in heavy drinking and alcohol dependent adults (Filbey et al., 2008a; Filbey et al., 2008b). More specifically, during the client statements in favor of sustaining their alcohol use, we found significant activation in key reward areas (e.g., OFC, anterior insula, posterior insula, striatum, thalamus). These areas are highly relevant to the ability to manage urges to drink during high-risk situations (e.g., when alcohol is present). In addition, they map onto the areas observed during prior craving studies [(e.g., OFC; Hermann et al., 2006; Myrick et al., 2004) (e.g., ACG; insula; posterior cingulate; thalamus; Filbey et al., 2008a)]. Furthermore, they are consonant with the broader research highlighting the role of these areas in addiction (more broadly, Kalivas and Volkow, 2005; Robinson and Berridge, 2001), craving (e.g., thalamus = George et al., 2001; Modell et al., 1990); (e.g., SMA = Smolka et al., 2006), and relapse (e.g., insula = Paulus et al., 2005). Moreover, these areas have been implicated in coding the motivational significance of stimuli (e.g., OFC = Ernst et al., 2002), evaluating positive and negative outcomes (e.g., OFC = Ernst and Paulus, 2005; Volkow et al., 2002), and are likely to be involved in error monitoring and detection (e.g., AC = Garavan and Stout, 2005).
In contrast, after presentation of the CT statements, no areas of activation emerged in response to the alcohol cues. As these areas were significantly activated during the CCT, this differential pattern of activation suggests that CT is significantly inhibiting the activation of salient reward areas. This is notable, as prior research has found that greater activation of these areas corresponds with greater alcohol use disorder severity (Filbey et al., 2008a), indicating that the pattern of activation emerging during the CCT statements is a profile of risk in terms of alcohol use. However, building upon prior work, this preliminary study suggests that this profile of risk might not be static. Rather, it appears that targeted components of psychosocial interventions are actually able to shift this profile within a very brief period of time, subsequently suppressing the risk. This is compelling for several reasons. First, it lends biological credence to the observed efficacy of MI in reducing risk for drinking. Second, it builds upon important studies highlighting the role of treatment status, motivation, context, and internal dialogue in the varying activation of salient reward areas (e.g., Koeningsberg et al., 2010; Wilson, Sayette & Fiez, 2004). Similarly, it advances the authors' current working model (Figure 3) and provides a foundation for more pinpointed explorations regarding the directionality of internal and expressed motivation for change in therapy, and subsequent behavior. Finally, it suggests an important avenue for future research; understanding how to sustain the profile observed during CT. Specifically, investigations of how to continue client CT thoughts outside of the context of a psychotherapy session are likely to be key to successful drinking reductions.
Figure 3. Proposed model.

Summary, Limitations, and Future Directions
This study is an important first step towards understanding the basic biological substrates underlying effective psychosocial interventions. However, there are a number of limitations. First and foremost, while this pilot study had a good representation of age, gender, and ethnicity, it had a very limited sample size. Thus, replication with a larger, and more diverse, sample is important for clarifying several questions. For example, we found that the BOLD signal and subjective urge was correlated in the CCT trials but not the CT trials. This finding may imply that CT weakens the connection between BOLD response and subjective urge. Alternatively, there may not have been adequate power in the current study to determine the direction and strength of the correlation in the CT condition. Similarly, this sample included only alcohol dependent adults who were actively seeking intervention. An interesting and important next step would be to evaluate this paradigm with a broader range of alcohol users (from heavy drinkers through those with alcohol dependence), as well a sample with a range of motivation to change (from non-treatment-seekers, to those who may be mandated to treatment against their will, such as DWI offenders), in order to determine whether the same effects are still observable. Second, a future study might include a control group (such as a sample of social drinkers (e.g., < 14 drinks/week; Myrick et al., 2008), a non-change talk placebo control condition (e.g., random statements), and an evaluation of test-retest reliability. These additions would help highlight whether the observed activation (or lack thereof) is directly attributable to alcohol dependence, the nature of change talk, and the robustness of CT and CCT in fMRI across sessions. Third, while research studies have indicated that the function of client talk is likely to be comparable across different types of interventions (e.g., Imel et al., 2008), future studies would benefit from the examination of client change statements within the context of other types of psychosocial interventions. Finally, the behavioral research findings and these preliminary integrative data suggest that CT may be integral in the efficacy of a psychosocial alcohol intervention. A final informative step would be to evaluate the relationship between these psychosocial mechanisms (e.g., CT), their genetic underpinnings (e.g., Hutchison, 2010), and their subsequent role in catalyzing and maintaining behavior change.
Acknowledgments
The authors would like to thank William R. Miller, PhD, Theresa Moyers, PhD, Amber McEachern, PhD, and Alisha Wray, MS for their review of this manuscript and Julie McCullough, MA for her assistance with this study.
Sources of Support: This research was supported by a grant (R01AA012238-07; last author) from the National Institute on Alcohol Abuse and Alcoholism.
Footnotes
Financial Disclosures: The authors declare that they have no competing financial or other conflicts of interest relating to the data included in the manuscript.
References
- Amrhein PC, Miller WR, Yahne CE. Client commitment language during motivational interviewing predicts drug use outcomes. Journal of Consulting and Clinical Psychology. 2003;71(5):862–878. doi: 10.1037/0022-006X.71.5.862. [DOI] [PubMed] [Google Scholar]
- Anton RF, O'Malley SS, Ciraulo DA, Cisler RA, Couper D, Donovan DM, Gastfriend DR, Hosking JD, Johnson BA, LoCastro JS, Longabaugh R, Mason BJ, Mattson ME, Miller WR, Pettinati HM, Randall CL, Swift R, Weiss RD, Williams LD, Zweben A COMBINE Study Research Group. Combined pharmacotherapies and behavioral interventions for alcohol dependence, the COMBINE Study: A randomized control trial. JAMA: Journal of the American Medical Association. 2006;295(17):2003–2017. doi: 10.1001/jama.295.17.2003. [DOI] [PubMed] [Google Scholar]
- Babor TF, Higgins-Biddle JC, Saunders JB, Monteiro MG. AUDIT: The Alcohol Use Disorders Indentification Test: Guidelines for Use in Primary Care. 2. The World Health Organization; 2006. [Google Scholar]
- Beckmann CF, Jenkinson M, Smith SM. General multilevel linear modeling for group analysis in FMRI. Neuroimage. 2003;20(2):1052–63. doi: 10.1016/S1053-8119(03)00435-X. [DOI] [PubMed] [Google Scholar]
- Bohn MJ, Krahn DD, Staehler BA. Development and initial validation of a measure of drinking urges in abstinent alcoholics. Alcohol Clin Exp Res. 1995;19(3):600–6. doi: 10.1111/j.1530-0277.1995.tb01554.x. [DOI] [PubMed] [Google Scholar]
- CDC. Alcohol-related disease impact (ARDI) Centers for Disease Control and Prevention; Atlanta, GA: 2008. [Google Scholar]
- Ernst M, Bolla K, Mouratidis M, Contoreggi C, Matochik J, Kurian V, Cadet J, Kimes A, London E. Decision-making in a risk-taking task: a PET study. Neuropsychopharmacology. 2002;26(5):682–691. doi: 10.1016/S0893-133X(01)00414-6. [DOI] [PubMed] [Google Scholar]
- Ernst M, Paulus M. Neurobiology of decision making: A selective review from a neurocognitive and clinical perspective. Biological Psychiatry. 2005;58:597–604. doi: 10.1016/j.biopsych.2005.06.004. [DOI] [PubMed] [Google Scholar]
- Feldstein Ewing SW, Hendershot C, Filbey FM, Hutchison K. What changes in therapy? The neurobiological mechanisms underlying behavioral alcohol interventions. under review. [DOI] [PMC free article] [PubMed] [Google Scholar]
- Feldstein Ewing SW, LaChance HA, Bryan A, Hutchison K. Do genetic and individual risk factors moderate the efficacy of motivational enhancement therapy? Drinking outcomes with an emerging adult sample. Addiction Biology. 2009;14(3):356–365. doi: 10.1111/j.1369-1600.2009.00149.x. [DOI] [PMC free article] [PubMed] [Google Scholar]
- Feldstein Ewing SW, Moyers T. The Motivational Interviewing in Neuroimaging (MINI) Study Intervention Manual. Mind Research Network; Albuquerque, NM: 2008. [Google Scholar]
- Filbey FM, Claus E, Audette AR, Niculescu M, Banich MT, Tanabe J, Du YP, Hutchison KE. Exposure to the taste of alcohol elicits activation of the mesocorticolimbic neurocircuitry. Neuropsychopharmacology. 2008a;33(6):1391–1401. doi: 10.1038/sj.npp.1301513. [DOI] [PMC free article] [PubMed] [Google Scholar]
- Filbey FM, Ray L, Smolen A, Claus ED, Audette A, Hutchison KE. Differential neural response to alcohol priming and alcohol taste cues is associated with DRD4 VNTR and OPRM1 genotypes. Alcoholism: Clinical and Experimental Research. 2008b;32(7):1113–1123. doi: 10.1111/j.1530-0277.2008.00692.x. [DOI] [PMC free article] [PubMed] [Google Scholar]
- First M, Spitzer R, Gibbon M, et al. User's guide for the Structured Clinical Interview for DSM-IV Axis I Disorders - SCID. American Psychiatric Press; Washington, D.C.: 1997. [Google Scholar]
- Garavan H, Stout J. Neurocognitive insights into substance abuse. TRENDS in Cognitive Sciences. 2005;9(4):195–201. doi: 10.1016/j.tics.2005.02.008. [DOI] [PubMed] [Google Scholar]
- George MS, Anton RF, Bloomer C, Teneback C, Drobes DJ, Lorberbaum JP, Nahas Z, Vincent DJ. Activation of prefrontal cortex and anterior thalamus in alcoholic subjects on exposure to alcohol-specific cues. Arch Gen Psychiatry. 2001;58(4):345–52. doi: 10.1001/archpsyc.58.4.345. [DOI] [PubMed] [Google Scholar]
- Hasin DS, Stinson FS, Ogburn E, Grant BF. Prevalence, correlates, disability, and comorbidity of DSM-IV alcohol abuse and dependence in the United States: Results from the National Epidemiologic Survey on Alcohol and Related Conditions. Archives of General Psychiatry. 2007;64(7):830–842. doi: 10.1001/archpsyc.64.7.830. [DOI] [PubMed] [Google Scholar]
- Hermann D, Smolka MN, Wrase J, Klein S, Nikitopoulos J, Georgi A, Braus DF, Flor H, Mann K, Heinz A. Blockade of cue-induced brain activation of abstinent alcoholics by a single administration of amisulpride as measured with fMRI. Alcohol Clin Exp Res. 2006;30(8):1349–54. doi: 10.1111/j.1530-0277.2006.00174.x. [DOI] [PubMed] [Google Scholar]
- Hutchison KE. Substance use disorders: Realizing the promise of pharmacogenetics and personalized medicine. Annu Rev Clin Psychol. 2010;6:577–589. doi: 10.1146/annurev.clinpsy.121208.131441. [DOI] [PubMed] [Google Scholar]
- Hutchison KE, Haughey HM, Niculescu M, Schact J, Kaiser A, Stitzel J, Horton WJ, Filbey FM. The incentive salience of alcohol: Translating the effects of genetic variant in CNR1. Archives of General Psychiatry. 2008;65(7):841–850. doi: 10.1001/archpsyc.65.7.841. [DOI] [PMC free article] [PubMed] [Google Scholar]
- Imel ZE, Wampold BE, Miller SD, Fleming RR. Distinctions wihtout a difference: Direct comparisons of psychotherapies for alcohol use disorders. Psychology of Addictive Behaviors. 2008;22(4):533–543. doi: 10.1037/a0013171. [DOI] [PubMed] [Google Scholar]
- Jenkinson M, Bannister P, Brady M, Smith S. Improved optimization for the robust and accurate linear registration and motion correction of brain images. Neuroimage. 2002;17:825–841. doi: 10.1016/s1053-8119(02)91132-8. [DOI] [PubMed] [Google Scholar]
- Jenkinson M, Smith S. A global optimisation method for robust affine registration of brain images. Med Image Anal. 2001;5(2):143–56. doi: 10.1016/s1361-8415(01)00036-6. [DOI] [PubMed] [Google Scholar]
- Kalivas PW, Volkow ND. The neural basis of addiction: a pathology of motivation and choice. American Journal of Psychiatry. 2005;162(8):1403–13. doi: 10.1176/appi.ajp.162.8.1403. [DOI] [PubMed] [Google Scholar]
- Koeningsberg H, Fan J, Ochsner KN, Liu X, Guise K, Pizzarello S, Dorantes C, Tecuta L, Guerreri S, Goodman M, New A, Flory J, Siever JL. Neural correlates of using distancing to regulate emotional responses to social situations. Neuropsychologia. doi: 10.1016/j.neuropsychologia.2010.03.002. in press. [DOI] [PMC free article] [PubMed] [Google Scholar]
- Miller WR, C'de Baca J, Matthews DB, Wilbourne PL. Personal Values Card Sort. University of New Mexico; 2001. [Google Scholar]
- Miller WR, Rollnick S. Motivational interviewing: Preparing people for change. 2nd. Guilford Press; New York: 2002. [Google Scholar]
- Modell JG, Mountz JM, Beresford TP. Basal ganglia/limbic striatal and thalamocortical involvement in craving and loss of control in alcoholism. J Neuropsychiatry Clin Neurosci. 1990;2:123–144. doi: 10.1176/jnp.2.2.123. [DOI] [PubMed] [Google Scholar]
- Mokdad AH, Marks JS, Stroup DF, Gerberding JL. Actual causes of death in the United States, 2000. JAMA. 2004;291(10):1238–1245. doi: 10.1001/jama.291.10.1238. [DOI] [PubMed] [Google Scholar]
- Moyers T, Martin T, Houck JM, Christopher PJ, Tonigan JS. From in-session behaviors to drinking outcomes: A causal chain for motivational interviewing. Journal of Consulting and Clinical Psychology. 2009;77(6):1113–1124. doi: 10.1037/a0017189. [DOI] [PMC free article] [PubMed] [Google Scholar]
- Moyers TB, Martin T. Therapist influence on client language during motivational interviewing sessions. Journal of Substance Abuse Treatment. 2006;30:245–251. doi: 10.1016/j.jsat.2005.12.003. [DOI] [PubMed] [Google Scholar]
- Moyers TB, Martin T, Christopher PJ, Houck JM, Tonigan JS, Amrhein PC. Client language as a mediator of motivational interviewing efficacy: Where is the evidence? Alcoholism: Clinical and Experimental Research Sup. 2007;31(10):40–47S. doi: 10.1111/j.1530-0277.2007.00492.x. [DOI] [PubMed] [Google Scholar]
- Myrick H, Anton RF, Li X, Henderson S, Drobes D, Voronin K, George MS. Differential brain activity in alcoholics and social drinkers to alcohol cues: relationship to craving. Neuropsychopharmacology. 2004;29(2):393–402. doi: 10.1038/sj.npp.1300295. [DOI] [PubMed] [Google Scholar]
- Myrick H, Anton RF, Li X, Henderson S, Randall PK, Voronin K. Effects of naltrexone and ondansetron on alcohol-cue activation of the ventral striatum in alcohol-dependent people. Arch Gen Psychiatry. 2008;65(4):466–475. doi: 10.1001/archpsyc.65.4.466. [DOI] [PMC free article] [PubMed] [Google Scholar]
- Pagnoni G, Zink CF, Montague PR, Berns GS. Activity in human ventral striatum locked to errors of reward prediction. Nature Neuroscience. 2002;5(2):97–98. doi: 10.1038/nn802. [DOI] [PubMed] [Google Scholar]
- Paulus MP, Tapert SF, Schuckit MA. Neural activation patterns of methamphetamine-dependent subjects during decision making predict relapse. Archives of General Psychiatry. 2005;62:761–768. doi: 10.1001/archpsyc.62.7.761. [DOI] [PubMed] [Google Scholar]
- Project Match Research Group. Matching patients with alcohol disorders to treatments: Clinical implications from project MATCH. Journal of Mental Health. 1998;7(6):589–602. [Google Scholar]
- Robinson TE, Berridge KC. The neural basis of drug craving: an incentive-sensitization theory of addiction. Brain Res Brain Res Rev. 1993;18(3):247–91. doi: 10.1016/0165-0173(93)90013-p. [DOI] [PubMed] [Google Scholar]
- Robinson TE, Berridge KC. Incentive-sensitization and addiction. Addiction. 2001;96:103–114. doi: 10.1046/j.1360-0443.2001.9611038.x. [DOI] [PubMed] [Google Scholar]
- Rorden C, Brett M. Stereotaxic display of brain lesions. Behav Neurol. 2000;12(4):191–200. doi: 10.1155/2000/421719. [DOI] [PubMed] [Google Scholar]
- Skinner HA, Horn JL. Alcohol Dependence Scale (ADS) Users Guide. Addiction Research Foundation; Toronto: 1984. [Google Scholar]
- Smith SM. Fast robust automated brain extraction. Hum Brain Mapp. 2002;17(3):143–55. doi: 10.1002/hbm.10062. [DOI] [PMC free article] [PubMed] [Google Scholar]
- Smolka MN, Buhler M, Klein S, Zimmermann U, Mann K, Heinz A, Braus DF. Severity of nicotine dependence modulates cue-induced brain activity in regions involved in motor preparation and imagery. Psychopharmacology (Berl) 2006;184(3-4):577–88. doi: 10.1007/s00213-005-0080-x. [DOI] [PubMed] [Google Scholar]
- Team UR. Effectiveness of treatment for alcohol problems: Findings of the randomised UK alcohol treatment trial (UKATT) BMJ. 2005;331(7516):541. doi: 10.1136/bmj.331.7516.541. [DOI] [PMC free article] [PubMed] [Google Scholar]
- Volkow N, Fowler J, Wang GJ, Goldstein R. Role of dopamine, the frontal cortex and memory circuits in drug addiction: Insight from imaging studies. Neurobiology of Learning and Memory. 2002;78:610–624. doi: 10.1006/nlme.2002.4099. [DOI] [PubMed] [Google Scholar]
- Wilson SJ, Sayette MA, Fiez JA. Prefrontal responses to drug cues: A neurocogntiive analysis. Nature Neuroscience. 2004;7:211–214. doi: 10.1038/nn1200. [DOI] [PMC free article] [PubMed] [Google Scholar]
- Woolrich MW, Behrens TE, Beckmann CF, Jenkinson M, Smith SM. Multilevel linear modeling for fMRI group analysis using Bayesian inferecence. Neuroimage. 2004;21:1732–1747. doi: 10.1016/j.neuroimage.2003.12.023. [DOI] [PubMed] [Google Scholar]
- Woolrich MW, Ripley BD, Brady M, Smith SM. Temporal autocorrelation in univariate linear modeling of FMRI data. Neuroimage. 2001;14(6):1370–86. doi: 10.1006/nimg.2001.0931. [DOI] [PubMed] [Google Scholar]