

Abstract
Estrogen receptor α (ER) and p53 are critical prognostic indicators in breast cancer. Loss of functional p53 is correlated with poor prognosis, ER negativity and resistance to antiestrogen treatment. Previously, we found that p53 genotype was correlated with ER expression and response to tamoxifen in mammary tumors arising in MMTV-Wnt-1 transgenic mice. These results lead us to hypothesize that p53 may regulate ER expression. To test this, MCF-7 cells were treated with doxorubicin or ionizing radiation, both of which stimulated a 5-fold increase in p53 expression. ER expression was also increased 4-fold over a 24 hour time frame. In cells treated with siRNA targeting p53, expression of both p53 and ER was significantly reduced (>60%) by 24 hours. Induction of ER by DNA-damaging agents was p53-dependent as either IR or dox failed to upregulate ER after treatment with p53-targeting siRNA. To further investigate whether p53 directly regulates transcription of the ER gene promoter, MCF-7 cells were transiently transfected with a wild type (WT) p53 expression vector along with a luciferase reporter containing the proximal promoter of ER. In cells transfected with WT p53, transcription from the ER promoter was increased 8-fold. Chromatin immunoprecipitation assays showed that p53 was recruited to the ER promoter along with CARM1, CBP, c-Jun and Sp1 and that this multifactor complex was formed in a p53-dependent manner. These data demonstrate that p53 regulates ER expression through transcriptional control of the ER promoter, accounting for their concordant expression in human breast cancer.
Keywords: Breast Cancer, Estrogen Receptor, p53
Introduction
Estrogen receptor α (ER) plays a critical role in normal breast development and is also involved in the pathogenesis of breast cancer (1,2). ER expression defines a subset of cancer patients who, in general, have a better prognosis than patients with ER negative tumors (3). Epidemiological studies show a strong correlation between ER expression and other positive indicators, such as lower tumor grade and proliferative index. In addition, there is a well-established relationship between ER expression in breast tumors, response to antiestrogen treatment and disease-free survival (4,5). In contrast, ER negative tumors are more likely to recur, develop metastases and to have markers of poor prognosis, including high tumor grade and proliferative index and inactivating mutations in p53 (4-12).
Mutations in the p53 tumor suppressor gene are frequently associated with human malignancies, including 20-40% of breast cancers (7,8). Stabilization of WT p53 in response to DNA damage promotes cell cycle arrest and apoptosis, while mutations in p53 lead to tumorigenesis and multiple drug resistance in breast cancer (13,14). Like many other transcription factors, regulation of gene expression by p53 is mediated both by direct binding to target gene promoters and interaction with other nuclear proteins such as AP-1, CCAAT binding protein (CBP), and Sp1 (15,16). The diverse nature of p53 target genes demonstrates p53 involvement in various pathways, including cell cycle control (cyclin G and p21), angiogenesis (GD-AIF and thrombospondin), DNA repair (GADD45), growth factor signaling (IGF-BP3) and apoptosis (bax and FAS) (15).
Animal experiments performed in our laboratory demonstrated that p53 genotype correlated with ER expression and response to tamoxifen in mammary tumors arising in MMTV-Wnt-1 transgenic mice. Compared to tumors in p53 WT (+/+) mice, both ER mRNA and protein were significantly reduced in tumors from p53 (+/−) mice and further reduced in tumors that had a complete loss of p53 due to LOH, suggesting that expression of these two proteins is linked in mammary cancer1. Therefore, we hypothesized that p53 regulates ER expression. This relationship would be expected to impact expression of prognostic factors, including ER and progesterone receptor (PR), as well as tumor development and progression.
In this study, we report that p53 regulates expression of ER in breast cancer cells. Our results show that ER gene transcription is regulated by p53 binding to the proximal promoter in conjunction with other transcriptional cofactors, including CARM1, CBP, c-Jun and Sp1. Our results also provide mechanistic insight into clinical data demonstrating the coexpression of WT p53 and ER in human breast cancers (9-12).
Materials and Methods
Tissue Culture
MCF-7, MDA-MB-453 and ZR75.1 human breast cancer cells were maintained in phenol red-free DMEM or RPMI supplemented with 5% (v/v) fetal bovine serum (FBS) in 5% CO2 at 37°C. Cells were plated in phenol red-free DMEM/RMPI containing 5% (v/v) dextran-coated charcoal-stripped FBS to ensure steroid-free conditions. At 60-80% confluence, cells were treated as indicated in figure legends. Doxorubicin (dox) was obtained from Tocris Bioscience (Ellisville, MO).
P53 siRNA constructs and expression vectors
The siRNA constructs used were siGENOME SMARTpool siRNA reagents targeting p53 or negative controls, including scrambled sequence and lamin A-targeting siRNA constructs (Thermo Fisher Scientific, Lafayette. CO). For transfection using a 6 well plate, siRNA (from 20 nM stock) or plasmid DNA (from 1 μg/μL stock) was mixed with Lipofectamine 2000 (Invitrogen, Carlsbad, CA) in serum-free DMEM with 1% BSA. After incubating for 15 minutes, solutions were added to the cells. Twenty-four hours after transfection, cells were treated with dox (0-100 nM) or ionizing radiation (IR) (0-16 Gy) as indicated in figure legends. The wild type (pC53-SN3) p53 expression vector was a kind gift from Dr. Bert Vogelstein (7).
Luciferase Assays
MCF-7 or MDA-MB-453 cells were transiently cotransfected with a luciferase reporter construct containing the ER promoter and wild type p53 expression vectors. The ERpromLuc vector was a kind gift from Dr. Ronald Weigel (17) and contained the ER proximal promoter region from −3500 bp to +210 bp relative to the transcription start site. Approximately 5 × 10³ cells per well in a 96-well plate were transfected and/or treated as indicated. Luciferase activity was measured using a luciferase assay kit (Promega, Madison, WI). The assay was normalized by cotransfection of a pCMV-β-gal plasmid (Clontech, Mountain View, CA) and β-galactosidase activity was measured using a β-gal assay kit (Galacto-Lightǀ, Applied Biosystems, Foster City, CA). The control empty vector employed was pGL2 basic from Promega.
Western Blot Analysis
Cells were washed once with PBS. Modified RIPA buffer (50 mM Tris-HCl pH 8, 150 mM NaCl, 1 mM EDTA pH 8, 1% NP-40, 0.25% Na-deoxycholate, 1 mg/ml protease inhibitor cocktail (Sigma-Aldrich, St. Louis, MO), 1 mM Na-orthovanadate, 1 mM NaF) was added to plates and cells scraped to harvest lysates. Following a 15 min incubation on ice, cells were centrifuged at 15,000 rpm for 30 minutes at 4° C. The supernatant was collected and protein content determined by BCA method (Pierce, Rockford, IL). Aliquots were run on SDS-PAGE using 10% acrylamide Criterion pre-cast gels (BioRad, Hercules, CA). Proteins were then electroblotted onto a PVDF membrane (Pierce, Rockford, IL). After blocking the membrane with 5% dry milk in PBS with 0.1% Tween 20, blots were probed with an antibody to p53 (DO-1, Santa Cruz Biotechnologies, Santa Cruz, CA), ER from Zymed (Invitrogen, Carlsbad, CA), or glyceraldehyde-3-phosphate dehydrogenase (GAPDH) (Abcam, Cambridge, MA). Secondary antibodies used were: horseradish peroxidase (HRP)-conjugated anti-rabbit IgG (Cell Signaling Technologies, Danvers, MA) for ER and GAPDH or HRP-conjugated anti-mouse IgG (Santa Cruz Biotechnologies, Santa Cruz, CA) for p53. Enhanced chemiluminescence was then used to visualize protein bands (Super Signal West Pico, Pierce, Rockford, IL). The image was captured on an Image Station 440CF (Kodak Digital Science, Rochester, NY) using Kodak ID v3.6 software (Kodak Scientific Imaging Systems, Rochester, NY) and protein expression analyzed using ImageQuant TL software (Amersham Biosciences, Piscataway, NJ). Western blots of ER, p53 and GAPDH were quantified by densitometry. Target protein bands were normalized to the GAPDH band in the same sample and then normalized to the untreated control to calculate the fold change.
Real-Time Quantitative PCR (RT-QPCR)
RNA was extracted from whole cells using the Absolutely RNA® kit, following manufacturer’s instructions (Agilent Technologies, La Jolla, CA). cDNAs were synthesized from 5μg of total RNA using random hexamers (Promega, Madison, WI) and reverse transcriptase (Invitrogen Corp., Carlsbad, CA). RT-QPCR was performed using the ABI Prizm® 7700 Sequence Detection System (Applied Biosystems, Foster City, CA). The primers and probes were obtained from Taqman® Gene Expression Assays (Applied Biosystems, Foster City, CA). Samples were run in duplicate on the same plate. Target gene expression was normalized to the reference gene, TATA binding protein (TBP), then normalized to the untreated control to determine the fold change.
Chromatin Immunoprecipitation (ChIP) Assay
ChIP assays were performed essentially as described (18). Briefly, 8 × 10⁶ cells were crosslinked with 1% formaldehyde for 10 minutes at 25° and lysed in RIPA buffer. The precleared extract was sonicated to produce 500 bp fragments and split into two portions; one was used for control input and the other was incubated with antibody and protein A/G beads (Pierce, Rockford, IL). Following IP, beads were washed four times with IP buffer (0.1% SDS, 1% Triton X-100, 2 mM EDTA pH 8, 150 mM NaCl, 20 mM Tris-HCl) and eluted in sample elution buffer (1% SDS, 100 mM NaHCO3). For PCR, the p21 promoter was used as a positive control (forward-CCAGCCCTTGGATGGTTT; reverse-GCCTCCTTTCTGTGCCTGA). Primers used for PCR from the ER promoter regions were (−2094 to −1941: forward-CTGCAAAATGCTCCCAAAGT; reverse-TGTTTGGTATGAAAAGGTCACA, −350 to −289: forward-GGGGAGATCTAACAGAAAGAGAGACAA; reverse-CCCTAGATCTGTCTTTCGCGTTTAT, −128 to −40: forward-GGGAGATCTGCCTGGAGTGATGTTTAAG; reverse-TATGAGATCTGGAGACCAGTACTTAAAG). Identical analyses on the human GAPDH, TBP and α-actin promoters were included as controls (GAPDH: forward-GTCCACTGGCGTGTTCACCA; reverse-GTGGCAGTGATGGCATGGAC, TBP: forward-GACCTATGCTCACACTTCTCATGG; reverse-GAACCTGCCCGACCTCACTGAA, Actin: forward-TCGATATCCACGTGACATCCA; reverse-GCAGCATTTTTTTACCCCCTC). For ChIP studies with dox-treated cells, MCF-7 cells were treated with 50 nM dox 4 hr prior to ChIP analysis. Antibodies against CARM1, c-Jun, c-Fos and Sp1 were from Upstate (Millipore, Billerica, MA). CBP and p53 antibodies were from Santa Cruz Biotechnologies (Santa Cruz, CA). The HDM2 antibody was obtained from Cell Signaling Technologies (Danvers, MA) and the RNA polymerase II antibody was obtained from Active Motif (Carlsbad, CA). Protein levels of p53 and associated cofactors were determined by immunoblot with antibodies against p53, CARM1, CBP, c-Jun, c-Fos, HDM2 or Sp1 followed by densitometry as described above.
Statistical Analysis
All experiments were performed in triplicate. Numerical data are expressed as mean ± SD. Two group comparisons were analyzed by two-sided Student’s t-test. Multiple group comparisons were analyzed with ANOVA tests. P < 0.05 was considered significant. Statistical analysis was conducted and graphical representations of the data were plotted using Excel® X for Mac®.
Results
IR and doxorubicin upregulate ER expression
To test whether activation of p53 affected ER gene expression, MCF-7 cells were treated with ionizing radiation (IR) or doxorubicin (dox), both of which are known to increase expression of p53 by stabilizing the protein (19). Figure 1 shows results obtained following treatment with IR (A and B) or dox (C and D). A 3-fold induction in p53 mRNA was detected at 4 hours following 8 Gy of IR, reaching a peak, 8-fold induction by 12 hours and decreasing again by 24 hours (Fig. 1A). IR similarly induced ER mRNA, although with a delayed time frame. IR (8 Gy) stimulated a 3-fold increase in ER mRNA by 8 hours, which reached a maximum 6-fold induction by 12 hours and was maintained through 24 hours (Fig. 1A).
Figure 1.

Upregulation of p53 by ionizing radiation (IR) or doxorubicin (dox) stimulates increased ER expression in MCF-7 cells. (A) IR treatment increased p53 and ER mRNA as determined by RT-QPCR. * p<0.05 for 8 Gy at indicated times vs. non-irradiated control by Student’s t-test. (B) Treatment of MCF-7 cells with IR induced a time- and dose-dependent increase in p53 protein expression accompanied by corresponding increases in ER protein. * p<0.05 for all IR doses vs. non-irradiated control by ANOVA. (C) Dox increased p53 and ER mRNA levels by 0.5 and 4 hr, respectively, as determined by RT-QPCR. Message levels of downstream target genes of p53 (p21) and ER (PR) were induced with similar kinetics. * p<0.05 for target genes at indicated times vs. untreated control by ANOVA. (D) Treatment of MCF-7 cells with dox induced a time- and dose-dependent increase in p53 protein expression accompanied by corresponding increases in ER. * p<0.05 for 10 nM dose vs. untreated control; ** p<0.05 for 50 and 100 nM doses vs. both 10 nM and untreated control by ANOVA. Graphs in B and D depict means ± SD of three independent experiments with representative Western blots shown below.
In addition to the effect on p53 mRNA, IR stimulated a 6-fold induction in p53 protein over a 12 hour time frame (Fig. 1B) with maximal expression at 8 hours after treatment. IR stimulated a concordant increase in ER protein expression and results showed a 5-fold induction in ER protein over the same time frame with maximal induction at 8 hours. Protein expression in IR-treated groups was significantly different from the untreated control (p≤0.01). Although there was a trend towards dose response, the difference between the three doses did not achieve statistical significance. The kinetics of ER induction are consistent with published results for p21, another p53-responsive gene (20-22). Similar results were observed with the chemotherapeutic agent, doxorubicin (dox). P53 mRNA expression was significantly upregulated by 0.5 hours (p≤0.006) and reached a peak 7-fold induction at 8 hours (p≤0.005) following dox treatment (Fig. 1C). ER mRNA expression was increased 2-fold by 4 hours and reached a 6-fold induction by 8 hours. Dox also impacted p53 and ER protein expression. Treatment stimulated a 5-fold induction in p53 and a 4-fold induction in ER protein expression compared to vehicle-treated cells (p≤0.03) (Fig. 1D). A partial dose response was observed, with the 10 nM treatment group being significantly different from both the 50 and 100 nM groups, but no difference was observed between the 50 and 100 nM groups.
To investigate functional impacts of the upregulation of ER by p53, PR was evaluated as a downstream target of ER. Detectable increases in PR mRNA were observed by 8 hours after dox treatment (p≤0.005) (Fig. 1C). Expression of p21, a downstream target of p53, was also significantly upregulated by dox, starting at 0.5 hr after dox treatment and reaching a 7-fold peak by 8 hours, mirroring the kinetics of p53 mRNA induction.
These results demonstrate that increased p53 mRNA expression preceded changes in ER mRNA levels and suggest that p53 regulates ER expression, thereby contributing to downstream signaling pathways.
Suppression of p53 is associated with downregulation of ER expression
As our results demonstrated that ER expression was increased following dox or IR, p53-targeting siRNA constructs were transfected into MCF-7 cells to determine if p53 was required for regulation of ER expression. Addition of p53-targeting siRNA resulted in significant decreases in p53 mRNA (Fig. 2A top panel) as well as a reduction in the message level of its of its downstream target, p21 (Fig. 2A middle). ER mRNA expression was also significantly suppressed by p53-targeting siRNA during this timeframe (Fig. 2A bottom). As expected, transfection of a scrambled sequence siRNA construct did not affect expression of p53, p21 or ER mRNA.
Figure 2.

Targeted knockdown of p53 decreases expression of ER in MCF-7 cells. (A) RT-QPCR analyses show decreased expression of p53, p21 and ER mRNA 24 hours after treatment with p53-targeting small interfering (si)RNA. * p<0.05 for siRNA treated cells vs. vehicle-treated or scrambled sequence siRNA-treated controls, as determined by Student’s t-test. (B) Western blot analyses demonstrated downregulation of both p53 and ER by treatment with 20-100 nM p53-targeting siRNA. siRNA constructs targeting p53 suppressed p53 protein expression by approximately 60% after 24 hr, with 50% reductions in ER protein expression, determined by densitometry of Western blots. * p<0.05 for all siRNA doses vs. mock-transfected control by ANOVA. Graphs in A represent means ± SD of three independent experiments with representative Western blots shown.
Addition of p53-targeting siRNA decreased p53 protein expression by 50% within 12 hours and 80% by 24 hours, compared vehicle-treated controls (p≤0.005) (Fig. 2B). ER protein expression levels were unchanged at 12 hours, but decreased 60% by 24 hours after treatment with the p53 siRNA. Reduced levels of both proteins persisted for 96 hours after siRNA transfection (Fig. 2B). Non-targeting scrambled sequence and lamin A-targeting siRNA did not affect expression of either p53 or ER proteins (data not shown). These results indicate that targeted depletion of p53 resulted in reduced ER expression at both the message and protein levels.
The effects of dox and IR on ER expression are p53 dependent
To further investigate the mechanism of p53 regulation of ER expression, MCF-7 cells were first transfected with p53-targeting siRNA and then exposed to IR or dox. Consistent with the results in Figure 1, IR stimulated a 5-fold induction of p53 protein expression over a 12-hour time frame, which was accompanied by a 4-fold induction in ER protein (Fig. 3A). Similarly, we detected an 8-fold induction of p53 protein at 12 hours and a coincident 7-fold increase in ER expression following dox treatment (Fig. 3B). Treatment of cells with p53-targeting siRNA reduced ER protein expression by >50%, similar to results reported in Fig. 2. However, when cells were depleted of p53 by siRNA prior to dox or IR treatment, ER induction was completely blocked, indicating that upregulation of ER was p53 dependent.
Figure 3.

The effects of DNA-damaging agents on ER expression are p53-dependent. Treatment with 20 nM siRNA 24 h prior to irradiation abrogated the stimulatory effect of 8 Gy IR (A) or 50 nM dox (B) on both p53 and ER protein expression. * p<0.05 for IR/dox-treated groups vs. untreated control; ** p<0.05 for p53-targeting siRNA-treated groups vs. untreated control by ANOVA. Graphs in (A) and (C) represent mean ± SD of three independent experiments with representative Western blots shown.
Similar results were obtained with ZR75.1 human breast cancer cells, which also express ER and have WT p53. In the ZR75.1 cell line, as in MCF-7s, the upregulation of ER by dox was p53-dependant and targeted depletion of p53 with siRNA resulted in decreased ER protein expression (supplementary figure 1).
P53 regulates the ER proximal promoter
We then transfected MCF-7 cells with a luciferase reporter construct containing the proximal promoter of the ER gene (ERpromLuc) (7,17) with or without the pC53-SN3 WT p53 expression vector (7) in order to determine whether p53 directly controls transcription of the ER gene promoter. Treatment with 50 nM doxorubicin increased p53 expression (Fig. 1D) and also induced a 3-fold increase in luciferase activity (Fig. 4A) compared to vehicle (p<0.001). As shown in Figure 4A, addition of the WT p53 expression vector pC53-SN3 stimulated an 8-fold increase in luciferase expression (p<0.001), which was further increased to 12-fold by treatment with dox (p<0.001 compared to ERpromLuc alone). Experimental controls including the ERpromLuc vector alone or in combination with the empty pGL2 basic vector (Fig. 4A and B) did not induce luciferase expression above basal levels.
Figure 4.

Addition of exogenous wild type (WT) p53 upregulates ER promoter activity. (A) MCF-7 cells were transfected with 2 μg ER-promoter-driven luciferase vector (ERpromLuc) either with or without co-transfection of the WT p53 expression vector, pC53-SN3. Cells were treated with 50 nM dox 24 hr after transfection. Luciferase activity was determined 12 hr later. Results are expressed as mean ± SD luciferase activity relative to the control cells transfected with the luciferase reporter alone. The promoter-less pGL2 basic vector was used as a negative control. * p<0.05 for designated treatments vs. ERpromLuc alone, by Student’s t-test. (Inset Panel) MCF-7 cells were transfected with p53-targeting siRNA 24 hours prior to transfection with the ERpromLuc vector and luciferase expression was measured 24 hours later. * p<0.05 for p53 siRNA versus vehicle-treated control or scrambled sequence-treated cells by Student’s t-test. (B) MDA-MB-453 cells, which lack both ER and functional p53 expression, were treated as described for A. * p<0.05 for designated treatments vs. ERpromLuc alone by Student’s t-test.
In order to determine if p53 could regulate not only inducible activity of the ER promoter, but also basal transcription, the p53 targeting siRNA was transfected into untreated MCF-7 cells. Addition of p53-targeting siRNA resulted in a 48% (p = 0.009) decrease in basal expression of the ERpromLuc construct (Fig. 4A-inset panel). These data support our earlier results showing that ER expression was decreased following siRNA-mediated knockdown of p53 (Figure 3) and demonstrate that p53 contributes to basal as well as dox-inducible ER expression.
To better define the effect of p53 on transcriptional activity of the ER gene promoter, experiments were also conducted in the p53-null MDA-MB-453 breast cancer cell line. In the absence of endogenous p53, dox treatment was unable to induce ER promoter activity in these cells (Fig. 4B). However, addition of WT p53 (pC53-SN3) stimulated a 5-fold increase in luciferase activity, which was enhanced to 14-fold by dox, compared to the ERpromLuc vector alone. These results demonstrate that p53 regulated ER expression in breast cancer cells by increasing transcriptional activity at the proximal promoter.
P53 binds to the ER promoter
To investigate the mechanism whereby p53 regulates the ER gene promoter activity, chromatin immunoprecipitation (ChIP) assays were utilized. A recent report indicates that the sequences between −350 bp to −289 bp and −128 bp to −40 bp upstream of the transcriptional start site are involved in transcriptional activity of the ER gene (23). Accordingly, three promoter regions were investigated in these experiments, including the previously identified −350 to −289 and −128 to −40 bp sequences, as well as a further upstream sequence spanning from −2094 to −1941 bp. Since our results showed that dox treatment upregulated ER mRNA in MCF-7 cells (Fig. 1D), we reasoned that this treatment would stimulate p53 recruitment to the ER promoter. ChIP assays utilizing a p53 antibody demonstrated that p53 was recruited to the −128 to −40 bp region of the proximal promoter in response to dox (Fig. 5A). P53 was also detected at the distal regions of the ER promoter (−2094 to −1941 bp and −350 to −289 bp), but these associations were not altered by dox treatment. As anticipated, following exposure to dox, p53 was also immunoprecipitated at the p21 promoter, but not to the α-actin or TBP gene promoters.
Figure 5.

p53 recruitment to the proximal ER promoter is enhanced following dox treatment. (A) p53 associated with the ER promoter in three regions, but recruitment to the region −128 to −40 bp upstream of the transcriptional start site is enhanced by 50 nM dox treatment. Recruitment to the promoter region for p21 was used as a positive control and promoters for α-actin and TBP genes were used as negative control regions. (B) In ChIP assays, p53 co-immunoprecipitated with CARM1, CBP, c-Jun, c-Fos, HDM2 and Sp1. (C) ChIP assays utilizing CARM1, Sp1, c-Jun and CBP antibodies verified that each of these cofactors was also recruited to the −128 to −40 bp region of the ER promoter after dox treatment. Pretreatment of MCF-7 cells with 20 nM p53-targeting siRNA, but not non-targeting siRNA, blocked association of each of these cofactors to the −128 to −40 bp region of the ER promoter in response to 50 nM dox (“dox/siRNA” versus “dox” lanes). (D) ChIP assays utilizing a RNA pol II antibody verified that this component of the basal transcription machinery was recruited to the −128 to −40 bp region of the ER promoter after dox treatment.
To identify additional members of the ER-regulating transcriptional complex, co-immunoprecipitations were conducted utilizing antibodies that target several potential cofactors. It was recently reported that CARM-1, CBP and p53 co-immunoprecipitate in GST pull-down assays and cooperatively bind at the GADD45 gene promoter (24). Furthermore, in silico analyses identified AP-1, CBP and Sp1 response elements within the ER promoter regions described above. As shown in figure 5B, CARM1, CBP, c-Jun and Sp1 were detected in complexes immunoprecipitated with p53 antibody following dox treatment. In contrast, the amount of HDM2 protein co-immunoprecipated with p53 decreased after dox treatment, consistent with its role as a negative regulator of p53 expression (25,26). Interestingly, c-Fos did not co-immunoprecipitate with p53 following dox treatment, indicating that c-Jun was associated with the p53 either as a homodimer or with AP-1 proteins other than c-Fos, perhaps with other members of the Jun, Fos, ATF or JDP families.
ChIP assays, using antibodies directed against CARM1, CBP, c-Jun and Sp1, revealed that these four proteins were also recruited to the −128 to −40 bp region of the ER promoter after treatment with dox (Fig. 5C). Like p53, binding of all of these cofactors with upstream promoter regions of ER (−2094 to −1941 and −350 to −289) was not altered by dox treatment (data not shown).
To determine whether p53 was required for binding of CARM1, CBP, c-Jun and Sp1 to the ER promoter, MCF-7 cells were treated with p53-targeting siRNA constructs followed by ChIP analysis. As shown in Fig. 5C, dox did not stimulate p53/CARM1/CBP/c-Jun/Sp1 complex formation or DNA binding in cells transfected with p53 siRNA, indicating that p53 was required for assemply of the complex on the −128 to −40 bp region of the ER promoter. To further demonstrate that the −128 to −40 bp region of the ER gene promoter is critical for p53-mediated induction of transcriptional activity, the association of RNA polymerase II was assessed. Pol II binding to the −128 to −40 promoter was enhanced after dox treatment (Figure 5 D, “Dox” lane) and, as expected, pol II was not recruited to the upstream regions (−350 to −289; −2094 to −1941) of the promoter following dox treatment. These results further demonstrate that the −128 to −40 bp region is involved in dox-induced, p53-mediated transcription of the ER promoter.
Discussion
In this study, upregulation of p53 by DNA-damaging agents, IR or dox resulted in increased ER mRNA and protein expression, while siRNA-mediated p53 knockdown reduced ER expression. P53 was shown to directly regulate the ER promoter, as both endogenous as well as transiently expressed p53 increased transcriptional activation of the ER gene promoter in luciferase assays. Furthermore, p53 was recruited to the ER gene promoter as a part of a regulatory complex that included CARM1, CBP, c-Jun and Sp1. Analysis of the ER promoter showed that while there are response elements for Sp1, AP-1 and CBP, no p53 consensus response element is present in the proximal promoter, suggesting that p53 regulates the ER gene through protein-protein interactions (23). Furthermore, our data demonstrate that p53 was required for assembly of this complex as well as for induction of ER expression by dox.
There is accumulating evidence of crosstalk between growth-promoting pathways, such as those involving ER and p53. Evidence indicates that ER signaling increases expression and nuclear accumulation of p53 in vitro and in vivo (28-30). Recapitulation of the hormonal milieu of pregnancy by exposing rats to estrogen plus progesterone induces nuclear accumulation of p53 in mammary epithelium and protects against carcinogen challenge (33). While this literature represents substantial evidence that ER regulates p53 expression, the converse regulation of ER by p53 has not been studied and a mechanism linking ER expression with WT p53 is virtually unexplored. Although clinical and epidemiological studies have shown that ER positive human breast cancers express WT p53 and tumors with inactivating mutations in p53 tend to be ER negative, evidence for a direct transcriptional mechanism has been lacking. Results presented here show that p53 regulates the ER promoter in breast cancer cells and provide a possible explanation for the epidemiological findings that ER expression is associated with WT p53 in human breast cancers.
P53 is a widely recognized tumor suppressor gene, which limits proliferation by inducing cell cycle arrest or apoptosis (34,35). Intriguingly, recent reports suggest that p53 may also play a role in regulating genes involved in promotion of cell growth. Specifically, p53 mediates induction of cyclooxygenase-2, transforming growth factor-α, and heparin-binding EGF-like growth factor, all of which stimulate growth of normal and neoplastic cells (36-38). Furthermore, it has recently been reported that ER and p53 are associated on the promoter of vascular endothelial growth factor receptor to cooperatively enhance transcriptional activation (39). Consistent with these reports, our data suggest the presence of a functional link between the tumor suppressor p53 and growth-promoting ER signaling pathways.
The regulation of ER transcription is complex, involving multiple independent promoters and several alternative 5′ exons. While it has previously been demonstrated that Sp1 (40) and GATA-3 (41) are critical regulators of ER expression, the role of p53 in mediating expression of ER remains virtually unstudied. Our results show that despite the lack of a p53 consensus sequence, p53 bound to the proximal ER gene promoter along with CARM1, CBP, c-Jun and Sp1. Dox stimulated the p53-dependent assembly of the transcription complex at the −128 bp to −40 bp region of the ER proximal promoter, but not at the more distal regions. When considered along with the data showing that p53 siRNA reduced luciferase in untreated MCF-7 cells, these results suggest that the −2094 to −1941 and −350 to −289 regions may be responsible for basal transcription from the ER promoter, while the −128 to −40 bp region is involved in p53-inducible activity. It has previously been reported that transcription from this proximal promoter region (termed “promoter A” by Kos et al. (49) and including the −128 to −40 bp region studied here) predominates in ER positive breast cancer cells (42,43), but little is known regarding why this promoter region is preferentially utilized. The results presented here indicate that p53 plays a role in utilization of promoter A in ER positive breast cancers, potentially contributing to the reported overexpression of ER in post-menopausal breast cancer compared to normal mammary tissue (17,42,44).
One of the unexplained features of breast tumors with mutations in p53 is that they frequently lack ER expression, which is correlated with resistance to tamoxifen and poor prognosis (9-12,45). This is noteworthy as the molecular mechanisms responsible for the ER-negative phenotype are not well understood, but may include progressive loss of ER. Consistent with this is the observation that in transgenic mice with BRCA1 mutations, early mammary lesions are ER-positive, but expression is lost during tumor progression coincident with loss of functional p53 (46,47). Similarly, in human carriers of BRCA1/2 mutations, breast tumors tend to be ER negative, have mutated p53 and have a poorer prognosis than tumors with WT BRCA (48).
Our studies have identified a transcriptional mechanism that explains the observed correlation between p53 function and ER expression in human breast cancers. In this report, we demonstrate that p53 regulates ER expression, providing a mechanism to explain the concordance of WT p53 and ER expression and the high frequency of ER negativity observed in tumors with p53 mutations. Furthermore, these findings suggest that early mutations and/or loss of functional p53 during tumorigenesis may lead to ER negative breast cancers, which has consequences on tumor progression and response to anti-hormonal therapies.
Supplementary Material
Figure 6.
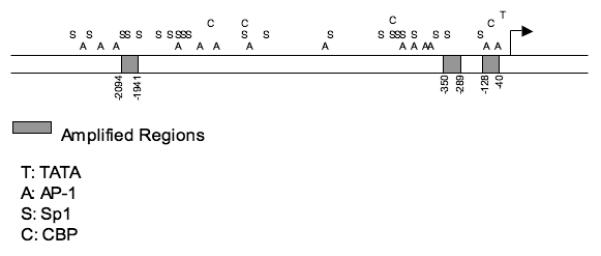
Schematic representation of the ER promoter. The bent arrow indicates the transcriptional start site. Shaded boxes represent regions targeted by primer sets. A: AP-1 response elements; C: CBP response elements; S: Sp1 response elements; and T: TATA box sequences. Transcription factor consensus sequences were identified using the web-based TESS (Transcription Element Search System) program (http://www.cbil.upenn.edu/cgibin/tess/tess).
Acknowledgments
Grant Support:Susan G. Komen Breast Cancer Foundation BCTR0201390 (to RFY) Ruth L. Kirschstein National Research Service Award / Departmental Training Grant CA09480 (to SHS)
NIEHS Center for Research on Environmental Disease (ES07784)
We would like to thank Dr. Bert Vogelstein for providing the p53 expression vectors and Dr. Ronald Weigel for the ER promoter luciferase construct as well as Dr. S.S. Lange for critical reading of this manuscript.
Financial Support:
NCI Cancer Center Support (CA16672)
Footnotes
Evidence for interdependence of estrogen receptor expression and p53 genotype in mouse mammary tumors that respond to tamoxifen. (manuscript in preparation) Robin Fuchs-Young, Isabel Lambertz, Jennifer K. L. Colby, Stephanie H. Shirley, Dennis Johnston, Lawrence A. Donehower, Stephen D. Hursting.
References
- 1.Heldring N, Pike A, Andersson S, et al. Estrogen receptors: how do they signal and what are their targets. Physiol Rev. 2007;87:905–31. doi: 10.1152/physrev.00026.2006. [DOI] [PubMed] [Google Scholar]
- 2.Katzenellenbogen BS, Katzenellenbogen JA. Estrogen receptor transcription and transactivation: Estrogen receptor alpha and estrogen receptor beta: regulation by selective estrogen receptor modulators and importance in breast cancer. Breast Cancer Res. 2000;2:335–44. doi: 10.1186/bcr78. [DOI] [PMC free article] [PubMed] [Google Scholar]
- 3.Lower EE, Glass EL, Bradley DA, Blau R, Heffelfinger S. Impact of metastatic estrogen receptor and progesterone receptor status on survival. Breast Cancer Res Treat. 2005;90:65–70. doi: 10.1007/s10549-004-2756-z. [DOI] [PubMed] [Google Scholar]
- 4.Knight WA, Livingston RB, Gregory EJ, McGuire WL. Estrogen receptor as an independent prognostic factor for early recurrence in breast cancer. Cancer Res. 1977;37:4669–71. [PubMed] [Google Scholar]
- 5.Horwitz KB, McGuire WL. Studies on mechanisms of estrogen and antiestrogen action in human breast cancer. Recent Results Cancer Res. 1980;71:45–58. doi: 10.1007/978-3-642-81406-8_9. [DOI] [PubMed] [Google Scholar]
- 6.Clark GM, Wenger CR, Beardslee S, et al. How to integrate steroid hormone receptor, flow cytometric, and other prognostic information in regard to primary breast cancer. Cancer. 1993;71:2157–62. doi: 10.1002/1097-0142(19930315)71:6+<2157::aid-cncr2820711606>3.0.co;2-o. [DOI] [PubMed] [Google Scholar]
- 7.Baker SJ, Markowitz S, Fearon ER, Willson JK, Vogelstein B. Suppression of human colorectal carcinoma cell growth by wild-type p53. Science. 1990;249:912–5. doi: 10.1126/science.2144057. [DOI] [PubMed] [Google Scholar]
- 8.Hollstein M, Sidransky D, Vogelstein B, Harris CC. p53 mutations in human cancers. Science. 1991;253:49–53. doi: 10.1126/science.1905840. [DOI] [PubMed] [Google Scholar]
- 9.Bhargava V, Thor A, Deng G, et al. The association of p53 immunopositivity with tumor proliferation and other prognostic indicators in breast cancer. Mod Pathol. 1994;7:361–8. [PubMed] [Google Scholar]
- 10.Coles C, Condie A, Chetty U, Steel CM, Evans HJ, Prosser J. p53 mutations in breast cancer. Cancer Res. 1992;52:5291–8. [PubMed] [Google Scholar]
- 11.Berns EM, Foekens JA, Vossen R, et al. Complete sequencing of TP53 predicts poor response to systemic therapy of advanced breast cancer. Cancer Res. 2000;60:2155–62. [PubMed] [Google Scholar]
- 12.Anderson WF, Jatoi I, Devesa SS. Distinct breast cancer incidence and prognostic patterns in the NCI’s SEER program: suggesting a possible link between etiology and outcome. Breast Cancer Res Treat. 2005;90:127–37. doi: 10.1007/s10549-004-3777-3. [DOI] [PubMed] [Google Scholar]
- 13.Petitjean A, Mathe E, Kato S, et al. Impact of mutant p53 functional properties on TP53 mutation patterns and tumor phenotype: lessons from recent developments in the IARC TP53 database. Hum Mutat. 2007;28:622–9. doi: 10.1002/humu.20495. [DOI] [PubMed] [Google Scholar]
- 14.Olivier M, Langerod A, Carrieri P, et al. The clinical value of somatic TP53 gene mutations in 1,794 patients with breast cancer. Clin Cancer Res. 2006;12:1157–67. doi: 10.1158/1078-0432.CCR-05-1029. [DOI] [PubMed] [Google Scholar]
- 15.Velculescu VE, El-Deiry WS. Biological and clinical importance of the p53 tumor suppressor gene. Clin Chem. 1996;42:858–68. [PubMed] [Google Scholar]
- 16.Yuan ZM, Huang Y, Ishiko T, et al. Role for p300 in stabilization of p53 in the response to DNA damage. J Biol Chem. 1999;274:1883–6. doi: 10.1074/jbc.274.4.1883. [DOI] [PubMed] [Google Scholar]
- 17.deConinck EC, McPherson LA, Weigel RJ. Transcriptional regulation of estrogen receptor in breast carcinomas. Mol Cell Biol. 1995;15:2191–6. doi: 10.1128/mcb.15.4.2191. [DOI] [PMC free article] [PubMed] [Google Scholar]
- 18.Orlando V, Strutt H, Paro R. Analysis of chromatin structure by in vivo formaldehyde cross-linking. Methods. 1997;11:205–14. doi: 10.1006/meth.1996.0407. [DOI] [PubMed] [Google Scholar]
- 19.Siu WY, Lau A, Arooz T, Chow JP, Ho HT, Poon RY. Topoisomerase poisons differentially activate DNA damage checkpoints through ataxia-telangiectasia mutated-dependent and -independent mechanisms. Mol Cancer Ther. 2004;3:621–32. [PubMed] [Google Scholar]
- 20.Al-Mohanna MA, Al-Khalaf HH, Al-Yousef N, Aboussekhra A. The p16INK4a tumor suppressor controls p21WAF1 induction in response to ultraviolet light. Nucleic Acids Res. 2007;35:223–33. doi: 10.1093/nar/gkl1075. [DOI] [PMC free article] [PubMed] [Google Scholar]
- 21.Chin PL, Momand J, Pfeifer GP. In vivo evidence for binding of p53 to consensus binding sites in the p21 and GADD45 genes in response to ionizing radiation. Oncogene. 1997;15:87–99. doi: 10.1038/sj.onc.1201161. [DOI] [PubMed] [Google Scholar]
- 22.O’Hagan HM, Ljungman M. Phosphorylation and nuclear accumulation are distinct events contributing to the activation of p53. Mutat Res. 2004;546:7–15. doi: 10.1016/j.mrfmmm.2003.10.003. [DOI] [PubMed] [Google Scholar]
- 23.Angeloni SV, Martin MB, Garcia-Morales P, Castro-Galache MD, Ferragut JA, Saceda M. Regulation of estrogen receptor-alpha expression by the tumor suppressor gene p53 in MCF-7 cells. J Endocrinol. 2004;180:497–504. doi: 10.1677/joe.0.1800497. [DOI] [PubMed] [Google Scholar]
- 24.An W, Kim J, Roeder RG. Ordered cooperative functions of PRMT1, p300, and CARM1 in transcriptional activation by p53. Cell. 2004;117:735–48. doi: 10.1016/j.cell.2004.05.009. [DOI] [PubMed] [Google Scholar]
- 25.Kastan MB, Onyekwere O, Sidransky D, Vogelstein B, Craig RW. Participation of p53 protein in the cellular response to DNA damage. Cancer Res. 1991;51:6304–11. [PubMed] [Google Scholar]
- 26.Pawlik TM, Keyomarsi K. Role of cell cycle in mediating sensitivity to radiotherapy. Int J Radiat Oncol Biol Phys. 2004;59:928–42. doi: 10.1016/j.ijrobp.2004.03.005. [DOI] [PubMed] [Google Scholar]
- 27.Espinosa JM, Emerson BM. Transcriptional regulation by p53 through intrinsic DNA/chromatin binding and site-directed cofactor recruitment. Mol Cell. 2001;8:57–69. doi: 10.1016/s1097-2765(01)00283-0. [DOI] [PubMed] [Google Scholar]
- 28.Hurd C, Dinda S, Khattree N, Moudgil VK. Estrogen-dependent and independent activation of the P1 promoter of the p53 gene in transiently transfected breast cancer cells. Oncogene. 1999;18:1067–72. doi: 10.1038/sj.onc.1202398. [DOI] [PubMed] [Google Scholar]
- 29.Sayeed A, Konduri SD, Liu W, Bansal S, Li F, Das GM. Estrogen receptor alpha inhibits p53-mediated transcriptional repression: implications for the regulation of apoptosis. Cancer Res. 2007;67:7746–55. doi: 10.1158/0008-5472.CAN-06-3724. [DOI] [PubMed] [Google Scholar]
- 30.Yu CL, Driggers P, Barrera-Hernandez G, Nunez SB, Segars JH, Cheng S. The tumor suppressor p53 is a negative regulator of estrogen receptor signaling pathways. Biochem Biophys Res Commun. 1997;239:617–20. doi: 10.1006/bbrc.1997.7522. [DOI] [PubMed] [Google Scholar]
- 31.Becker KA, Lu S, Dickinson ES, et al. Estrogen and progesterone regulate radiation-induced p53 activity in mammary epithelium through TGF-beta-dependent pathways. Oncogene. 2005;24:6345–53. doi: 10.1038/sj.onc.1208787. [DOI] [PubMed] [Google Scholar]
- 32.Kuperwasser C, Pinkas J, Hurlbut GD, Naber SP, Jerry DJ. Cytoplasmic sequestration and functional repression of p53 in the mammary epithelium is reversed by hormonal treatment. Cancer Res. 2000;60:2723–9. [PubMed] [Google Scholar]
- 33.Sivaraman L, Conneely OM, Medina D, O’Malley BW. p53 is a potential mediator of pregnancy and hormone-induced resistance to mammary carcinogenesis. Proc Natl Acad Sci U S A. 2001;98:12379–84. doi: 10.1073/pnas.221459098. [DOI] [PMC free article] [PubMed] [Google Scholar]
- 34.Levine AJ. p53, the cellular gatekeeper for growth and division. Cell. 1997;88:323–31. doi: 10.1016/s0092-8674(00)81871-1. [DOI] [PubMed] [Google Scholar]
- 35.Rozan LM, El-Deiry WS. p53 downstream target genes and tumor suppression: a classical view in evolution. Cell Death Differ. 2007;14:3–9. doi: 10.1038/sj.cdd.4402058. [DOI] [PubMed] [Google Scholar]
- 36.Deb SP, Munoz RM, Brown DR, Subler MA, Deb S. Wild-type human p53 activates the human epidermal growth factor receptor promoter. Oncogene. 1994;9:1341–9. [PubMed] [Google Scholar]
- 37.Shin TH, Paterson AJ, Kudlow JE. p53 stimulates transcription from the human transforming growth factor alpha promoter: a potential growth-stimulatory role for p53. Mol Cell Biol. 1995;15:4694–701. doi: 10.1128/mcb.15.9.4694. [DOI] [PMC free article] [PubMed] [Google Scholar]
- 38.Han JA, Kim JI, Ongusaha PP, et al. P53-mediated induction of Cox-2 counteracts p53- or genotoxic stress-induced apoptosis. Embo J. 2002;21:5635–44. doi: 10.1093/emboj/cdf591. [DOI] [PMC free article] [PubMed] [Google Scholar]
- 39.Menendez D, Inga A, Snipe J, Krysiak O, Schonfelder G, Resnick MA. A single-nucleotide polymorphism in a half-binding site creates p53 and estrogen receptor control of vascular endothelial growth factor receptor 1. Mol Cell Biol. 2007;27:2590–600. doi: 10.1128/MCB.01742-06. [DOI] [PMC free article] [PubMed] [Google Scholar]
- 40.deGraffenried LA, Hilsenbeck SG, Fuqua SA. Sp1 is essential for estrogen receptor alpha gene transcription. J Steroid Biochem Mol Biol. 2002;82:7–18. doi: 10.1016/s0960-0760(02)00151-6. [DOI] [PubMed] [Google Scholar]
- 41.Eeckhoute J, Keeton EK, Lupien M, Krum SA, Carroll JS, Brown M. Positive cross-regulatory loop ties GATA-3 to estrogen receptor alpha expression in breast cancer. Cancer Res. 2007;67:6477–83. doi: 10.1158/0008-5472.CAN-07-0746. [DOI] [PubMed] [Google Scholar]
- 42.Weigel RJ, Crooks DL, Iglehart JD, deConinck EC. Quantitative analysis of the transcriptional start sites of estrogen receptor in breast carcinoma. Cell Growth Differ. 1995;6:707–11. [PubMed] [Google Scholar]
- 43.Grandien K, Backdahl M, Ljunggren O, Gustafsson JA, Berkenstam A. Estrogen target tissue determines alternative promoter utilization of the human estrogen receptor gene in osteoblasts and tumor cell lines. Endocrinology. 1995;136:2223–9. doi: 10.1210/endo.136.5.7720671. [DOI] [PubMed] [Google Scholar]
- 44.Ricketts D, Turnbull L, Ryall G, et al. Estrogen and progesterone receptors in the normal female breast. Cancer Res. 1991;51:1817–22. [PubMed] [Google Scholar]
- 45.Antman KH, Rowlings PA, Vaughan WP, et al. High-dose chemotherapy with autologous hematopoietic stem-cell support for breast cancer in North America. J Clin Oncol. 1997;15:1870–9. doi: 10.1200/JCO.1997.15.5.1870. [DOI] [PubMed] [Google Scholar]
- 46.Li W, Xiao C, Vonderhaar BK, Deng CX. A role of estrogen/ERalpha signaling in BRCA1-associated tissue-specific tumor formation. Oncogene. 2007;26:7204–12. doi: 10.1038/sj.onc.1210527. [DOI] [PubMed] [Google Scholar]
- 47.Xu X, Wagner KU, Larson D, et al. Conditional mutation of Brca1 in mammary epithelial cells results in blunted ductal morphogenesis and tumour formation. Nat Gnet. 1999;22:37–43. doi: 10.1038/8743. [DOI] [PubMed] [Google Scholar]
- 48.Gasco M, Yulug IG, Crook T. TP53 mutations in familial breast cancer: functional aspects. Hum Mutat. 2003;21:301–6. doi: 10.1002/humu.10173. [DOI] [PubMed] [Google Scholar]
- 49.Kos M, Reid G, Denger S, Gannon F. Minireview: genomic organization of the human ERalpha gene promoter region. Mol Endocrinol. 2001;15:2057–63. doi: 10.1210/mend.15.12.0731. [DOI] [PubMed] [Google Scholar]
Associated Data
This section collects any data citations, data availability statements, or supplementary materials included in this article.