

Abstract
CLC proteins transport Cl− ions across cell membranes to control the electrical potential of muscle cells, transfer electrolytes across epithelia, and control the pH and electrolyte composition of intracellular organelles. Some members of this protein family are Cl− ion channels, while others are secondary active transporters that exchange Cl− ions and H+ with a 2:1 stoichiometry. We have determined the structure of a eukaryotic CLC transporter at 3.5 Å resolution. Cytoplasmic CBS domains are strategically positioned to regulate the ion transport pathway, and many disease-causing mutations in human CLCs reside on the CBS-transmembrane interface. Comparison with prokaryotic CLC shows that a gating glutamate changes conformation and suggests a basis for 2:1 Cl−/H+ exchange and a simple mechanistic connection between CLC channels and transporters.
CLC proteins form a large family of membrane proteins that transfer chloride ions across cell membranes. Present in all kingdoms of life, existing in both surface and intracellular membranes, CLCs mediate a wide range of physiological processes (1-2). In muscle they govern resting membrane potential, in kidney they facilitate transepithelial fluid flow, and in intracellular compartments they control pH through coupled Cl−/H+ exchange (2-5). Mutations of CLC proteins underlie numerous inherited diseases including myotonia congenita, Bartter’s syndrome, Dent’s disease, osteopetrosis, retinal degeneration and lysosome storage diseases (2,5).
CLCs are divisible into two subgroups, Cl− channels and secondary active transporters (6). The channels catalyze passive diffusion down the Cl− electrochemical gradient, while the transporters (Cl−/H+ exchangers) actively couple Cl− movement in one direction to H+ movement in the opposite direction (6-10). Thus, in the transporters ‘downhill’ movement of one ion can drive ‘uphill’ movement of the other. Even though channels and transporters catalyze energetically different reactions, conservation of specific amino acids informs us that these functionally distinct CLC subgroups must share the same basic architecture (11-13).
CLC proteins are homodimers with a separate ion pathway within each subunit (14, 15). The two pathways act largely independently, but in some channels cooperate to turn on and off simultaneously (16). Each subunit of the dimer consists of a transmembrane component, which forms the ion pathway, and in eukaryotic CLCs a cytosolic cystathionine beta-synthase (CBS) domain component, which affects membrane localization and regulates the transmembrane component (17-22).
Crystal structures of two closely related prokaryotic CLC transporter proteins have been determined (15,23). These have defined the protein architecture within the membrane, including Cl− binding sites along the ion transport pathway, but they have not yet provided a clear mechanism for Cl−/H+ exchange, an explanation for the exchange stoichiometry of 2 Cl− ions for 1 H+, or a plausible hypothesis for understanding how CLCs can encode both channels and secondary active transporters. Moreover, the prokaryotic transporters of known structure do not contain the CBS domains found in all eukaryotic CLCs (2). The many disease-causing mutations discovered within the CBS domains and the effects of site-directed mutations will gain a more mechanistic interpretation in light of a eukaryotic CLC structure (2, 21, 24-28).
CmCLC is a Cl−/H+ exchange transporter
To overcome the instability of eukaryotic CLC’s we took an approach similar to the study of prokaryotic voltage-dependent K+ channels (29), and identified CmCLC from a thermophilic red alga Cyanidioschyzon merolae (30) (fig. S1), which migrated as a monodisperse peak on a size-exclusion column. On the basis of limited proteolysis a final construct excluding 86 N-terminal and 7 C-terminal amino acids was expressed in Trichoplusia ni insect cells and purified for functional and crystallographic studies.
CmCLC was reconstituted into lipid vesicles and studied initially with a fluorescence assay (31) (Fig. 1A). Vesicles loaded with 450 mM KCl (pH 7.4) were diluted 20-fold into an assay buffer containing 450 mM K+ Gluconate (pH 7.5). Under these conditions, if CmCLC is a Cl−/H+ exchanger, Cl− efflux will drive H+ influx against its concentration gradient and cause quenching of the fluorophore 9-amino-6-chloro-2-methoxyacridine (ACMA). This reaction is initiated by addition of the K+ selective ionophore valinomycin, which collapses the electrical gradient built up by an electrogenic transporter. On the other hand, if CmCLC is a Cl− channel, H+ transport and thus a fluorescence change should not be observed. We first validated this assay with a known Cl−/H+ exchanger, EcCLC (7). The robust fluorescence decrease observed upon addition of valinomycin reflects H+ influx into the vesicles driven by Cl− efflux (Fig. 1B). Control experiments with ‘empty’ vesicles and vesicles containing EcCLCs with a mutation of the “gating glutamate” (E148A), which are known to transport Cl− without H+ exchange activity, showed little fluorescence change (Fig. 1B). However, in assays with vesicles containing CmCLC a clear fluorescence reduction was observed (Fig. 1C). When the gating glutamate of CmCLC was mutated (E210A) the fluorescence signal was minimized (Fig. 1C). Thus CmCLC is a secondary active transporter and Cl−/H+ exchange depends on the presence of the gating glutamate.
Fig. 1. Analysis of CmCLC transport activity.
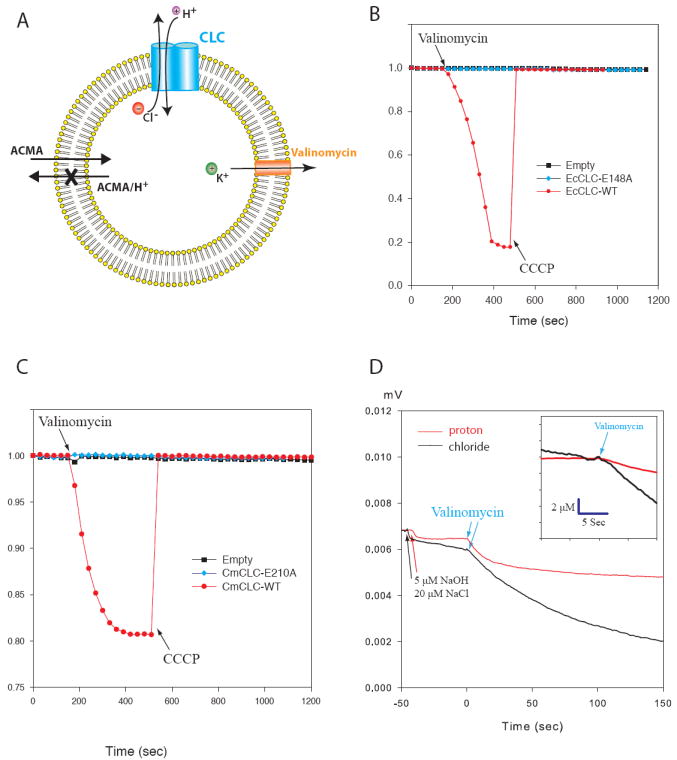
(A) Depiction of the fluorescent-based flux assay. Vesicles (yellow) were loaded with high concentration of KCl and then diluted into the flux buffer with a low concentration of Cl− and ACMA. Flux was initiated by addition of valinomycin. (B) Fluorescence changes for wild type (red) and E148A mutant (blue) EcCLCs compared to empty (black) vesicles. (C) Fluorescence changes for wild type (red), E210A mutant (blue) CmCLCs and empty vesicles (black). (D) Recordings of pH (red) and [Cl−] over time in response to addition of valinomycin to a solution of Cl− loaded vesicles. Electrode response was calibrated by addition of 5 μM NaOH and 20 μM NaCl before each experiment. The initial rates of Cl− efflux and H+ influx provide an estimate of the exchange ratio (inset).
The exchange stoichiometry in EcCLC and other CLC transporters was shown to be 2 Cl− ions to 1 H+ (7, 9, 10, 32, 33). To estimate the exchange stoichiometry in CmCLC we directly measured the Cl− concentration change and pH change in a flux assay developed by Miller and colleagues for EcCLC (6). The initial rate of Cl− increase and H+ decrease upon valinomycin addition were determined in parallel under identical conditions. From the initial rates, the average Cl−/H+ flux ratio for CmCLC is 2.25 ± 0.22 (Fig. 1D).
Structure determination
CmCLC was crystallized in space group C2 with two copies of the CmCLC dimer in each asymmetric unit. The crystals were grown in the presence of 150 mM Cl− and diffracted x-rays to 3.5 Å resolution (fig. S2). The experimental phases were derived from single and multi-wavelength diffraction experiments on selenomethionine-containing crystals (Table S1). The initial experimental map after solvent flattening allowed tracing of most of the main-chain. After several rounds of model rebuilding and refinement most of the transmembrane component and part of the CBS component could be built with the aid of 16 selenomethionine markers. Remaining segments were built initially as poly-alanine chains. To improve the model 30 amino acids throughout the protein were replaced with methionine in 20 CmCLC mutants and crystallized with selenomethionine labels. Anomalous difference analysis using the selenium edge identified 24 out of 30 mutation sites to aid model building (Fig. 2A). Native plus mutant methionines provided one or more selenomethionine markers on almost every helix and strand and on some loops (Fig. 2A). This extensive labeling, by establishing the register and allowing the building of most of the side chains, improved the accuracy and completeness of the model, which is refined to Rwork/Rfree=0.259/0.284 (Table S1).
Fig. 2. Structure of CmCLC.

(A) Selenium sites identified by SAD. Wire representation of a CmCLC monomer is shown in blue. The selenium sites of the selenomethionine-labeled wild type protein are shown as green spheres and those corresponding to “marker mutants” are colored in red. (B) and (C) Ribbon representation of a CmCLC dimer from the side of the membrane with extracellular solution above. Two subunits are colored in blue and red, respectively.
Molecular architecture
Each monomer of the CmCLC dimer contains 23 α-helices and 5 β-strands (Fig. 2, B and C, Fig. 3A and fig. S1). The transmembrane (TM) monomer of CmCLC has an antiparallel architecture similar to that of EcCLC (15) (fig. S3A). The cytoplasmic CBS domains share the fold characteristics of other CBS containing proteins (34) (fig. S3B). Two CBS subdomains on each subunit (CBS1 and CBS2) are related by a pseudo two fold symmetry axis and are tightly packed against each other through β-sheets (Fig. 3A and 3B). A long and ordered linker following the last transmembrane helix, αR, makes sharp turns, crosses over CBS2 and reaches CBS1 (Fig. 3B). This arrangement brings CBS2 in close proximity to the TM and places CBS1 further away from the membrane. As a result, the C-terminal end of the protein is positioned closest to the membrane.
Fig. 3. Structure of CmCLC subunit.

(A) Stereo view of a CmCLC subunit from the side of the membrane with extracellular solution above. (B) Surface representation of a CmCLC subunit. The transmembrane domain (TM) is colored in grey, CBS1 sub-domain in pale blue and CBS2 in blue. The linker between transmembrane domain and the CBS core is shown as cords in yellow.
The two subunits in the CmCLC dimer are related by a dyad perpendicular to the membrane and share an extensive interface, 3200Å2 in the TM components and 1830Å2 in the CBS domain components (Fig. 2B). The CBS interface is similar to that observed in the isolated domain structures from CLC-5 and CLC-Ka and is consistent with extensive mutagenesis studies on other members of the CLC family (21, 22, 34, 35).
Although CmCLC and EcCLC have modest sequence identity (<25%), the structure of the CmCLC TM superimposes well onto EcCLC with a main-chain root mean square deviation (RMSD) of 1.7 Å over a range of 366 aligned residues (fig. S3A and fig. S4A). Helices forming the dimer interface superimpose best (1.2 Å main chain RMSD for αH, αI, αP, αQ) while helices on the perimeter furthest from the interface, particularly αJ and αK, superimpose worst (3.2 Å main chain RMSD for αK and the C-terminal half of αJ and αM) (fig. S4, B and C). The larger deviations on the perimeter are due mainly to differences in the tilt angle of the helices. At present we do not know whether these deviations reflect a true structural difference of equivalent conformational states or different conformations.
Interface between the TM and the CBS
In some membrane proteins, for example eukaryotic voltage-dependent channels of the Kv1 class, regulatory or structural domains in the cytoplasm are loosely attached to the TM component through extended polypeptide chains (36). By contrast, in CmCLC we observe an extensive protein-protein interface burying 3600Å2 between the CBS and TM components. The shape complementarity index is 0.69, similar to an antibody-antigen interface (37). This area and complementarity index suggest a highly specific interaction.
Three structural features of the interface seem relevant to the role of the CBS domains in regulating TM function. First, the polypeptide linker between the TM and CBS not only connects the two together, but also makes multiple contacts with TM helix αR (Fig. 4A). Helix αR extends into the ion pathway and holds Y515 in place to form part of the central Cl− binding site (23, 38, 39). Second, the CBS domain contacts helix αD, which also extends into the ion pathway and contains another important amino acid, S165, which is involved in Cl− ion coordination and selectivity (23, 32, 33, 40, 41) (Fig. 4A). This explains how conformational changes within the CBS domains could be transmitted directly to the ion pathway of the TM domain (fig. S6). Third, the loop connecting αH to αI, which forms the TM dimer interface, comes in direct contact with the CBS domains (fig. S5, A and B). This raises the possibility that the CBS domains could influence cooperative interactions between the two TM components (42).
Fig. 4. The TM-CBS interface.

(A) A CmCLC subunit highlighting the TM and CBS interface. The CBS is shown in cyan and the TM as grey ribbons with helices αR and αD highlighted in red. Ser165 and Tyr515 are shown as sticks. Top shows the stereo view of the zoomed-in boxed area below. (B) Mutations on the TM-CBS interface. Mutations of hCLC-1, CLC-0 and CLC-7 are mapped on the structure through sequence alignment (fig. S1) and shown as spheres. There are four groups: hCLC-1 and CLC-0 mutations in the CBS domain that affect common gating (H835R in hCLC-1, H736A and E763K in CLC-0; colored in green); dominant Thomsens’ disease mutations in the intracelluar loops of the hCLC-1 TM (G200R, F297S, R300Q; colored in red); dominant osteopetrosis mutations in the hCLC-7 CBS domains (F758L, R762L, G765B, R767W, A788D; colored in yellow); dominant osteopetrosis mutations in the loops of the hCLC-7 TM (G215R, L213F, F318L; colored in pink).
Several disease-causing mutations in human CLCs localize to the TM-CBS interface (Fig. 4B). Studies have shown that H835R mutations in hCLC-1 and H736A and E763K in the ortholog CLC-0 alter the “common gating” process that affects both subunits in concert (25). These amino acids localize to the surface of the CBS that faces the TM (Fig. 4B, green spheres). Several hCLC-1 mutations that underlie Thomsen’s disease exist on the TM dimer interface (42, 43). We find that several other mutations causing this disease exist on the TM-CBS interface (Fig. 4B). More than 30 osteopetrosis related mutations have been identified in a Cl−/ H+ exchanger hCLC-7 (2). We note that while mutations involved in recessive osteopetrosis tend to be spread throughout the structure (44), most dominant mutations are located on the TM-CBS interface (44-47) (Fig. 4B, yellow and pink spheres). It appears that altering communication between CBS and TM domains may be a common mechanism underlying many CLC related diseases.
Truncations of the hCLC-1 C-terminus affect gating of the channel (48, 49) and several disease-causing mutations are known to occur in this region. Because CLCs vary in the length of the unstructured C-terminus following CBS2, the importance of this region to channel function was puzzling. The crystal structure offers a possible explanation; the C-terminus is in close proximity to the TM and participates in the TM-CBS interface (Fig. 3A and Fig. 4A). It could be that the C-terminal peptide affects transport function through its interaction with helix αR or other regions of the TM component.
Ion transport pathway
The Cl− transport pathway of CmCLC is shaped like an hourglass with aqueous vestibules on the extracellular and intracellular surfaces leading up to a narrow segment (Fig. 5A, blue mesh). In between the vestibules the transport pathway narrows into a “selectivity filter” or “transport region” where ions become dehydrated as they cross the membrane. The α-helices αN, αF and αD are oriented with their N-termini pointed toward the transport region, making available amide nitrogen atoms for anion coordination. Overall, the transport region of CmCLC is very similar to that of EcCLC with respect to the positioning of the oriented α-helices and the locations of Y515 and S165, residues known to play an important role in Cl− transport (23, 32, 33, 38, 40).
Fig. 5. Ion Transport pathway.

(A) Stereoview of the ion transport pathway viewed from the dimer interface. The protein is shown as a blue ribbon with selected residues Ser165, Glu210 and Try515 shown as sticks. Aqueous cavities connecting to the Cl− binding sites from the extracellular (out) and the intracellular (in) solutions are shown as cyan meshes. The Cl− ions are shown as pink spheres. (B) Stereoview of the electron density map around the ion transport pathway. Weighted 2fo-fc electron density at 3.5 Å, contoured at 1.35σ is colored in cyan. The refined model is shown as sticks. A bromine anomalous difference Fourier map at 4.2 Å from crystals grown in Br− is contoured at 9σ (red). (C) Stereoview of the ion transport pathway. Possible hydrogen bonds between Cl− ions (pink spheres) and protein are shown as dashed lines. Also shown as dashed lines are the possible hydrogen bonds between Glu210 and Try515.
One significant difference exists between the transport regions of CmCLC and EcCLC. In EcCLC three Cl− ion binding sites were identified: Sext, Scen, and Sint, from the extracellular to the intracellular side (23). In a mutant of EcCLC in which the “gating glutamate” E148 (corresponding to E210 in CmCLC) was mutated to a glutamine, the Cl− analog Br− occupied all three sites in difference Fourier maps and the glutamine side-chain was located in the extracellular solution, directed away from the transport region (23) (Fig 6A). In wild-type EcCLC the gating glutamate was bound to the outermost site, Sext, and Br- was excluded from that position (23) (Fig 6A). Thus the gating glutamate appeared to compete with the halogen anion for the extracellular site. In CmCLC a new conformation is observed. The gating glutamate occupies the central site and Br− as demonstrated in an anomalous difference Fourier experiment occupies Sext and Sint (Fig. 5, A and B). This new conformation is achieved mainly through a reorientation of the gating glutamate side-chain. The carboxylate group in the central site interacts with the same hydrogen bond donor groups that interact with the halogen anion at that site in the other structures (Fig. 5C).
Fig. 6. A working model for the ion transport.

(A) Close up view of the ion transport pathway of wild type CmCLC, wild type EcCLC and the E148Q mutant of EcCLC respectively. The foreground helices were removed for clarity. Selected residues are shown as sticks and Cl− as pink spheres. For CmCLC, a bromine anomalous difference Fourier map contoured at 6σ is shown as purple meshes. (B) A proposed working model for ion transport in CLC transporters. Residues corresponding to Ser165, Glu210 and Tyr515 in CmCLC are shown as schematic drawings. Red spheres represent Cl− ions and purple spheres protons. The negative charge on the carboxyl group of the deprotonated Glu210 is shown as a dashed circle. (a), (b), (c), (d), (e) and (f) are six major steps in a transport cycle as described in the text. In the middle of the circle, the cartoon shows the positions that Cl− and the carboxyl group of the gating glutamate could occupy.
Two amino acids are known to affect the movement of H+ through CLC transporters, the externally located gating glutamate and an internally located “proton glutamate”, E203 in EcCLC (7, 50). In EcCLC mutations at either position can abolish coupled H+ movement and convert the transporter into a Cl− channel with a small conductance (7, 50, 51, 52). In CmCLC a threonine (T269) is found at the proton glutamate position. We note that the side-chain hydroxyl (Oγ) of T269 is only 7.5 Å away from the carboxylate (Oε) of E210. Either this threonine is able to perform the H+ transfer between the intracellular solution and the transport region in CmCLC, or alternatively a different amino acid serves this role.
Hypothesis for the mechanism of 2 Cl− 1 H+ counter-transport
Together with the prokaryotic structures, three are now available (15)(23) (Fig. 6A). Although these structures were obtained with two different transporters and a mutant, they likely represent conformations that can occur in the transport cycle. From these structures we put forth a hypothesis for the transport mechanism that accounts for the counter-transport of 2 Cl− ions against 1 H+ (Fig. 6B). States (a) and (b) represent unprotonated and protonated forms of the conformation observed in CmCLC (Fig. 6A, left), states (d) and (e) represent protonated and unprotonated forms of the conformation observed in the mutant EcCLC-E148Q (Fig. 6A, right) (23), and state (f) represents the conformation observed in wild-type EcCLC (Fig. 6A, middle) (15). From state (a) to state (b) a H+ is transferred from the intracellular solution to the carboxylate of the gating glutamate. The protonated carboxylate changes its conformation to the extracellular solution [state (c)] and two Cl− ions enter the transport region from the external side [state (d)]. Once the H+ dissociates from the carboxylate to the extracellular solution [state (e)] the carboxylate can enter Sext [state (f)] and then Scen [state (a)], in association with the movement of two Cl− ions to the intracellular side. In Scen the glutamate is again in position to receive a H from the intracellular solution. Every transition in this cycle is reversible. Net cycling can only result from the dissipation of a Cl− or H+ electrochemical gradient. This cycle as described will give rise to an exchange stoichiometry of 2 Cl− ions for 1 H+.
There are two apparent problems with the cycle as described: first, in the (c) to (d) transition two Cl− ions must enter from the extracellular solution or else stoichiometric coupling and active transport will be lost, and second, (d) and (e) are “forbidden” states for a transporter because Cl− can move uncoupled to H+. Both of these problems can be overcome with one assumption, that there exists a relatively large kinetic barrier to the rapid movement of Cl− ions between Sint and Scen. This barrier would insure that Cl− ions would more likely fill Scen and Sext from the extracellular solution. In fact, if the barriers between the transport region and the extracellular solution are small then state (c) will exist only transiently. A sufficiently large barrier between Sint and Scen would also permit the existence of “forbidden” states (d) and (e) without significant loss of coupled exchange. This conclusion can be understood through a simple kinetic argument. If the transition from (d) to (e) is determined by the lifetime of the protonated carboxylate in the extracellular solution then we expect a duration of approximately 10-6 sec if the pKa is 4.0 and we assume a H+ association rate of 1010 M-1sec-1 (53). Therefore, if the barrier were high enough to limit the Cl− conduction rate through states (d) and (e) to 104 sec-1, then on average only one Cl− every hundred cycles would slip through state (d) uncoupled to H+ movement. If the transition from (e) to (f) were then rapid, little uncoupled slippage will occur during the cycle. In the EcCLC-E148Q mutant, representing a transporter caught permanently in states (d) and (e), the Cl− conduction rate was determined to be significantly less than 104 sec-1 (51). We would suggest that the slow intrinsic Cl− conductivity of mutated CLC transporters that function as channels (such as the EcCLC-E148Q mutant) results from a kinetic barrier to Cl− that is an important aspect of the Cl−/H+ coupled exchange mechanism.
Kinetic simulations corroborate the explanations above (Movie S1). Simulations of the cycle, allowing Cl− entry and exit from either side of the membrane during the transitions connecting states (c) and (d) and allowing Cl− conduction across the membrane through states (d) and (e), generate the experimentally observed properties of CLC exchangers: Cl− gradients produce “uphill” H+ transport, H+ gradients produce “uphill” Cl− transport, and a coupling ratio of 2 Cl− ions against 1 H+ is generated over conditions of membrane voltage, electrolyte and pH under which CLC exchangers have been studied (7, 9, 10, 32, 33). Moreover, an adjustment of the rate at which Cl− ions conduct through states (d) and (e) produces a loss of coupling and converts the CLC exchanger into a gated Cl− ion channel.
The cycle also explains other more subtle features of CLC proteins. Certain mutations produce partial uncoupling (Cl−/H+ exchange ratios greater than 2) rather than complete uncoupling (39). This observation is explicable if different mutations cause different rates of Cl− conduction through states (d) and (e) or if they alter the interaction between the gating glutamate and the pore (Fig. 6B). Lowering external pH produces uncoupling in CLC-3 (54). This outcome is expected if, due to a high extracellular H+ concentration, the transition rate from state (e) to state (d) becomes much greater than that from state (e) to state (f) (Fig. 6B). Finally, CLC proteins that function as channels exhibit pH-dependent gating (16). The cycle predicts that these channels may still mediate coupled exchange on a microscopic level that is hidden beneath uncoupled Cl− conduction (55).
There may exist undiscovered conformational states of CLC transporters. Still, the proposed mechanism of secondary active transport that we are proposing, although distinct from the classical alternating access model (56), is plausible because it accounts for experimental observations. It invokes a Cl− channel with a barrier to slow the throughput, and a glutamate gate that can swing into the channel and be protonated from either side of the membrane. This mechanism explains why the CLC protein structure gives rise to both transporters and channels.
Supplementary Material
Acknowledgments
We thank the staff at beamline X29 (NSLS, Brookhaven National Laboratory) and K. R. Rajashankar and K. Perry at beamline 24ID-C (APS, Argonne National Laboratory) for assistance at the synchrotron; members of the MacKinnon laboratory for helpful dicussions; and P. Yuan for comments on the manuscript. R.M. is an Investigator in the Howard Hughes Medical Institute. The X-ray crystallographic coordinates and structure factors have been deposited in the Protein Data Bank with accession ID 3ORG.
Footnotes
References and Notes
- 1.Maduke M, Miller C, Mindell JA. Annu Rev Biophys Biomol Struct. 2000;29:411. doi: 10.1146/annurev.biophys.29.1.411. [DOI] [PubMed] [Google Scholar]
- 2.Jentsch TJ. Crit Rev Biochem Mol Biol. 2008;43:3. doi: 10.1080/10409230701829110. [DOI] [PubMed] [Google Scholar]
- 3.Steinmeyer K, Schwappach B, Bens M, Vandewalle A, Jentsch TJ. J Biol Chem. 1995;270:31172. doi: 10.1074/jbc.270.52.31172. [DOI] [PubMed] [Google Scholar]
- 4.Weinert S, et al. Science. 2010;328:1401. doi: 10.1126/science.1188072. [DOI] [PubMed] [Google Scholar]
- 5.Zifarelli G, Pusch M. Rev Physiol Biochem Pharmacol. 2007;158:23. doi: 10.1007/112_2006_0605. [DOI] [PubMed] [Google Scholar]
- 6.Miller C, Nguitragool W. Philos Trans R Soc Lond B Biol Sci. 2009;364:175. doi: 10.1098/rstb.2008.0138. [DOI] [PMC free article] [PubMed] [Google Scholar]
- 7.Accardi A, Miller C. Nature. 2004;427:803. doi: 10.1038/nature02314. [DOI] [PubMed] [Google Scholar]
- 8.Picollo A, Pusch M. Nature. 2005;436:420. doi: 10.1038/nature03720. [DOI] [PubMed] [Google Scholar]
- 9.Scheel O, Zdebik AA, Lourdel S, Jentsch TJ. Nature. 2005;436:424. doi: 10.1038/nature03860. [DOI] [PubMed] [Google Scholar]
- 10.Graves AR, Curran PK, Smith CL, Mindell JA. Nature. 2008;453:788. doi: 10.1038/nature06907. [DOI] [PubMed] [Google Scholar]
- 11.Chen MF, Chen TY. J Gen Physiol. 2003;122:133. doi: 10.1085/jgp.200308844. [DOI] [PMC free article] [PubMed] [Google Scholar]
- 12.Estevez R, Schroeder BC, Accardi A, Jentsch TJ, Pusch M. Neuron. 2003;38:47. doi: 10.1016/s0896-6273(03)00168-5. [DOI] [PubMed] [Google Scholar]
- 13.Engh AM, Maduke M. J Gen Physiol. 2005;125:601. doi: 10.1085/jgp.200509258. [DOI] [PMC free article] [PubMed] [Google Scholar]
- 14.Miller C, White MM. Proc Natl Acad Sci U S A. 1984;81:2772. doi: 10.1073/pnas.81.9.2772. [DOI] [PMC free article] [PubMed] [Google Scholar]
- 15.Dutzler R, Campbell EB, Cadene M, Chait BT, MacKinnon R. Nature. 2002;415:287. doi: 10.1038/415287a. [DOI] [PubMed] [Google Scholar]
- 16.Chen TY, Hwang TC. Physiol Rev. 2008;88:351. doi: 10.1152/physrev.00058.2006. [DOI] [PubMed] [Google Scholar]
- 17.Schmidt-Rose T, Jentsch TJ. J Biol Chem. 1997;272:20515. doi: 10.1074/jbc.272.33.20515. [DOI] [PubMed] [Google Scholar]
- 18.Maduke M, Williams C, Miller C. Biochemistry. 1998;37:1315. doi: 10.1021/bi972418o. [DOI] [PubMed] [Google Scholar]
- 19.Hebeisen S, et al. J Biol Chem. 2004;279:13140. doi: 10.1074/jbc.M312649200. [DOI] [PubMed] [Google Scholar]
- 20.Garcia-Olivares J, et al. J Physiol. 2008;586:5325. doi: 10.1113/jphysiol.2008.158097. [DOI] [PMC free article] [PubMed] [Google Scholar]
- 21.Bennetts B, et al. J Biol Chem. 2005;280:32452. doi: 10.1074/jbc.M502890200. [DOI] [PubMed] [Google Scholar]
- 22.Meyer S, Savaresi S, Forster IC, Dutzler R. Nat Struct Mol Biol. 2007;14:60. doi: 10.1038/nsmb1188. [DOI] [PubMed] [Google Scholar]
- 23.Dutzler R, Campbell EB, MacKinnon R. Science. 2003;300:108. doi: 10.1126/science.1082708. [DOI] [PubMed] [Google Scholar]
- 24.Pusch M. Hum Mutat. 2002;19:423. doi: 10.1002/humu.10063. [DOI] [PubMed] [Google Scholar]
- 25.Estevez R, Pusch M, Ferrer-Costa C, Orozco M, Jentsch TJ. J Physiol. 2004;557:363. doi: 10.1113/jphysiol.2003.058453. [DOI] [PMC free article] [PubMed] [Google Scholar]
- 26.Kornak U, Ostertag A, Branger S, Benichou O, de Vernejoul MC. J Clin Endocrinol Metab. 2006;91:995. doi: 10.1210/jc.2005-2017. [DOI] [PubMed] [Google Scholar]
- 27.Lloyd SE, et al. Nature. 1996;379:445. doi: 10.1038/379445a0. [DOI] [PubMed] [Google Scholar]
- 28.Dave S, Sheehan JH, Meiler J, Strange K. Channels (Austin) 2010;4 doi: 10.4161/chan.4.4.12445. [DOI] [PMC free article] [PubMed] [Google Scholar]
- 29.Jiang Y, et al. Nature. 2003;423:33. doi: 10.1038/nature01580. [DOI] [PubMed] [Google Scholar]
- 30.Matsuzaki M, et al. Nature. 2004;428:653. doi: 10.1038/nature02398. [DOI] [PubMed] [Google Scholar]
- 31.Zhang J, Feng Y, Forgac M. J Biol Chem. 1994;269:23518. [PubMed] [Google Scholar]
- 32.De Angeli A, et al. Nature. 2006;442:939. doi: 10.1038/nature05013. [DOI] [PubMed] [Google Scholar]
- 33.Zifarelli G, Pusch M. EMBO J. 2009;28:175. doi: 10.1038/emboj.2008.284. [DOI] [PMC free article] [PubMed] [Google Scholar]
- 34.Markovic S, Dutzler R. Structure. 2007;15:715. doi: 10.1016/j.str.2007.04.013. [DOI] [PubMed] [Google Scholar]
- 35.Accardi A, Picollo A. Biochim Biophys Acta. 2010;1798:1457. doi: 10.1016/j.bbamem.2010.02.022. [DOI] [PMC free article] [PubMed] [Google Scholar]
- 36.Long SB, Tao X, Campbell EB, MacKinnon R. Nature. 2007;450:376. doi: 10.1038/nature06265. [DOI] [PubMed] [Google Scholar]
- 37.Lawrence MC, Colman PM. J Mol Biol. 1993;234:946. doi: 10.1006/jmbi.1993.1648. [DOI] [PubMed] [Google Scholar]
- 38.Accardi A, Lobet S, Williams C, Miller C, Dutzler R. J Mol Biol. 2006;362:691. doi: 10.1016/j.jmb.2006.07.081. [DOI] [PubMed] [Google Scholar]
- 39.Walden M, et al. J Gen Physiol. 2007;129:317. doi: 10.1085/jgp.200709756. [DOI] [PMC free article] [PubMed] [Google Scholar]
- 40.Picollo A, Malvezzi M, Houtman JC, Accardi A. Nat Struct Mol Biol. 2009;16:1294. doi: 10.1038/nsmb.1704. [DOI] [PMC free article] [PubMed] [Google Scholar]
- 41.Bergsdorf EY, Zdebik AA, Jentsch TJ. J Biol Chem. 2009;284:11184. doi: 10.1074/jbc.M901170200. [DOI] [PMC free article] [PubMed] [Google Scholar]
- 42.Duffield M, Rychkov G, Bretag A, Roberts M. J Gen Physiol. 2003;121:149. doi: 10.1085/jgp.20028741. [DOI] [PMC free article] [PubMed] [Google Scholar]
- 43.Lossin C, George AL., Jr Adv Genet. 2008;63:25. doi: 10.1016/S0065-2660(08)01002-X. [DOI] [PubMed] [Google Scholar]
- 44.Pangrazio A, et al. Hum Mutat. 2010;31:E1071. doi: 10.1002/humu.21167. [DOI] [PubMed] [Google Scholar]
- 45.Cleiren E, et al. Hum Mol Genet. 2001;10:2861. doi: 10.1093/hmg/10.25.2861. [DOI] [PubMed] [Google Scholar]
- 46.Waguespack SG, et al. J Bone Miner Res. 2003;18:1513. doi: 10.1359/jbmr.2003.18.8.1513. [DOI] [PubMed] [Google Scholar]
- 47.Frattini A, et al. J Bone Miner Res. 2003;18:1740. doi: 10.1359/jbmr.2003.18.10.1740. [DOI] [PubMed] [Google Scholar]
- 48.Hryciw DH, Rychkov GY, Hughes BP, Bretag AH. J Biol Chem. 1998;273:4304. doi: 10.1074/jbc.273.8.4304. [DOI] [PubMed] [Google Scholar]
- 49.Hebeisen S, Fahlke C. Biophys J. 2005;89:1710. doi: 10.1529/biophysj.104.056093. [DOI] [PMC free article] [PubMed] [Google Scholar]
- 50.Accardi A, et al. J Gen Physiol. 2005;126:563. doi: 10.1085/jgp.200509417. [DOI] [PMC free article] [PubMed] [Google Scholar]
- 51.Jayaram H, Accardi A, Wu F, Williams C, Miller C. Proc Natl Acad Sci U S A. 2008;105:11194. doi: 10.1073/pnas.0804503105. [DOI] [PMC free article] [PubMed] [Google Scholar]
- 52.Lim HH, Miller C. J Gen Physiol. 2009;133:131. doi: 10.1085/jgp.200810112. [DOI] [PMC free article] [PubMed] [Google Scholar]
- 53.Jencks WP. Catalysis in Chemistry and Enzymology. 1987 [Google Scholar]
- 54.Matsuda JJ, Filali MS, Collins MM, Volk KA, Lamb FS. J Biol Chem. 2010;285:2569. doi: 10.1074/jbc.M109.018002. [DOI] [PMC free article] [PubMed] [Google Scholar]
- 55.Richard EA, Miller C. Science. 1990;247:1208. doi: 10.1126/science.2156338. [DOI] [PubMed] [Google Scholar]
- 56.Jardetzky O. Nature. 1966;211:969. doi: 10.1038/211969a0. [DOI] [PubMed] [Google Scholar]
Associated Data
This section collects any data citations, data availability statements, or supplementary materials included in this article.