

Abstract
Objective
To assess the adequacy of polyunsaturated fatty acid intake by rural Bangladeshi children 24–48 months of age in relation to their breastfeeding status.
Methods
Multi-stage sampling was used to select a representative sample of children 24–48 mo of age from two rural districts in Bangladesh (n=479). Two non-consecutive 24 h periods of dietary data were collected via 12 h daytime in-home observations and recall. Breast milk intake was estimated using test weighing. The National Cancer Institute method for episodically consumed foods was used to estimate distributions of usual food and nutrient intakes.
Results
Based on the estimated intake distributions, more than 95% of the children had usual fat intakes less than 30% of total energy. Among 24–35 mo (younger) and 36–48 mo (older) children, respectively, 4% and 16% of breastfeeding children and 31% and 41% of non-breastfeeding children were estimated to consume less than 10% of total energy from fat. An estimated 80% of all children consumed less than 4% of total energy as linoleic acid, and 99% consumed less than 1% of energy as alpha-linolenic acid. Younger breastfeeding children had higher estimated average docosahexaenoic acid (DHA) intakes (0.04 g DHA/d) than their non-breastfeeding counterparts (0.01 g DHA/d; p = 0.0005). Both breastfeeding and non-breastfeeding older children had estimated mean DHA intakes of 0.02 g/d (p=0.74).
Conclusions
Rural Bangladeshi children 24–48 months of age, and especially those who have discontinued breastfeeding, may benefit from increased fat consumption.
Keywords: breastfeeding, PUFA, DHA
INTRODUCTION
Young children require adequate amounts of the polyunsaturated fatty acids (PUFA) linoleic acid (LA), α-linolenic acid (ALA), arachidonic acid (ARA) and docosahexaenoic acid (DHA) for normal growth, development and immune function (1–6). In particular, LA and ALA are considered to be essential fatty acids (EFA), as they cannot be synthesized by humans. Adequate fat intake also facilitates the absorption of fat soluble vitamins and increases the energy density of the diet to allow children to meet their energy needs (7).
The levels of fat intake needed to promote optimal health and development in children have not been conclusively determined. The Joint WHO/FAO Expert Consultation on Fats and Fatty Acids in Human Nutrition and the U.S. Institute of Medicine both recommend that preschool age children consume ≥30% of total energy as fat, ≥4% of total energy as LA and ≥1% of energy as ALA (8–9). Others have estimated that children need to consume ≥1% of total energy as LA and ≥0.2% of energy as ALA to prevent EFA deficiency (10–12).
Breast milk is an important source of fat for young children in developing countries, as shown in dietary studies of children less than two years of age in Bangladesh and The Gambia (7, 13). For children in many developing countries, fat intake begins to decline with the introduction of complementary foods, which are generally lower in fat than breast milk, and then often drops off sharply when breastfeeding is stopped (7, 14–15). Little data are available, however, on fat and PUFA intakes among older preschool age children in developing countries (9, 15).
In Bangladesh, about 78% of children still receive some breast milk at 24 months of age (16). In a study in the late 1970s, Brown et al. found that 18–30 month old rural Bangladeshi children had an average intake of about 25–28% of total energy from fat. We hypothesized that breast milk would continue to be an important source of fat in the diet of 24–48 month old breastfeeding children, with breastfeeding children having a higher intake of fat compared to non-breastfeeding children throughout the age range.
This paper examines dietary data from rural Bangladeshi children 24–48 months of age. Our aims were to compare the fat and energy intakes of breastfeeding and non-breastfeeding children and to assess the adequacy of their fat intake in relation to current international guidelines. We hypothesized that breastfeeding children would have higher and more adequate fat intakes compared to non-breastfeeding children. We also examined factors that may influence child fat intake, such as child gender, maternal educational level, socioeconomic status and site of residence, to assist with targeting future interventions.
MATERIALS AND METHODS
Study design
The study was designed as a cross-sectional, representative, multi-stage sample survey of children 24–48 months of age who resided in one of two rural districts of the northern poverty belt of Bangladesh. The study protocol was approved by the Institutional Review Board of the University of California, Davis and the Research and Ethical Review Committees of the International Centre for Diarrhoeal Disease Research, Bangladesh (ICDDR,B). Written informed consent was obtained from the parents of all participants.
Data collection and processing
Our sampling methods have been previously described in detail (17). Briefly, a multistage cluster sampling design was used to select 480 households with a child 24–48 months of age in Trishal and Pirgacha, two upazilas (administrative districts) with a total population of 667,500 and a high prevalence of poverty and food insecurity. Twenty-four clusters (mauzas or villages) were selected from each study site using systematic sampling with probability of selection proportional to estimated population size. At the second stage of sampling, ten households within each cluster were selected using a global positioning system (GPS) sampling method (18). Approximately 92% of the originally selected eligible households agreed to participate in the study. Data were collected from 240 households in Trishal from October 2007 to May 2008 and from 240 households in Pirgacha from January to June 2008. Forms for one household in Trishal were lost during transit from the field site to ICDDR,B.
Two non-consecutive days of dietary data were collected via a combination of 12-hour in-home observations and maternal recall of night time dietary intake. During daytime observations, a field worker used a frequently standardized food scale (± 1 g, MyWeigh KD7000, MyWeigh, Phoenix, AZ) to measure the weights of all foods as they were prepared and consumed, with separate weights obtained at the point of consumption for animal-source foods (ASF) included in recipes. Child breast milk intake was estimated by the test-weighing procedure (19). Children were weighed using an electronic infant balance (±5g; Seca Baby Scale Model 727, Hamburg, Germany) before and after each breastfeeding episode during the 12-hour observation period, and the total observed duration of breastfeeding episodes was recorded. Insensible water losses were estimated by weighing the child at the beginning and end of a 30 minute non-feeding period; the average insensible loss value for all children (0.0465 g/kg body weight/minute) was used to adjust the 12-hour breast milk intakes for insensible losses. The 24-hour intake of breast milk was calculated for each child by summing the differences in body weights from each daytime feeding episode (adjusted for insensible losses) and then extrapolating to 24-hour intake by multiplying the number of feeding episodes reported during the night-time recall period by the child-specific average amount of breast milk per daytime feed. Children who were experiencing caregiver-reported symptoms of illness on one or more observation days were not excluded from dietary observation. Episodes of illness are common for Bangladeshi children, and the data would not reflect children’s usual dietary intake if sick children were excluded. The most commonly reported symptom was cough (20.6% of observation days), followed by fever (8.1%), difficulty breathing (2.3%), diarrhea (3 or more liquid/semi-liquid stools; 1.6%), and vomiting (0.7%).
Foods consumed were converted to nutrients using the USDA Nutrient Database for Standard Reference (Release 20) and the International Minilist (20–21). Average values for breast milk fatty acids were determined by analyzing the fatty acid composition of actual samples of breast milk from a subset (n=98) of the children’s mothers (22). Women were brought to a central collection site early in the morning and were asked to breastfeed their children. One hour later, breast milk samples (~3.5 mL) were collected via hand expression from the last breast suckled during the previous feed. Breast milk samples were stored in a freezer (−20°C) with a back-up generator for one week to six months (depending on date of collection) until being shipped to ICDDR,B and then UC Davis on dry ice. At UC Davis, the samples were stored at −80° C until extraction and derivatization. A sample of 30 μL (~0.03 g) human milk was used for fatty acid methyl ester (FAME) analysis. The Folch method was used for lipid extraction (24). FAMEs were separated via capillary gas chromatography using an Agilent Technologies (Santa Clara, CA) gas chromatograph model 7890 equipped with a 30 m DB225MS capillary column (J&W Scientific, Folsom, CA) and a flame ionization detector. An authentic GLC reference standard (461, Nu-Chek Prep, Elysian, MN) and Agilent Technologies GC ChemStation software were used to identify and quantify the fatty acid methyl ester peaks. On average, 4.01 mg LA, 0.12 mg ALA, 0.23 mg ARA, and 0.15 mg DHA were delivered per gram of breast milk. The median value for total breast milk fat (3.5 g/dl) was determined by taking the median sum of the lab analyzed values for fatty acids and then using a conversion multiplication factor of 1.05 to determine net fat (triacylglycerol equivalents) (25). Food sources of nutrients were obtained by summing the total nutrient intakes for all observation days, summing the nutrient intakes from each food source, and calculating the percentage of total nutrient intake from each food.
Two height and weight measurements were collected from all children using a portable stadiometer (±0.1 cm; ShorrBoard measuring board, Olney, MD, USA) and frequently standardized electronic scale (± 5 g; Seca model 727, Hamburg, Germany). If two height measurements differed by more than 0.5 cm, a third height measurement was taken. Z-scores were calculated using the SAS (Version 9.2, Cary, NC) macros for the WHO Child Growth Standards (26). Data on socioeconomic status (SES) were collected via a maternal interview.
Data analysis
We used the National Cancer Institute (NCI) method for episodically consumed foods to estimate distributions of usual food and nutrient intake (27–28). This method was used to better approximate the variance of the intake distributions by removing within-person variation and to improve estimates of intake for foods and nutrients that were episodically consumed in the study population during the two days of dietary data collection. Briefly, the NCI method for episodically consumed foods uses data from two or more 24-hour estimates of intake in a two-part model that first estimates the probability of consumption using logistic regression, and then estimates the amount consumed using linear mixed regression on a transformed scale (27).
Our covariates of interest for both the probability of consumption and amount of consumption models included child gender and breastfeeding status, maternal education level, household access to electricity and housing quality, season and site of residence. The housing quality variable is a composite continuous measure assessing the type of floors, walls and sanitary facilities in the family home and the main type of cooking fuel used. Maternal education was a continuous variable that was categorized to minimize the effects of measurement error. The first model (probability of consumption) was of the form:
(27)
The second model (amount of consumption) was of the form:
(27)
Both models were used to estimate distributions of intake for foods and nutrients that were episodically consumed, including oil, egg, fish, meat/poultry, ARA, EPA and DHA. Only the amount model was used for all other foods and nutrients that are presented, since they were consumed in some amount by all participants on all observation days. Percentages of energy derived from fat, carbohydrate and protein were calculated for each child-day; these distributions estimate the long-term mean of the daily ratio of intakes (the usual ratio of intakes) [see Freedman et al. (29) for in-depth discussion of this concept]. Distributions of intakes were estimated for all 24–35 month old (n=221) and 36–48 month old (n=236) children who had complete covariate information, and for the breastfeeding and non-breastfeeding subgroups. Covariates were assessed as being significantly associated with intake based on test statistics from the fitted models.
The SURVEYLOGISTIC procedure in SAS (Version 9.2, Cary, NC) was used to analyze relationships between child characteristics and breastfeeding status, and the SURVEYREG procedure was used to analyze relationships between child characteristics and z-scores for the anthropometric measures. These procedures allow for correct estimation of standard errors and test statistics in survey samples.
RESULTS
Characteristics of children and study households
Table 1 presents the characteristics of the children included in the study sample and their households by age and breastfeeding status groups. There were slightly more boys than girls in the sample, and approximately half of the children were currently breastfeeding. Overall, 55% of children were stunted (height-for-age z-score <-2 SD), 12% were wasted (weight-for-height z-score <-2 SD), and 43% were underweight (weight-for-age z-score <-2 SD). About 40% of their mothers had never attended a school, and 70% of their households did not have access to electricity. Households were surveyed during the pre-Aman harvest (October-November; 8%), the post-Aman harvest (December-March; 50%) and the Aus/Boro harvest (April-June; 42%).
Table 1.
Characteristics of rural Bangladeshi children included in the study and their households by age and breastfeeding status
| Age 24–35 months1 | Age 36–48 months2 | |||||
|---|---|---|---|---|---|---|
| Breastfeeding | Not breastfeeding | p3 | Breastfeeding | Not breastfeeding | p3 | |
| n=146 | n=75 | n=75 | n=161 | |||
| % | % | % | % | |||
| Child gender | ||||||
| Female | 44 | 45 | 0.93 | 42 | 44 | 0.85 |
| Male | 56 | 55 | 58 | 56 | ||
| Height-for-age z-score4 | ||||||
| Severely stunted (< −3 SD) | 22 | 24 | 0.69 | 31 | 15 | 0.03 |
| Moderately stunted (−3 to −2 SD) | 31 | 29 | 31 | 36 | ||
| Not stunted (> −2 SD) | 44 | 46 | 34 | 44 | ||
| Missing data | 3 | 0 | 4 | 5 | ||
| Weight-for-height z-score4 | ||||||
| Severely wasted (< −3 SD) | 5 | 3 | 0.08 | 4 | 3 | 0.48 |
| Moderately wasted (−3 to −2 SD) | 10 | 1 | 14 | 9 | ||
| Not wasted ( > −2 SD) | 82 | 96 | 78 | 84 | ||
| Missing data | 3 | 0 | 4 | 5 | ||
| Weight-for-age z-score4 | ||||||
| Severely underweight (< −3 SD) | 16 | 14 | 0.06 | 16 | 10 | 0.28 |
| Moderately underweight (−3 to −2 SD) | 29 | 18 | 33 | 32 | ||
| Not underweight ( > −2 SD) | 52 | 69 | 47 | 53 | ||
| Missing data | 3 | 0 | 4 | 5 | ||
| Maternal completion of any formal education | ||||||
| No | 37 | 39 | 0.78 | 42 | 44 | 0.85 |
| Yes | 63 | 61 | 58 | 56 | ||
| Electricity access | ||||||
| No | 75 | 69 | 0.24 | 70 | 69 | 0.87 |
| Yes | 25 | 31 | 30 | 31 | ||
| Housing quality | ||||||
| Low score (<2) | 35 | 36 | 0.43 | 31 | 39 | 0.25 |
| Middle score (2–3) | 57 | 51 | 59 | 56 | ||
| High score (>3) | 7 | 12 | 10 | 5 | ||
| Site of residence | ||||||
| Pirgaccha | 53 | 50 | 0.68 | 52 | 49 | 0.66 |
| Trishal | 47 | 50 | 48 | 51 | ||
2 children were 23.8–23.9 months.
8 children were 48.0–49.2 mo.
p-value for effect in a logistic regression model (PROC SURVEYLOGISTIC) with characteristic as independent variable and breastfeeding status (yes/no) as dependent variable.
Calculated using WHO Child Growth Standards.
Bivariate relationships between child breastfeeding status and the covariates of interest were examined within age groups (Table 1), and breastfeeding status was not significantly associated with child gender, maternal education, household electricity access or housing quality, season of data collection, or district of residence in either age group. Child anthropometric status was associated with breastfeeding status. In the younger age group, breastfeeding children had a higher prevalence of wasting (15% vs. 4%; p = 0.08) and underweight (45% vs. 32%; p = 0.06) than non-breastfeeding children, but there was no difference in stunting prevalence. In older children, there were no differences in wasting and underweight prevalence, but breastfeeding children had a higher prevalence of stunting (62% vs. 51%; p = 0.03) than non-breastfeeding children.
The relationship between child anthropometric status and breastfeeding status was examined in multivariate models. On average, non-breastfeeding children in the older age group had a height-for-age z-score significantly higher than breastfeeding children (β = 0.43, p = 0.003), after adjusting for child gender, household SES, maternal education, season and district of residence. After adjusting for those factors, the differences in prevalence of wasting and underweight were no longer significantly associated with breastfeeding status for children in the younger age group.
Energy intake and macronutrient profile of diet
Table 2 shows estimated distributions of usual energy intake and usual macronutrient and EFA intake, expressed as a percent of total energy. The macronutrient distribution of the diet differed based on breastfeeding status, with breastfeeding children within each age category consuming significantly less carbohydrates and protein and significantly more total fat as a percent of total energy after adjusting for season, SES, maternal education level, site of residence and gender in separate linear mixed regression models. In separate models of the same form, intake of EFA as a percent of energy did not differ significantly by breastfeeding status, except that breastfeeding children in the younger age group consumed significantly more LA as a percent of total energy than their non-breastfeeding counterparts. Table 3 presents the estimated percentage of children who consumed less than the recommended cutoffs for the fat to energy ratios.
TABLE 2.
Estimated distributions of usual energy intake and percent of energy derived from fat, carbohydrate and protein among rural Bangladeshi children 1
| Age 24–35 months | Age 36–48 months | |||||||
|---|---|---|---|---|---|---|---|---|
| All (n=221) | Breastfeeding (n=146) | Not breastfeeding (n=75) | P2 | All (n=236) | Breastfeeding (n=75) | Not breastfeeding (n=161) | P2 | |
| Energy (kcal/d) | 819 (669–994) | 772 (642–910) | 910 (774–1049) | 0.23 | 931 (769–1073) | 824 (741–915) | 981 (884–1081) | 0.15 |
| kcal/kg/day | 77.9 (52.1–106.0) | 74.8 (50.8–100.8) | 84.7 (59.0–112.1) | 0.09 | 79.3 (60.4–98.6) | 76.4 (58.7–95.5) | 81.0 (62.1–99.9) | 0.17 |
| % total energy from: | ||||||||
| Carbohydrate | 73.2 (64.1–82.8) | 71.2 (63.1–79.3) | 77.2 (68.9–85.5) | <0.0001 | 77.0 (67.6–86.6) | 74.9 (66.1–84.0) | 78.1 (69.0–87.4) | 0.002 |
| Protein | 9.6 (8.2–11.1) | 9.4 (8.1–10.9) | 10.0 (8.6–11.5) | 0.05 | 10.0 (8.7–11.3) | 9.7 (8.6–11.0) | 10.1 (8.6–11.5) | 0.02 |
| Fat | 17.2 (7.7–29.1) | 19.5 (10.5–30.1) | 12.7 (6.2–21.5) | <0.0001 | 12.9 (6.0–23.2) | 15.6 (7.8–26.9) | 11.8 (5.8–20.5) | 0.001 |
| LA3 | 3.3 (1.5–6.0) | 3.5 (1.7–6.3) | 2.9 (1.3–5.2) | 0.003 | 2.9 (1.2–5.5) | 3.1 (1.3–5.8) | 2.8 (1.2–5.4) | 0.58 |
| ALA4 | 0.40 (0.19–0.71) | 0.39 (0.19–0.68) | 0.42 (0.21–0.74) | 0.35 | 0.41 (0.18–0.76) | 0.42 (0.19–0.78) | 0.39 (0.17–0.71) | 0.11 |
Data are presented as mean (5th–95th percentile). Percent of energy derived from fat, carbohydrate and protein were calculated for each child-day; these distributions estimate the long-term mean of the daily ratio of intakes (the usual ratio of intakes) (26).
Reported p-values are for the effects of breastfeeding on intake after adjusting for season, SES, maternal education level, site of residence and gender in a linear mixed regression model.
linoleic acid (18:2 ω-6).
alpha-linolenic acid (18:3 ω-3).
Table 3.
Estimated percentages of children consuming less than recommended cutoffs for fat to energy intake ratios
| Age 24–35 months | Age 36–48 months | |||||
|---|---|---|---|---|---|---|
| Estimated percentage of children consuming less than: | All (n=221) | Breastfeeding (n=146) | Not breastfeeding (n=75) | All (n=236) | Breastfeeding (n=75) | Not breastfeeding (n=161) |
| 30% of total kcal from fat1 | 96% | 94% | 100% | 99% | 98% | 100% |
| 10% of total kcal from fat2 | 14% | 4% | 31% | 33% | 16% | 41% |
| 4% of total kcal from LA1, 4 | 75% | 69% | 85% | 82% | 80% | 83% |
| 1% of total kcal from LA3, 4 | 1% | 0% | 1% | 2% | 1% | 2% |
| 1% of total kcal from ALA1, 5 | 100% | 100% | 99% | 99% | 99% | 99% |
| 0.2% of total kcal from ALA3, 5 | 6% | 7% | 4% | 8% | 10% | 7% |
The Joint WHO/FAO Expert Consultation on Fats and Fatty Acids in Human Nutrition and the U.S. Institute of Medicine recommend that preschool age children consume ≥30% of total energy as fat, ≥4% of total energy as LA and ≥1% of energy as ALA (8–9).
A diet with less than 10% of total energy from fat is considered a very low fat diet (30).
It is estimated that children need to consume ≥1% of total energy as LA and ≥0.2% of energy as ALA to prevent EFA deficiency (10–12).
linoleic acid (18:2 ω-6);
alpha-linolenic acid (18:3 ω-3
In the previously mentioned models for both age groups, better housing quality was consistently associated with higher intakes of protein (younger age group: β = 0.06, p = 0.002; older age group: β = 0.03, p = 0.08), total fat (younger: β = 0.31, p = 0.009; older: β = 0.18, p = 0.01), LA (younger: β = 0.14, p = 0.02; older: β = 0.20, p = 0.004), and ALA (younger: β = 0.20, p = 0.002; older: β = 0.19, p = 0.006), and lower intake of carbohydrates (younger: β = −0.98, p = 0.001; older: −0.84, p = 0.004) as a percent of total energy. Higher maternal education level was also consistently associated with higher intakes of total fat (younger: β = 0.28, p = 0.04; older: β = 0.13, p = 0.05), LA (younger: β = 0.20, p = 0.008; older: β = 0.15, p = 0.03), ALA (younger: β = 0.18, p = 0.02; older: β = 0.14, p = 0.04), and lower intake of carbohydrates (younger: β = −0.68, p = 0.05; older: −0.69, p = 0.02) as a percent of total energy. Older children in Trishal had a significantly higher intake of carbohydrates (β = 1.4, p = <0.0001) and a lower intake of total fat (β = −0.38, p = <0.0001), LA (β = −0.46, p = <0.0001), and ALA (older: β = −0.30, p = 0.0001) as a percent of total energy than older children in Pirgacha.
Consumption of fatty acids
Table 4 presents the children’s estimated distributions of usual fat intake. Compared to non-breastfeeding children, breastfeeding children had significantly higher intakes of total fat, saturated fat, monounsaturated fat, ARA, and DHA in the younger age group and total fat, monounsaturated fat, and ARA in the older age group, after adjusting for season, SES, maternal education level, site of residence and gender. ALA intake, however, was significantly lower in breastfeeding versus non-breastfeeding children in both the younger and older age categories. Associations between other variables in the models and fat intake reflected those observed in the models of fat intake as a percent of total energy, with a consistent positive association between better housing quality and higher maternal education level and intakes of total fat and polyunsaturated fats and a negative association between living in Trishal versus Pirgacha and intakes of total fat and polyunsaturated fats after adjusting for the other covariates.
Table 4.
Estimated distributions of usual fat (g/d) intake by rural Bangladeshi children1
| Age 24–35 months | Age 36–48 months | |||||||
|---|---|---|---|---|---|---|---|---|
| All (n=221) | Breastfeeding (n=146) | Not breastfeeding (n=75) | P2 | All (n=236) | Breastfeeding (n=75) | Not breastfeeding (n=161) | P2 | |
| Total fat | 15.2 (7.0–25.9) | 16.5 (8.1–27.1) | 12.8 (6.1–21.9) | 0.001 | 13.5 (5.7–25.3) | 15.3 (6.8–28.1) | 12.8 (5.5–23.8) | 0.08 |
| Saturated fat | 5.2 (1.7–10.0) | 6.2 (2.8–10.7) | 3.3 (1.2–6.2) | <0.0001 | 3.6 (1.3–7.4) | 4.7 (2.0–9.1) | 3.1 (1.2–6.1) | 0.42 |
| Monounsaturated fat | 5.1 (2.2–9.2) | 5.5 (2.5–9.6) | 4.4 (2.0–7.9) | 0.002 | 4.8 (2.0–9.1) | 5.5 (2.4–10.0) | 4.6 (2.0–8.5) | 0.05 |
| Polyunsaturated fat | 3.5 (1.5–6.8) | 3.6 (1.5–6.8) | 3.5 (1.5–6.7) | 0.75 | 3.6 (1.4–7.3) | 3.5 (1.4–7.1) | 3.7 (1.4–7.4) | 0.31 |
| LA3 | 3.0 (1.2–5.8) | 3.0 (1.2–5.9) | 2.9 (1.2–5.7) | 0.56 | 3.1 (1.2–6.2) | 3.0 (1.2–6.0) | 3.0 (1.2–6.3) | 0.38 |
| ARA4 | 0.06 (0.01–0.12) | 0.07 (0.03–0.14) | 0.03 (0.01–0.07) | <0.0001 | 0.05 (0.01–0.11) | 0.06 (0.01–0.09) | 0.04 (0.01–0.13) | 0.009 |
| ALA5 | 0.37 (0.14–0.70) | 0.34 (0.13–0.64) | 0.43 (0.18–0.79) | 0.005 | 0.43 (0.16–0.84) | 0.39 (0.15–0.74) | 0.46 (0.18–0.87) | 0.009 |
| DHA6 | 0.03 (0.01–0.07) | 0.04 (0.01–0.08) | 0.01 (0.0–0.03) | 0.0005 | 0.02 (0.01–0.03) | 0.02 (0.01–0.03) | 0.02 (0.01–0.03) | 0.74 |
Data are presented as mean (5th–95th percentile).
Reported p-values are for the effects of breastfeeding on intake after adjusting for season, SES, maternal education level, site of residence, and gender in a linear mixed regression model.
linoleic acid.
arachidonic acid.
alpha-linolenic acid.
docosahexaenoic acid.
Food sources of fatty acids in the diet
For breastfeeding children, breast milk was the greatest source of fat, supplying about one-fourth of total fat intake. Additional fat was provided by vegetable oil (22%), snacks/biscuits (13%), and rice (8%). Animal source foods (ASF), including freshwater fish, eggs, meat/poultry and dairy products, provided about 22% of total fat intake for breastfeeding children. For non-breastfeeding children, vegetable oil was the primary source of fat, providing about 35% of total fat intake. Additional fat was provided by snacks/biscuits (14%) and rice (13%). ASF provided about 27% of total fat intake for non-breastfeeding children.
For both breastfeeding and non-breastfeeding children, vegetable oil, snacks/biscuits and rice accounted for about 70% of total PUFA intake (Figure 1). Breast milk provided 14% of PUFA intake for breastfeeding children. For both breastfeeding and non-breastfeeding children, egg and freshwater fish provided 80–90% of the ARA consumed. Human milk (for breastfeeding children) and meat/poultry provided the remaining 10–20%. In contrast, breast milk was the most prominent source of DHA for breastfeeding children, providing around 50% of total DHA. The remaining 50% was supplied by freshwater fish and egg. For non-breastfeeding children, almost all DHA was provided by freshwater fish and egg.
Figure 1. Proportions of polyunsaturated fat (PUFA) provided by specific food sources in the diets of rural Bangladeshi breastfeeding children (solid bar, n=221) and non-breastfeeding children (diagonal cross-hatch bar, n=236).
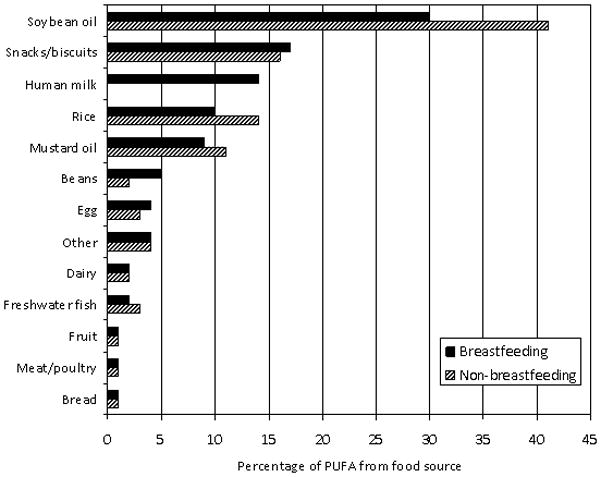
In this figure, the beans category does not include lentils, the “snacks/biscuits” category includes sweet and sugar coated biscuits, salted biscuits/crackers, chips, tea cake, chanachur [chickpea flour, peanuts, lentils, rice flakes, vegetable oil, spices], baro vaza [crispy rice, fried chickpeas, chanachur, mustard oil], tirer khaja [sugar coated sesame seeds], narical chara [sugar coated coconut], and the “other” category includes wheat, vegetables [including potatoes and green leafy vegetables], lentils, other fat [coconut oil, ghee, fish oil, lard], ocean fish and noodles.
Estimated usual intake distributions for food sources of PUFA (g/d) are shown in Table 5. Estimated intake amounts of fish, egg, meat/poultry, soybean oil, and mustard oil did not differ by breastfeeding status in either age group after adjusting for season, SES, maternal education level, gender, and site of residence in separate linear mixed regression models. In these models, better housing quality (β = 0.27; p = 0.05) and higher maternal education level (β = 0.33; p = 0.04) were associated with higher soybean oil intake, and egg intake amount was higher in Pirgacha than Trishal (β = 1.8; p = 0.002).
Table 5.
Estimated usual consumption (g/d) of food sources of PUFA by rural Bangladeshi children1
| Age 24–35 months | Age 36–48 months | |||||||
|---|---|---|---|---|---|---|---|---|
| Food source | All (n=221) | Breastfeeding (n=146) | Not breastfeeding (n=75) | P2 | All (n=236) | Breastfeeding (n=75) | Not breastfeeding (n=161) | P2 |
| Fish | 6.2 (0.6–19.0) | 5.3 (0.5–17.0) | 8.0 (0.9–22.1) | 0.87 | 6.6 (1.1–15.8) | 3.9 (0.6–10.0) | 7.9 (1.9–17.3) | 0.39 |
| Egg | 8.6 (1.5–21.5) | 8.5 (1.4–21.8) | 9.0 (2.0–22.4) | 0.73 | 9.7 (0.6–29.0) | 10.9 (0.8–31.2) | 9.2 (0.6–28.0) | 0.92 |
| Meat/ poultry | 2.4 (0.1–8,4) | 2.7 (0.2–9.5) | 1.8 (0.1–6.5) | 0.47 | 3.3 (0.1–14.4) | 2.6 (0.0–11.7) | 3.7 (0.1–15.9) | 0.41 |
| Soybean oil | 2.0 (0.1–5.6) | 1.8 (0.1–5.0) | 2.5 (0.1–6.5) | 0.14 | 2.2 (0.0–6.8) | 1.5 (0.0–5.2) | 2.6 (0.0–7.5) | 0.08 |
| Mustard oil | 1.3 (0.2–2.7) | 1.2 (0.2–2.4) | 1.6 (0.3–3.1) | 0.11 | 1.9 (0.2–5.3) | 2.0 (0.2–5.4) | 1.9 (0.2–5.5) | 0.75 |
| Breast milk | - | 154 (43–301) | - | - | 91 (31–173) | - | - | |
Data are presented as mean (5th–95th percentile).
Reported p-values are for the effects of breastfeeding on amount of intake after adjusting for season, SES, maternal education level, site of residence, and gender in a linear mixed regression model.
In models of the same form that examined probability of intake, the probability of consuming soybean oil was higher in Pirgacha (β = 2.3; p = <0.0001), while the probability of consuming mustard oil was higher in Trishal (β = 1.2; p = <0.0001). Children in Trishal had a higher probability of fish intake than children in Pirgacha (β = 0.58; p = 0.002). In contrast, children in Pirgacha had a higher probability of consuming meat/poultry (β = 1.3; p = 0.0002) and egg (β = 1.1; p <0.0001) than children in Trishal.
DISCUSSION
Our data provide additional support for the observation that the fat intake of children in developing countries decreases as breast milk is displaced from the diet (7, 14–15). Overall, all children 24–48 months old were consuming a low fat, high carbohydrate diet. Both younger and older breastfeeding children had significantly higher fat intake as a percent of total energy when compared to their non-breastfeeding counterparts in the same age category. Breastfeeding children in the 24–35 month age group had the highest mean fat intake as a percent of total energy at 19.5%. Almost all children in the study, however, had fat intakes below the recommended usual intake of 30% of total energy. In general, children from households with better housing quality and more educated mothers had higher fat intake. Fat intakes were also higher in older children living in Pirgacha versus Trishal. However, the average absolute differences were small, and the diets of all children were low in fat.
Of particular concern is the large percentage of children who were estimated to be consuming a very low fat diet (less than 10% of total energy from fat). It was estimated that 30–40% of all non-breastfeeding children and 16% of older breastfeeding children had fat consumption below this level. Prentice and Paul considered this to be a very low level of fat intake in children that was “not widely prevalent,” even in the developing world (7).
Most children had EFA intakes that were less than the lower levels recommended by FAO/WHO and the U.S. IOM, but greater than the absolute minimum levels estimated to prevent EFA deficiency (8–12). Although intake of EFA was low, most children had LA:ALA intake ratios that fell within the recommended range of 5:1 to 10:1 (9). Breastfeeding children in both age groups had lower intake of ALA compared to non-breastfeeding children; this is most likely because of the very low ALA levels found in the breast milk samples from the women in this study.
A few other studies have examined fat intake in preschool-age children, and in general, children in this study had lower levels of total fat and EFA intake and similar levels of long-chain fatty acid intake. All groups of children in this study had estimated mean intakes of fat as a percentage of total energy that were much lower than the 34.6% reported by Innis et al. for 25–36 month old Canadian children (30). One to five year old rural Chinese children were estimated to consume 21–24% of total energy from fat, which is similar to that observed for breastfeeding children in our study, but still much higher than that observed for non-breastfeeding children (31). Absolute LA and ALA intake for Bangladeshi children were similar to those observed for the Chinese children (~2 g LA/d and ~0.3 g ALA/d), but less than half of the ranges of intake observed for LA (~6–9 g/d) and ALA (~0.7–2 g/d) in the diets of preschool-age children from Australia, Canada, and Belgium (30–33). Interestingly, the ARA and DHA intake of the Bangladeshi children was within the general range observed for children from the studies in Canada, China, Australia and Belgium (0.02–0.26 g ARA/d and 0.02–0.1 g DHA/d) (30–33). All of these studies used different dietary intake methodology and food composition databases, so there may be some limitations to these comparisons.
Important sources of fat for the children in our study included vegetable oil, rice, and locally produced and pre-packaged snacks and biscuits. ASF provided about one-fourth of total fat for young children. The probability of consuming different types of oil and ASF varied by district of residence, indicating that local preferences and availability must be taken into account when planning food-based interventions. In both sites, breast milk was a significant contributor to fat intake in breastfeeding children. In particular, it was an important source of DHA. Younger breastfeeding children consumed significantly more DHA than their non-breastfeeding peers. In older children, however, breast milk consumption was not associated with higher DHA intake, most likely because amount of breast milk consumed is lower in this age group.
Overall, the prevalence of stunting for children in this study was very high and in agreement with the 2007 Bangladesh Demographic and Health Survey, which found that 53–54% of 24–47 month old children were stunted (16). It is important to note, however, that this is a cross-sectional study, and we cannot establish a causal relationship between low fat intake and growth in these children. Although breastfeeding children generally had higher fat intakes, children in the older age group had significantly lower height-for-age z-scores compared to their non-breastfeeding counterparts after adjusting for several potential confounders. There was a trend for lower energy intake in breastfeeding versus non-breastfeeding children, but the difference was not significant in either age group after adjusting for other factors. It is possible that there was a nutrient other than energy or fat that was growth-limiting in breastfeeding children (7). The negative association between breastfeeding and height-for-age z-score may also be due to reverse causality if mothers are less likely to stop breastfeeding a child in poor health, as has been previously described by Marquis et al. in Peru (34).
One strength of our study was that we collected quantitative data on daytime consumption via direct observation and weighing of foods and test weighing of breastfeeding children. Another strength is that we used statistical methods developed by the National Cancer Institute to account for episodic consumption of foods and nutrients and to remove within-person variation from our estimated usual intake distributions. It is possible, however, that we may have under- or over-estimated fat intakes in these children. Children did have some food intake that was estimated via recall, although their main meals were generally consumed during the 12-hr in-home observation period. The mean contribution of energy from the recall period for the children was low (65 kcal/d). To improve maternal recall of child intake, field workers used locally developed standardized plates, cups, and spoons to assist with portion size estimation and a multiple pass method to minimize omissions.
It is possible that mothers may not have witnessed some of their children’s food intake, since children often moved between households and relatives. However, children were more likely to be in the home with the mother during the early morning and evening periods that the recall covered. Another potentially significant source of error is the conversion of food intakes to nutrient intake using food composition data. The nutrient composition of foods can vary significantly by geography and season, and budgetary constraints prevented us from directly analyzing foods from the study area to determine their fatty acid composition. To partially address this, we have presented quantitative data on food intake to support the nutrient intake data.
Some potential problems with estimating fat intake were specific to breastfeeding children. Breast milk samples were not available from the mothers of all breastfeeding children in the study, so values for total fat and individual fatty acids in breast milk were based on the average composition of the samples that were analyzed from a subset of the mothers (n=98). Ideally, we would have been able to analyze samples from all of the mothers, as the breast milk fatty acid composition can vary considerably based on maternal diet. Our estimated median total fat content of the milk (3.5 g/dl) was within usually reported concentrations internationally, but may be inappropriately high given that the breastfeeding mothers in the current study were generally lean (42% had a BMI <18.5) (22). It is possible that this relatively high fat content is a result of using a spot sample to estimate total breast milk fat content. It has been shown previously that the total fat content of fore- and hind-milk differs (35), so spot samples taken later in the feed may have contained unrepresentatively high fat concentrations. In contrast with the present results, the mean fat content of breast milk at eight months postpartum was just 2.8 g/dl among similarly nourished Bangladeshi mothers included in an earlier study that used full milk expression (36). If our value for the total fat content of milk was too high, we may have overestimated the fat intake of breastfeeding children. Therefore, we also estimated the distribution of fat consumption as a percent of total energy using a lower value for breast milk fat content [2.8 g/dl], and found that using a lower mean fat content for the breast milk had only a small effect, increasing the percentage of breastfeeding children whose fat consumption was below 10% of total energy from 4 to 6% in the younger age group and from 16 to 20% in the older age group. It should be noted that the fatty acid composition of breast milk can be reliably determined from a spot sample (35).
It is also possible that we may have under- or over-estimated the intake of breastfeeding children because we extrapolated mean daytime intakes (amount per feed) of breast milk to nighttime feeds. Due to logistical and safety issues, we could not do any test weighing at night, so we do not know if our assumption for extrapolation of daytime to nighttime amount per feed is correct. It is possible that preschool age children consume more milk at night than during the day because food consumption displaces breast milk intake during the day.
Conclusion
Both breastfeeding and non-breastfeeding 24–48 month old Bangladeshi children have fat intakes below levels recommended by FAO/WHO and the U.S. IOM. It is possible that preschool-aged Bangladeshi children could benefit from increased fat intake. This would need to be achieved without reducing the micronutrient density of the diet (37). Thus, studies of lipid-based multiple micronutrient supplements should be considered in this population. It is important that these studies be tied to biochemical and functional outcomes to better inform fat intake requirements for children in this age group. Finally, it is likely that Bangladeshi children would also benefit from an enhanced EFA profile in breast milk if the fatty acid profile of the maternal diet were improved.
Acknowledgments
The authors thank the study participants who welcomed us into their homes and the staff from ICDDR,B who were instrumental to the data collection process. We are also grateful to Dr. Daniel Tancredi from the UC Davis School of Medicine, Department of Pediatrics, for statistical consultation. The authors’ responsibilities were as follows - EAY: study design, study implementation, data analysis, interpretation of results, and manuscript preparation; JEA: study design, study implementation, and critical review of manuscript; MMI: study implementation and critical review of manuscript; TA: study implementation and critical review of manuscript; JBG: interpretation of results and critical review of manuscript; CD: critical review of manuscript; MBH: study implementation and critical review of manuscript; BLL: study design and study implementation; ASR: study implementation and critical review of manuscript; KMJ: study implementation and critical review of manuscript; KHB: funding, study design, interpretation of results, and critical review of the manuscript.
Footnotes
Supported by the Bristol-Myers Squibb Foundation, Inc., the Harvest Plus Challenge Program [coordinated by the Centro Internacional de Agricultura Tropical (CIAT) and the International Food Policy Research Institute (IFPRI)], the National Institute of Environmental Health Sciences (NIEHS) grant R37 ES02710, the NIEHS Superfund Basic Research Program P42 ES04699, the University of California Davis Center for Children's Environmental Health, NIEHS grant P01 ES11269, and the University of California Discovery Program. None of the authors have any financial or personal interest in the organizations sponsoring this research.
References
- 1.Denyer GS. The renaissance of fat: roles in membrane structure, signal transduction and gene expression. MJA. 2002;176:S109–10. [PubMed] [Google Scholar]
- 2.Smit EN, Muskiet FAJ, Boersma ER. The possible role of essential fatty acids in the pathophysiology of malnutrition: a review. Prostaglandins Leukot Essent Fatty Acids. 2004;71:241–50. doi: 10.1016/j.plefa.2004.03.019. [DOI] [PubMed] [Google Scholar]
- 3.Innis SM. Perinatal Biochemistry and Physiology of Long-Chain Polyunsaturated Fatty Acids. J Pediatr. 2003;143:81–8. doi: 10.1067/s0022-3476(03)00396-2. [DOI] [PubMed] [Google Scholar]
- 4.Innis SM. Dietary (n-3) Fatty Acids and Brain Development. J Nutr. 2007;137:855–59. doi: 10.1093/jn/137.4.855. [DOI] [PubMed] [Google Scholar]
- 5.German JB, Roberts MA, Watkins SM. Genomics and Metabolomics as Markers for the Interaction of Diet and Health: Lessons from Lipids. J Nutr. 2003;133:2078–83S. doi: 10.1093/jn/133.6.2078S. [DOI] [PubMed] [Google Scholar]
- 6.Das UN. Essential fatty acids: biochemistry, physiology and pathology. Biotechnol J. 2006;1:420–39. doi: 10.1002/biot.200600012. [DOI] [PubMed] [Google Scholar]
- 7.Prentice AW, Paul AA. Fat and energy needs of children in developing countries. Am J Clin Nutr. 2000;72:1253–65S. doi: 10.1093/ajcn/72.5.1253s. [DOI] [PubMed] [Google Scholar]
- 8.Institute of Medicine. Dietary Reference Intakes for Energy, Carbohydrate, Fiber, Fat, Fatty Acids, Cholesterol, Protein, and Amino Acids (Macronutrients) Washington DC: National Academies Press; 2005. [Google Scholar]
- 9.Uauy R, Dangour AD. Fat and Fatty Acid Requirements and Recommendations for Infants of 0–2 Years and Children of 2–18 Years. Ann Nutr Metab. 2009;55:76–96. doi: 10.1159/000228997. [DOI] [PubMed] [Google Scholar]
- 10.Innis SM. Essential fatty acids in growth and development. Prog Lipid Res. 1991;30(1):39–103. doi: 10.1016/0163-7827(91)90006-q. [DOI] [PubMed] [Google Scholar]
- 11.Bjerve KS, Fischer S, Alme K. Alpha-linolenic acid deficiency in man: effect of ethyl linolenate on plasma and erythrocyte fatty acid composition and biosythesis of prostanoids. Am J Clin Nutr. 1987;46:570–6. doi: 10.1093/ajcn/46.4.570. [DOI] [PubMed] [Google Scholar]
- 12.Holman RT. The ratio of trienoic:tetraenoic acids in tissue lipids as a measure of the essential fatty acid requirement. J Nutr. 1960;70:405–10. doi: 10.1093/jn/70.3.405. [DOI] [PubMed] [Google Scholar]
- 13.Brown KH, Black RE, Becker S, et al. Consumption of foods and nutrients by weanlings in rural Bangladesh. Am J Clin Nutr. 1982;36:878–89. doi: 10.1093/ajcn/36.5.878. [DOI] [PubMed] [Google Scholar]
- 14.Michaelsen KF, Hoppe C, Roos N, et al. Choice of foods and ingredients for moderately malnourished children 6 months to 5 years old. [Accessed February 28, 2010.];WHO, UNICEF, WFP and UNHCR Consultation on the Dietary Management of Moderate Malnutrition in Under-5 Children by the Health Sector [WHO web site] 2008 Available at: http://www.who.int/nutrition/publications/moderate_malnutrition/MM_Background_paper2.pdf.
- 15.Lutter CK, Rivera JA. Nutritional Status of Infants and Young Children and Characteristics of Their Diets. J Nutr. 2003;133:2941–49S. doi: 10.1093/jn/133.9.2941S. [DOI] [PubMed] [Google Scholar]
- 16.National Institute of Population Research and Training (NIPORT), Mitra and Associates, Macro International. [Accessed September 5, 2010.];Bangladesh Demographic and Health Survey 2007. 2009 Available at: http://www.measuredhs.com/pubs/pdf/GF13/GF13.pdf.
- 17.Arsenault JE, Yakes EA, Hossain MB, et al. The Current High Prevalence of Dietary Zinc Inadequacy among Children and Women in Rural Bangladesh Could Be Substantially Ameliorated by Zinc Biofortification of Rice. J Nutr. 2010;140:1683–90. doi: 10.3945/jn.110.123059. [DOI] [PubMed] [Google Scholar]
- 18.Grais RF, Rose AMC, Guthman JP. Don't spin the pen: two alternative methods for second-stage sampling in urban cluster surveys. Emerging Themes in Epidemiology. 2007;4(8) doi: 10.1186/1742-7622-4-8. [DOI] [PMC free article] [PubMed] [Google Scholar]
- 19.Arthur PG, Hartmann PE, Smith M. Measurement of the milk intake of breast-fed infants. J Pediatr Gastroenterol Nutr. 1987;6(5):758–63. doi: 10.1097/00005176-198709000-00017. [DOI] [PubMed] [Google Scholar]
- 20.U.S. Department of Agriculture: Agricultural Research Service. [Accessed February 2, 2010.];USDA Nutrient Database for Standard Reference (Release 20) [USDA website] 2007 Available at: http://www.ars.usda.gov/ba/bhnrc/ndl.
- 21.Bunch S, Murphy S. [Accessed November 8, 2009.];Worldfood Dietary Assessment System [FAO website] 1996 Available at: http://www.fao.org/infoods/software_worldfood_en.stm.
- 22.Yakes EA. Polyunsaturated fatty acid intake and status of breast fed and non-breast fed Bangladeshi children 24–47 months of age [PhD thesis] Davis, CA: University of California, Davis; 2010. [Google Scholar]
- 23.Ruel MT, Dewey KG, Martinez C, et al. Variation of single daytime samples of human milk to estimate the 24-h concentration of lipids in urban Guatemalan mothers. Am J Clin Nutr. 1997;65:439–44. doi: 10.1093/ajcn/65.2.439. [DOI] [PubMed] [Google Scholar]
- 24.Folch J, Lees M, Sloane Stanley GH. A simple method for the isolation and purification of total lipids from animal tissues. J Biol Chem. 1957;226:497–509. [PubMed] [Google Scholar]
- 25.Hyviinen L. Approach to fat analysis of foods. Food Chemistry. 1996;57(1):23–6. [Google Scholar]
- 26.World Health Organization. [Accessed June 13, 2010.];Child growth standards - macros [WHO website] 2010 Available at: http://www.who.int/childgrowth/software/en/
- 27.Tooze JA, Midthune D, Dodd KW, et al. A New Statistical Method for Estimating the Usual Intake of Episodically Consumed Foods with Application to Their Distribution. J Am Diet Assoc. 2006;106:1575–87. doi: 10.1016/j.jada.2006.07.003. [DOI] [PMC free article] [PubMed] [Google Scholar]
- 28.National Cancer Institute. [Accessed September 27, 2009.];Usual Dietary Intakes: SAS Macros for the NCI Method [NCI website] 2009 Available at: http://riskfactor.cancer.gov/diet/usualintakes/macros.html.
- 29.Freedman LS, Guenther PM, Dodd KW, et al. The Population Distribution of Ratios of Usual Intake of Dietary Components That Are Consumed Every Day Can be Estimated from Repeated 24-Hour Recalls. J Nutr. 2010;140:111–116. doi: 10.3945/jn.109.110254. [DOI] [PMC free article] [PubMed] [Google Scholar]
- 30.Innis SM, Vaghri Z, King DJ. n-6 Docosapentaenoic acid is not a predictor of low docosahexaenoic acid status in Canadian preschool children. Am J Clin Nutr. 2004;80:768–73. doi: 10.1093/ajcn/80.3.768. [DOI] [PubMed] [Google Scholar]
- 31.Barbarich BN, Willows ND, Wang L, et al. Polyunsaturated fatty acids and anthropometric indices of children in rural China. Eur J Clin Nutr. 2006;60:1100–7. doi: 10.1038/sj.ejcn.1602424. [DOI] [PubMed] [Google Scholar]
- 32.Sioen I, Huybrechts I, Verbeke W, et al. n-6 and n-3 PUFA intakes of pre-school children in Flanders, Belgium. Brit J Nutr. 2007;98:819–25. doi: 10.1017/S0007114507756544. [DOI] [PubMed] [Google Scholar]
- 33.Meyer BJ, Mann NJ, Lewis JL, et al. Dietary Intakes and Food Sources of Omega-6 and Omega-3 Polyunsaturated Fatty Acids. Lipids. 2003;38:391–8. doi: 10.1007/s11745-003-1074-0. [DOI] [PubMed] [Google Scholar]
- 34.Marquis GS, Habicht JP, Lanata CF, et al. Association of Breastfeeding and Stunting in Peruvian Toddlers: An Example of Reverse Causality. Int J Epid. 1997;26(2):349–56. doi: 10.1093/ije/26.2.349. [DOI] [PubMed] [Google Scholar]
- 35.Daly SE, Di Rosso A, Owens RA, et al. Degree of breast emptying explains changes in the fat content, but not fatty acid composition, of human milk. Experimental Physiology. 1993;78:741–55. doi: 10.1113/expphysiol.1993.sp003722. [DOI] [PubMed] [Google Scholar]
- 36.Brown KH, Akhtar NA, Robertson AD, et al. Lactational capacity of marginally nourished mothers: relationships between maternal nutritional status and quantity and proximate composition of milk. Pediatrics. 1986;78(5):909–19. [PubMed] [Google Scholar]
- 37.Dewey KG. Guiding Principles for Complementary Feeding of the Breastfed Child. Washington, D.C.: Pan American Health Organization; 2004. [Google Scholar]