Abstract
The Lorentz force (the force acting on currents in a magnetic field) plays an increasingly larger role in techniques to image current and conductivity. This review will summarize several applications involving the Lorentz force, including 1) magneto-acoustic imaging of current, 2) “Hall effect” imaging, 3) ultrasonically-induced Lorentz force imaging of conductivity, 4) magneto-acoustic tomography with magnetic induction, and 5) Lorentz force imaging of action currents using magnetic resonance imaging.
Keywords: Lorentz force, magnetic field, ultrasound, magnetic resonance imaging, conductivity, magneto-acoustic imaging
Introduction
Over the last twenty years, several research groups have developed imaging methods that take advantage of the force acting on biocurrents when a magnetic field is present. The underlying mechanism is familiar to anyone who has taken an introductory physics class1: a wire carrying a current I, having a length L, and lying perpendicular to a magnetic field B experiences a magnetic force F=ILB, often called the “Lorentz force”. The direction of the force is at right angles to both the wire and the magnetic field, and can be determined by a “right-hand-rule.” This is the same force that makes electric motors work.
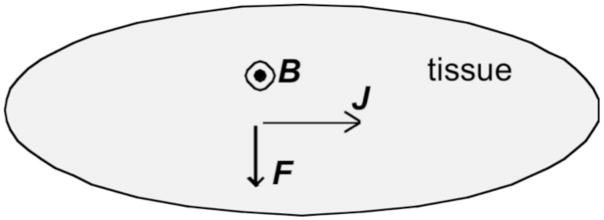
Because the Lorentz force results from a magnetic field and produces mechanical motion, phenomena that arise from it are often referred to as “magneto-acoustics”. In biological tissue, where wires are not present, it is more convenient to speak of the Lorentz force per unit volume, F, arising from the current density J and the magnetic field B: F = J × B, where “×” indicates the cross product (Fig. 1). In general, magneto-acoustic effects are small, but small effects underlie many important imaging techniques.
Figure 1.
The Lorentz Force. Current density J flows to the right, and the magnetic field B is directed out of the paper (indicated by the symbol  ), resulting in a force F downward.
In this minireview, I will discuss biological and medical applications of magneto-acoustics. These techniques could be useful for mapping electrical activity in the brain and heart, and for detecting abnormal tissues—such as tumors—by changes in electrical properties. I focus on magnetic forces that act on electric current, with an emphasis on how these forces can be used to image current or conductivity. Topics I will not address include: safety issues arising from strong magnetic fields2–4, effects arising from the presence of iron that result in particularly large magnetic forces (for example, magnetite particles in magnetotatic bacteria5), and phenomena related to electron or nuclear spin (such as nuclear magnetic resonance).
Magneto-Acoustic Imaging of Current
In 1988, Bruce Towe and his colleagues6,7 developed a “novel method for the noninvasive measurement of low-level ionically conducted electric currents flowing in electrolytes and tissues.” They pass AC current (3 kHz) with a strength of a few microamperes through a hamster placed in a 0.2 T magnetic field (Fig. 2). The acoustic signal arising from the Lorentz force is detected using a microphone and a lock-in amplifier. They conclude6 “these experiments show that it is possible to noninvasively detect the existence of ionic currents flowing interior to a conducting medium by applying magnetic fields and monitoring the resulting acoustic responses. This principle is of interest as a possible basis for a new method of noninvasively measuring bioelectric currents in living organisms.” Later, Towe8 further developed an instrument that “is basically a very sensitive force-balance that can measure Lorentz forces experienced by ionic currents flowing in small objects when exposed to strong oscillating magnetic fields.” Although this method has not yet become widely used to image current, it demonstrates the feasibility of measuring magneto-acoustic effects and illustrates the physical principles at work.
Figure 2.
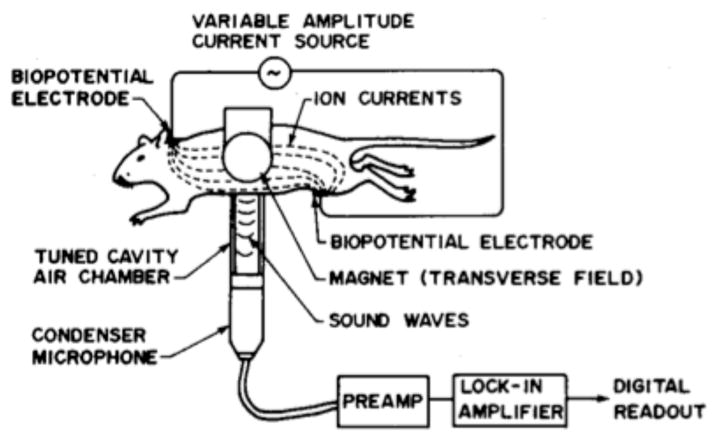
An experiment for the magento-acoustic detection of current in a hampster. From Towe and Islam6. (© 1988 IEEE)
Towe’s technique can detect applied AC currents of a known frequency, but can it be used to detect endogenous action currents in nerve and muscle? To answer this question, Roth, Basser, and Wikswo9 analyzed magneto-acoustic phenomena theoretically. They calculate the pressure p and displacement u produced by a current density J in an elastic conducting tissue having a shear modulus G and exposed to a magnetic field B, starting from Navier’s equation,
| (1) |
This equation is motivated by the fluid-fiber-collagen model of cardiac tissue10, in which the pressure is caused by the fluid (assumed to be incompressible, ∇ · u = 0) and the shear modulus arises from the elastic properties of collagen fibers. Equation 1 relates the forces that arise by elastic shearing, by pressure gradients, and by the Lorentz force. The divergence of Eq. 1 shows that the source of the pressure is the curl of the current density
| (2) |
This result reveals an analogy between magneto-acoustic current imaging and biomagnetic current imaging9. The curl of Ampere’s law, ∇ × b = μoJ, governing the biomagnetic field b produced by action currents J, yields
| (3) |
where μo is the permeability of free space. Magneto-acoustic pressure recordings (Eq. 2) and biomagnetic measurements (Eq. 3) image action currents in an equivalent way: they both have ∇ × J as their source term.
Roth et al.9 obtain analytical solutions for the displacement produced by a current dipole of strength q at the center of a conducting sphere of radius a. The magnitude of the displacement at the sphere surface is on the order of qB/(4πGa). For a dipole of strength q = 1 μA m, a shear modulus of G = 104 N/m2, a magnetic field of B = 1 T, and a radius of a = 1 cm, the surface displacement is very small, on the order of 1 nm. Their analysis indicates that “magneto-acoustic imaging of endogenous bioelectric currents might be significantly more difficult to achieve than might be inferred from the experiments reported to date.”
Ammari et al.11 have examined localization methods for magneto-acoustic current imaging mathematically. Their approach is to average measurements of the pressure weighted by particular solutions of the wave equation, which allows them to locate dipole sources. This method can be extended to the case when the pressure is measured over only part of the tissue boundary.
“Hall Effect” Imaging
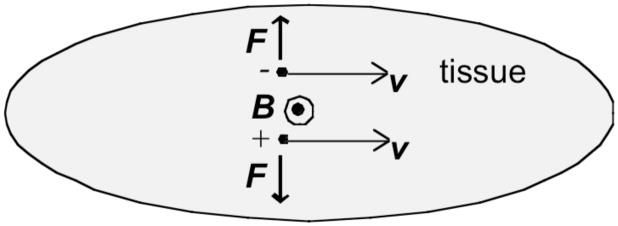
Han Wen12–14 and his co-workers developed a method of imaging the electrical properties of a sample using what they call the “classical Hall effect” (Fig. 3). Their signal is produced by12 “the charge separation phenomenon in a conductive object moving in a magnetic field. This charge separation is a result of the opposing Lorentz forces on the positive and negative charges, and leads to an externally detectable voltage …. [The] voltage amplitude is determined by the strength of the Lorentz force and the charge density and mobility.” They test their method by applying an ultrasound signal (1 MHz) to a saline chamber containing a sample (a polycarbonate block) that is placed in a 4 T static magnetic field. The sample motion is caused by the ultrasonic wave. They measure the induced voltage with electrodes, and are able to obtain clear signals corresponding to the upper and lower surfaces of the sample. Roth and Wikswo15 have questioned whether the “Hall effect” is the correct name of the physical mechanism underlying this phenomenon, but in any case the technique represents a novel and important application of Lorentz forces to biomedical imaging.
Figure 3.
A Motion-Induced Voltage. Tissue is moving with speed v to the right in the presence of a magnetic field B directed out of the paper. Negative ions experience an upward Lorentz force, and positive ions experience a downward Lorentz force. The resulting charge separation produces a negative voltage at the top of the tissue and a positive voltage at the bottom.
A reverse “Hall effect” imaging technique is possible, with the current driven by a voltage source and the motion produced by the Lorentz force (like in magneto-acoustic imaging). Wen et al.12 write that “in the reverse mode, or ultrasound detection mode, the pulser that was used to drive the ultrasound transducer is now connected to the pair of electrodes that were used to detect the … voltage in the forward mode, and the signal-sensing electronics are connected to the transducer. When the pulser generates a voltage pulse across the electrodes, [it produces] a current density proportional to the local apparent conductivity. At interfaces of changing conductivity the current density becomes discontinuous, and so are the Lorentz forces on the currents … [resulting] in ultrasound pulses emanating from these interfaces.” They use this method to obtain images of the fat-muscle layers in bacon (Fig. 4). Roth and Wikswo15 analyze this reverse method, and derive a wave equation for the ultrasonic pressure signal similar to Eq. 2 above
Figure 4.
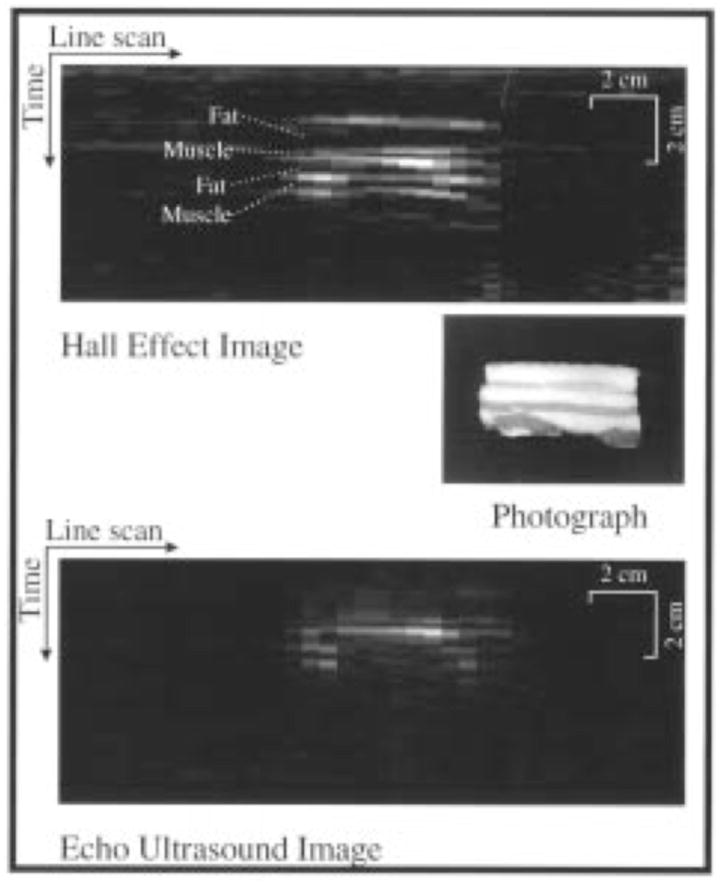
A photograph of the cross section of a block of bacon, an image of the bacon collected with the reverse-mode Hall effect imaging technique, and an echo ultrasound image of the same cross section. From Wen et al.12. (© 1998 IEEE)
| (4) |
where c is the speed of sound in the tissue. They conclude that15 “much of what we learned from a quasistatic analysis of magneto-acoustic imaging can be applied [to] the second [reverse] imaging method proposed by Wen et al.”
Ultrasonically-Induced Lorentz Force to Image Conductivity
Inspired by Wen et al.’s method, Amalric Montalibet and his co-workers16,17 further developed “ultrasonically-induced Lorentz force” methods to measure electrical conductivity (Fig. 5). The gist of their technique is the same as described by Wen et al.: “the ions of solutions exposed to the propagation of ultrasound in the presence of a magnetic field experience Lorentz force. Their movement gives rise to a local electric current density, which is proportional to the electric conductivity of the medium … The magnitude of the measured current is 50 nA in a saline solution of 0.5 S/m conductivity. The technique enabled the determination of the conductivity of porcine blood sample against haematocrit”17.
Figure 5.
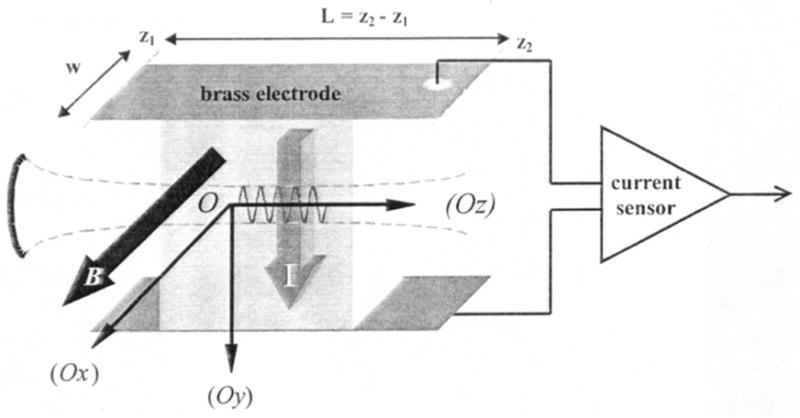
Schematic diagram of the experimental setup for detection of currents caused by the ultrasonically-induced Lorentz force. Axis Oz is the ultrasound propagation axis, Ox has the same orientation as the magnetic field, and the interaction current is positive along Oy. The origin, O, is located at the focal point of the transducer. From Montalibet et al.16.
Whereas Montalibet et al. 16,17 apply pulsed ultrasound in their experiments, Roth and Schalte18 derive a tomographic method to obtain the tissue conductivity using continuous-wave ultrasound. The strength and timing of the electric dipole caused by the ultrasonically-induced Lorentz force determines the amplitude and phase of the Fourier transform of the conductivity image. Electrical measurements at a variety of wavelengths and directions is therefore equivalent to mapping the Fourier transform of the conductivity distribution in spatial frequency space. An image of the conductivity itself is then found by taking the inverse Fourier transform. In an alternative approach, Haider et al.19 have examined this problem from the point of view of lead fields. Interestingly, Olaffson et al.20 have shown that an ultrasonic wave can itself modify the conductivity, and this effect may need to be taken into account during conductivity imaging.
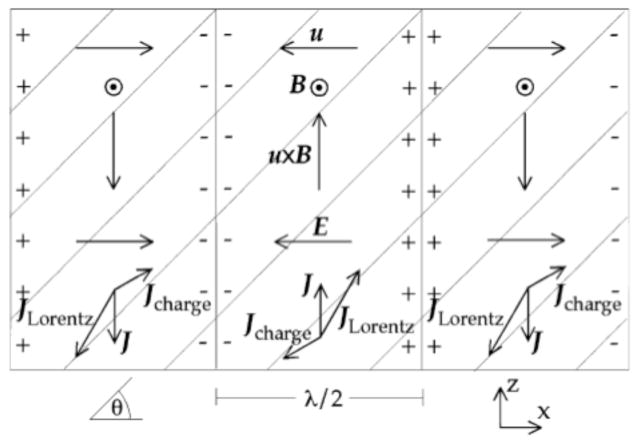
Tseng and Roth21 described a novel feature of the ultrasonically-induced Lorentz force in anisotropic tissue: an oscillating electrical potential propagates along with the ultrasonic wave. This potential is analogous to ultrasonic vibration potentials arising from differences in inertia between positive and negative charge carriers in colloidal suspensions or ionic solutions22, but it is caused by a different mechanism. Figure 6 shows three half-wavelengths of an ultrasonic wave that is propagating to the right in a magnetic field coming out of the paper. The current density due to the Lorentz force tilts away from the z direction because of the anisotropy (the diagonal lines indicate the fiber direction). This causes positive charge to accumulate where the current vectors converge, and negative charge where they diverge. The charge produces its own electric current and potential that oscillates with the ultrasonic wave.
Figure 6.
Three half wavelengths of an ultrasonic wave propagating to the right. The magnetic field, B, is coming out of the paper, and the displacement, u, is along the x-axis. The current density caused by the Lorentz force, JLorentz, is rotated by the tissue anisotropy (fiber axis indicated by diagonal lines), producing a current density and electrical potential caused by charge, Jcharge. From Tseng and Roth21.
Magneto-Acoustic Tomography with Magnetic Induction
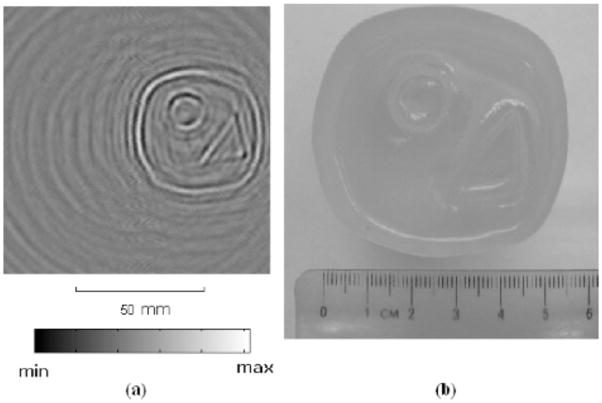
Recently, Bin He and his colleagues have developed magneto-acoustic methods for measuring impedance23–31. The novel feature of their method is that they induce eddy currents in the sample using magnetic induction (Faraday’s law: a changing magnetic field induces an electric field). “The sample is located in a static magnetic field and a time-varying magnetic field. The time-varying magnetic field induces an eddy current in the sample. Consequently, the sample will emit ultrasonic waves by the Lorentz force. The ultrasonic signals are collected around the object to reconstruct images related to the electrical impedance distribution in the sample”23. Li et al.25 obtained conductivity boundary images with high spatial resolution from saline and gel phantoms (Fig. 7), indicating the feasibility of their method, which they call Magneto-Acoustic Tomography with Magnetic Induction (MAT-MI). Brinker and Roth32 analyzed MAT-MI and found that when imaging nerve or muscle, electrical anisotropy can have a significant effect on the acoustic signal and must be accounted for in order to obtain accurate images. Ammari et al.11 have examined MAT-MI reconstruction methods mathematically.
Figure 7.
(a) The two-dimensional MAT-MI image of a gel phantom, with two columns of 0% salinity gel embedded in gel of 10% salinity. (b) Top view photo of the phantom. From Li et al.25. (© 2007 IEEE)
Lorentz Force Imaging of Action Currents Using MRI
Allen Song and his co-workers33–35 have proposed a method for MRI detection of biocurrents, called “Lorentz effect imaging.” When exposed to a magnetic field, current in the body is subject to the Lorentz force (Fig. 1). This force deforms the tissue, causing the current-carrying nerve fibers to move. When a magnetic field gradient is present, this movement displaces the nerve into a region of different magnetic field strength. If the change in magnetic field is large enough, it causes an artifact in a magnetic resonance signal that can be used to locate the active neurons. Song and Takahashi33 demonstrate this method by imaging the movement of a copper wire in a gel phantom using MRI. More recently, Truong and Song35 applied “a series of oscillating gradients (with positive and negative lobes of the same amplitude and duration) in synchrony with the neural stimulation, such that the neuroelectric activity occurs only during the negative lobes.” They conclude that “the successful detection of neuroelectric activity in vivo by using our technique demonstrates that neural activation can be imaged noninvasively by MRI with a high spatial and temporal resolution.” Basford et al.36 have also examined Lorentz-force-induced motion during magnetic resonance imaging.
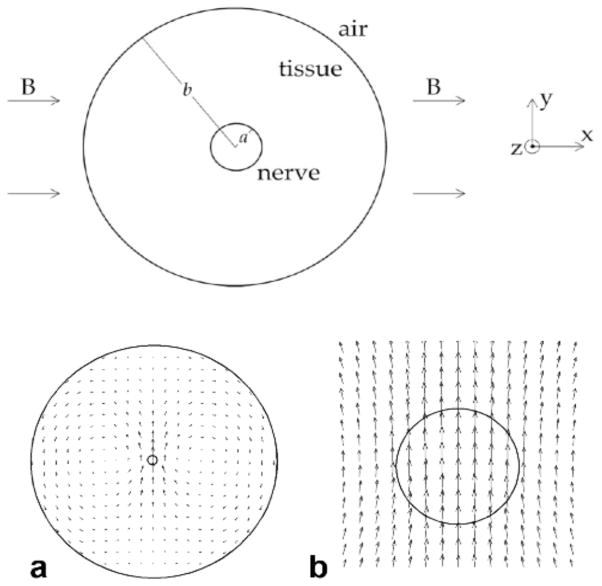
Roth and Basser37 analyze Lorentz force MRI, and predict that the peak displacement u of a nerve of radius a in an arm of radius b is
| (5) |
where B is the magnetic field, J is the current density, and G is the shear modulus. Using realistic parameters for a human medial nerve in a 4 T field, they calculate a maximum displacement of 13 nm or less, and find a displacement distribution that is not localized around the nerve (Fig. 8). They suggest that this displacement is too small and diffuse to be detected by MRI methods. In fact, the biomagnetic fields produced by action currents should result in a larger artifact in the MRI than that caused by the Lorentz effect38, and whether such biomagnetic fields can be used with MRI to image action currents remains an open question39. Analysis of the Lorentz effect on ions in solution is similarly controversial40,41, and magnetohydrodynamic effects may be important in this case42.
Figure 8.
Top: A nerve of radius a lying in an arm of radius b. The magnetic field is in the x direction. Current inside the nerve flows in the positive z direction (out of the page) and the current in the surrounding tissue flows in the negative z direction. Bottom: The displacement caused by the Lorentz force. (a) The entire arm, and (b) a detailed view of the displacement around the nerve. The length of the displacement arrows are exaggerated for easy viewing. From Roth and Basser37.
Conclusion
The Lorentz force is a new tool for obtaining images of current and conductivity in tissue. In general, these forces and the resulting displacements are small. The most promising results to date result from working at high frequencies, where the oscillating force gives rise to ultrasonic waves that can be detected even if the underlying displacement is very small. Conductivity imaging can be performed in two ways: using an oscillating Lorentz force to generate ultrasound images (Fig. 1), or applying ultrasound and detecting the resulting electrical signal (Fig. 3). It is not yet clear which of these methods will be most useful in biomedical imaging. Lorentz force methods to measure current have interesting analogies to biomagnetic methods, and share many of the same strengths and weaknesses. These methods generally require strong magnetic fields, which may be difficult and expensive to produce. They do, however, take advantage of and combine many of the strengths of both bioelectric and biomagnetic techniques with well-established ultrasonic imaging methods. Magneto-acoustic techniques to measure current would compete with established methods such as the electrocardiogram, the magnetocardiogram, the electroencephalogram, and the magnetoencephalogram. Methods to measure conductivity would provide similar information as electrical impedance imaging.
In summary, a growing number of imaging techniques are based on the Lorentz force, and these methods provide great promise for obtaining images of current and conductivity.
Acknowledgments
I thank Steffan Puwal and Katherine Roth for their comments on this manuscript. I also thank Bruce Towe, Han Wen, Amalric Montalibet, and Xu Li for permission to reproduce their figures in this review. This work was supported by the National Institutes of Health grant R01EB008421.
References
- 1.Hobbie RK, Roth BJ. Intermediate Physics for Medicine and Biology. 4. New York: Springer; 2007. [Google Scholar]
- 2.Schenck JF. Safety of strong static magnetic fields. J Mag Reson Imag. 2000;12:2–19. doi: 10.1002/1522-2586(200007)12:1<2::aid-jmri2>3.0.co;2-v. [DOI] [PubMed] [Google Scholar]
- 3.Wikswo JP, Jr, Barach JP. An estimate of the steady magnetic field strength required to influence nerve conduction. IEEE Trans Biomed Eng. 1980;27:722–723. doi: 10.1109/TBME.1980.326598. [DOI] [PubMed] [Google Scholar]
- 4.Sekino M, Tatsuoka H, Yamaguchi S, Eguchi Y, Ueno S. Effects of strong static magnetic fields on nerve excitation. IEEE Trans Mag. 2006;42:3584–3586. [Google Scholar]
- 5.Frankel RB, Blakemore RP, Wolfe RS. Magnetite in freshwater magnetotactic bacteria. Science. 1979;203:1355–1356. doi: 10.1126/science.203.4387.1355. [DOI] [PubMed] [Google Scholar]
- 6.Towe BC, Islam MR. A magneto-acoustic method for noninvasive measurement of bioelectric currents. IEEE Trans Biomed Eng. 1988;35:892–894. doi: 10.1109/10.7300. [DOI] [PubMed] [Google Scholar]
- 7.Islam MR, Towe BC. Bioelectric current image reconstruction from magento-acoustic measurements. IEEE Trans Med Imag. 1988;7:386–391. doi: 10.1109/42.14523. [DOI] [PubMed] [Google Scholar]
- 8.Towe BC. Investigation of a lorentz force biomagnetometer. IEEE Trans Biomed Eng. 1997;44 :455–461. doi: 10.1109/10.581933. [DOI] [PubMed] [Google Scholar]
- 9.Roth BJ, Basser PJ, Wikswo JP., Jr A theoretical model of magneto-acoustic imaging of bioelectric currents. IEEE Trans Biomed Eng. 1994;41:723–728. doi: 10.1109/10.310087. [DOI] [PubMed] [Google Scholar]
- 10.Ohayan J, Chadwick RS. Effects of collagen microstructure on the mechanics of the left ventricle. Biophys J. 1988;54:1077–1088. doi: 10.1016/S0006-3495(88)83044-3. [DOI] [PMC free article] [PubMed] [Google Scholar]
- 11.Ammari H, Capdeboscq Y, Kang H, Kozhemyak A. Mathematical models and reconstruction methods in magneto-acoustic imaging. Euro J Appl Math. 2009;20:303–317. [Google Scholar]
- 12.Wen H, Shah J, Balaban RS. Hall effect imaging. IEEE Trans Biomed Eng. 1998;45:119–124. doi: 10.1109/10.650364. [DOI] [PMC free article] [PubMed] [Google Scholar]
- 13.Wen H. Volumetric Hall effect tomography—a feasibility study. Utrasonic Imaging. 1999;21 :186–200. doi: 10.1177/016173469902100303. [DOI] [PMC free article] [PubMed] [Google Scholar]
- 14.Wen H. Feasibility of biomedical applications of Hall effect imaging. Ultrasonic Imaging. 2000;22:123–136. doi: 10.1177/016173460002200204. [DOI] [PubMed] [Google Scholar]
- 15.Roth BJ, Wikswo JP., Jr Comments on “Hall effect imaging”. IEEE Trans Biomed Eng. 1998;45 :1294–1295. doi: 10.1109/10.720207. [DOI] [PubMed] [Google Scholar]
- 16.Montalibet A, Jossinet J, Matias A. Scanning electric conductivity gradients with ultrasonically-induced lorentz force. Ultrasonic Imaging. 2001;23:117–132. doi: 10.1177/016173460102300204. [DOI] [PubMed] [Google Scholar]
- 17.Montalibet A, Jossinet J, Matias A, Cathignol D. Electric current generated by ultrasonically induced lorentz force in biological media. Med Biol Eng Comput. 2001;39:15–20. doi: 10.1007/BF02345261. [DOI] [PubMed] [Google Scholar]
- 18.Roth BJ, Schalte K. Ultrasonically-induced Lorentz force tomography. Med Biol Eng Comput. 2009;47:573–577. doi: 10.1007/s11517-009-0476-6. [DOI] [PMC free article] [PubMed] [Google Scholar]
- 19.Haider S, Hrbek A, Xu Y. Magneto-acousto-electrical tomography: A potential method for imaging current density and electrical impedence. Physiol Meas. 2008;29:S41–S50. doi: 10.1088/0967-3334/29/6/S04. [DOI] [PubMed] [Google Scholar]
- 20.Olafsson R, Witte RS, Huang S-W, O’Donnell M. Ultrasound current source density imaging. IEEE Trans Biomed Eng. 2008;55:1840–1848. doi: 10.1109/TBME.2008.919115. [DOI] [PMC free article] [PubMed] [Google Scholar]
- 21.Tseng N, Roth BJ. The potential induced in anisotropic tissue by the ultrasonically-induced Lorentz force. Med Biol Eng Comput. 2008;46:195–197. doi: 10.1007/s11517-007-0292-9. [DOI] [PubMed] [Google Scholar]
- 22.Beveridge AC, Wang S, Diebold GJ. Imaging based on the ultrasonic vibration potential. Appl Phys Lett. 2004;85:5466–5468. [Google Scholar]
- 23.Xu Y, He B. Magnetoacoustic tomography with magnetic induction (MAT-MI) Phys Med Biol. 2005;50:5175–5187. doi: 10.1088/0031-9155/50/21/015. [DOI] [PMC free article] [PubMed] [Google Scholar]
- 24.Li X, Xu Y, He B. Magnetoacoustic tomography with magnetic induction for imaging electrical impedance of biological tissue. J Appl Phys. 2006;99:066112. doi: 10.1063/1.2186371. [DOI] [PMC free article] [PubMed] [Google Scholar]
- 25.Li X, Xu Y, He B. Imaging electrical impedance from acoustic measurements by means of magnetoacoustic tomography with magnetic induction (MAT-MI) IEEE Trans Biomed Eng. 2007;54:323–330. doi: 10.1109/TBME.2006.883827. [DOI] [PubMed] [Google Scholar]
- 26.Xia R, Li X, He B. Magnetoacoustic tomographic imaging of electrical impedance with magnetic induction. Appl Phys Lett. 2007;91:083903. doi: 10.1063/1.2772763. [DOI] [PMC free article] [PubMed] [Google Scholar]
- 27.Ma Q, He B. Investigation on magnetoacoustic signal generation with magnetic induction and its application to electrical conductivity reconstruction. Phys Med Biol. 2007;52:5085–5099. doi: 10.1088/0031-9155/52/16/025. [DOI] [PubMed] [Google Scholar]
- 28.Ma QY, He B. Magnetoacoustic tomography with magnetic induction: A rigorous theory. IEEE Trans Biomed Eng. 2008;55:813–816. doi: 10.1109/TBME.2007.912674. [DOI] [PMC free article] [PubMed] [Google Scholar]
- 29.Li X, Li X, Zhu SN, He B. Solving the forward problem of magnetoacoustic tomography with magnetic induction by means of the finite element method. Phys Med Biol. 2009;54 :2667–2682. doi: 10.1088/0031-9155/54/9/005. [DOI] [PMC free article] [PubMed] [Google Scholar]
- 30.Xia RM, Li X, He B. Reconstruction of vectorial acoustic sources in time-domain tomography. IEEE Trans Med Imag. 2009;28:669–675. doi: 10.1109/TMI.2008.2008972. [DOI] [PMC free article] [PubMed] [Google Scholar]
- 31.Xia RM, Li X, He B. Comparison study of three different image reconstruction algorithms for MAT-MI. IEEE Trans Biomed Eng. 2010;57:708–713. doi: 10.1109/TBME.2009.2034637. [DOI] [PMC free article] [PubMed] [Google Scholar]
- 32.Brinker K, Roth BJ. The effect of electrical anisotropy during magnetoacoustic tomography with magnetic induction. IEEE Trans Biomed Eng. 2008;55:1637–1639. doi: 10.1109/TBME.2007.914001. [DOI] [PubMed] [Google Scholar]
- 33.Song AW, Takahashi AM. Lorentz effect imaging. Magn Res Imag. 2001;19:763–767. doi: 10.1016/s0730-725x(01)00406-4. [DOI] [PubMed] [Google Scholar]
- 34.Truong T-K, Wilbur JL, Song AW. Synchronized detection of minute electrical currents with MRI using Lorentz effect imaging. J Magn Res. 2006;179:85–91. doi: 10.1016/j.jmr.2005.11.012. [DOI] [PMC free article] [PubMed] [Google Scholar]
- 35.Truong T-K, Song AW. Finding neuroelectric activity under magnetic-field oscillations (NAMO) with magnetic resonance imaging in vivo. PNAS. 2006;103:12598–12601. doi: 10.1073/pnas.0605486103. [DOI] [PMC free article] [PubMed] [Google Scholar]
- 36.Basford AT, Basford JR, Kugel J, Ehman RL. Lorentz-force-induced motion in conductive media. Magn Reson Imaging. 2005;23:647–651. doi: 10.1016/j.mri.2005.02.014. [DOI] [PubMed] [Google Scholar]
- 37.Roth BJ, Basser PJ. Mechanical model of neural tissue displacement during Lorentz effect imaging. Magn Reson Med. 2009;61:59–64. doi: 10.1002/mrm.21772. [DOI] [PMC free article] [PubMed] [Google Scholar]
- 38.Mei Y, Roth BJ. Displacements caused by eddy currents induced during magnetic resonance imaging. Meeting of Minds Journal of Undergraduate Research. 2010 (in press) [Google Scholar]
- 39.Bandettini PA, Petridou N, Bodurka J. Direction detection of neuronal activity with MRI: Fantasy, possibility, or reality. Appl Magn Reson. 2005;29:65–88. [Google Scholar]
- 40.Truong TK, Avram A, Song AW. Lorentz effect imaging of ionic currents in solution. J Magn Reson. 2008;191:93–99. doi: 10.1016/j.jmr.2007.12.005. [DOI] [PubMed] [Google Scholar]
- 41.Wijesinghe R, Roth BJ. Lorentz effect imaging of ionic currents in solution using correct values for ion mobility. J Magn Reson. 2010;204:225–227. doi: 10.1016/j.jmr.2010.02.024. [DOI] [PMC free article] [PubMed] [Google Scholar]
- 42.Scott GC, Joy MLG, Armstrong RL, Henkelman RM. Measurement of non-uniform current density by magnetic resonance. IEEE Trans Med Imag. 1991;10:362–374. doi: 10.1109/42.97586. [DOI] [PubMed] [Google Scholar]


