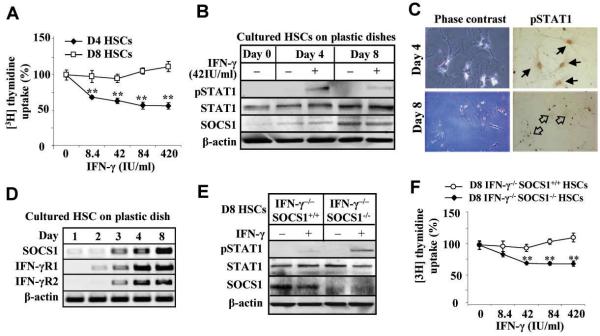
Fig. 5.
D8 HSCs are resistant to IFN-γ stimulation due to induction of SOCS1. HSCs were cultured for 4 days (D4 HSCs) or 8 days (D8 HSCs). (A) D4 and D8 HSCs were treated with IFN-γ and [3H] thymidine uptake was determined. D4 and D8 HSCs was treated with IFN-γ for 30 min, followed by Western blot analysis (B) or immunocytochemistry analyses (C) with anti-pSTAT1, STAT1 or SOCS1 antibodies. In panel C, the black arrows indicate positive pSTAT1 staining in the nuclei. Open arrows indicate negative staining. (D) RT-PCR analyses of cultured HSCs. (E) Western blot analyses of D8 IFN-γ−/−SOCS1+/+ and IFN-γ−/−SOCS1−/− HSCs treated with IFN-γ for 30 min. (F) [3H] thymidine uptake analyses of D8 IFN-γ−/−SOCS1+/+ and IFN-γ−/−SOCS1−/− HSCs treated with IFN-γ. **P<0.01 compared with corresponding groups.

