Abstract
Allergic airway diseases represent a complex health problem which can be exacerbated by the synergistic action of pollen particles and air pollutants such as ozone. Understanding human exposures to aeroallergens requires accurate estimates of the spatial distribution of airborne pollen levels as well as of various air pollutants at different times. However, currently there are no established methods for estimating allergenic pollen emissions and concentrations over large geographic areas such as the United States. A mechanistic modeling system for describing pollen emissions and transport over extensive domains has been developed by adapting components of existing regional scale air quality models and vegetation databases. First, components of the Biogenic Emissions Inventory System (BEIS) were adapted to predict pollen emission patterns. Subsequently, the transport module of the Community Multiscale Air Quality (CMAQ) modeling system was modified to incorporate description of pollen transport. The combined model, CMAQ-pollen, allows for simultaneous prediction of multiple air pollutants and pollen levels in a single model simulation, and uses consistent assumptions related to the transport of multiple chemicals and pollen species. Application case studies for evaluating the combined modeling system included the simulation of birch and ragweed pollen levels for the year 2002, during their corresponding peak pollination periods (April for birch and September for ragweed). The model simulations were driven by previously evaluated meteorological model outputs and emissions inventories for the eastern United States for the simulation period. A semi-quantitative evaluation of CMAQ-pollen was performed using tree and ragweed pollen counts in Newark, NJ for the same time periods. The peak birch pollen concentrations were predicted to occur within two days of the peak measurements, while the temporal patterns closely followed the measured profiles of overall tree pollen. For the case of ragweed pollen, the model was able to capture the patterns observed during September 2002, but did not predict an early peak; this can be associated with a wider species pollination window and inadequate spatial information in current land cover databases. An additional sensitivity simulation was performed to comparatively evaluate the dispersion patterns predicted by CMAQ-pollen with those predicted by the Hybrid Single-Particle Lagrangian Integrated Trajectory (HYSPLIT) model, which is used extensively in aerobiological studies. The CMAQ estimated concentration plumes matched the equivalent pollen scenario modeled with HYSPLIT. The novel pollen modeling approach presented here allows simultaneous estimation of multiple airborne allergens and other air pollutants, and is being developed as a central component of an integrated population exposure modeling system, the Modeling Environment for Total Risk studies (MENTOR) for multiple, co-occurring contaminants that include aeroallergens and irritants.
Keywords: bioaerosols, pollen emission, pollen dispersion, mesoscale model, birch allergy, ragweed allergy
1. Introduction
Allergic airway diseases (AAD), such as allergic rhino conjunctivitis and asthma, are a major cause of increased demands on health care resources, and of productivity loss (Schoenwetter et al., 2004; Lamb et al., 2006). The overall prevalence of seasonal allergic rhinitis in Europe and the United States is approximately 15% (Aas et al., 1997; Nathan et al., 1997). Sensitization to pollen allergens is increasing in most developed countries, and synergism with other common atmospheric pollutants has also been identified (WHO, 2003; Adhikari et al., 2006), though the mechanisms of interactions have not been fully understood (Behrendt and Becker, 2001). Exposures to aeroallergens and other co-stressors can be reduced by preventive actions, such as planning outdoor activity to avoid peak exposure periods (Hugg and Rantio-Lehtimäki, 2007). This requires an accurate forecasting of atmospheric levels of these pollutants through numerical simulation models that use information on emissions and meteorological factors, and simulate pollutant transport and transformation. Forecasts of air pollutants are currently obtained by applying meterological forecasting modeling coupled with predictive photochemical air quality modeling (Otte et al., 2005), but these forecasts do not include bioaerosols such as pollen.
Modeling of pollen emissions and dispersion remains a challenging task (Jones and Harrison, 2004; Kuparinen, 2006), and currently there are no established methods for modeling ambient concentrations, population exposures, and doses to pollen and co-occurring aeroallergens. While it is generally accepted that most pollen registered by observational networks comes from local sources (Sofiev et al., 2006), there is growing evidence of long-range transport of pollen (Ranta et al., 2006; Skjøth et al., 2007). Recent advancements in meteorological models and land cover databases provide the potential for creating high spatial and temporal resolution forecasts of pollen concentrations using source-oriented methods (Pasken and Pietrowicz, 2005). Table 1 summarizes modeling studies that have focused on large-scale emissions and long-range transport of pollen. However, the capabilities of such databases and models have been explored solely on individual tree species and are not directly amenable to studying population exposures to multiple aero-allergens and/or simultaneously with other air pollutants.
Table 1.
Modeling studies focusing on large-scale emissions and long-range transport of pollen
| Study and Location | Resolution & layers in the vertical dimension |
Plant Species |
Pollen Emissions Modeling |
Vegetation Databases |
Meteorology | Pollen Transport Modeling |
|---|---|---|---|---|---|---|
| Kawashima and Takahashi (1999), Japan | (10×10 km), 2-D | Cedar | Meteorological parameterization | Forest maps and remote sensing | AMeDAS1 weather stations | Gaussian model |
| Helbig et al. (2004), Germany | (4×4 km), 35 | Hazel, Alder | Meteorological parameterization | Forest maps | KAMM 3-D model2 | DRAlS CTM2 |
| Pasken and Pietrowicz (2005), U.S.A. | (12×12 km), 8 | Oak | Uniform diurnal profile | BELD3.1 database | MM5, Eta 3-D models | HYSPLIT model |
| Sofiev et al. (2006), Finland | (1×1 km), single surface layer | Birch | Phenological observations | CORINE3, PELCOM4, Forest surveys | SILAM model5 | SILAM model |
| Schueler and Schlünzen (2006), Germany | (500×500 m), 32 | Oak | Meteorological parameterization | Forest maps | METRAS model6 | METRAS model |
| Vogel et al. (2008), Switzerland | (7×7 km), 40 | Birch | Meteorological parameterization | National Forest Inventory | COSMO model7 | ART model8 |
| CMAQ-Pollen presented here | 12×12 km, 22 | Birch, Ragweed | Meteorological parameterization | BELD3.1, PLANTS, MODIS LAI | MM5 model | CMAQ model |
Automated Meteorological Data Acquisition System,
Karlsruhe Meteorological Model, 3.D regional model
Coordinated Information System on the State of the Environment and Natural Resources,
Pan-European Land Use and Land Cover Monitoring
Finnish Meteorological Institute Air Quality and Emergency Modelling System,
Meteorological Institute Mesoscale Model, University of Hamburg
Operational weather forecast model of the German Weather Service (DWD),
Aerosols and Reactive Trace gas model
In general, assessing population exposures to air pollutants requires estimates of pollutant concentration levels at multiple geographic locations. Eulerian grid-based air quality modeling is a logical choice for studying multiple, interacting pollutants because it considers spatially and temporally varying fields of emissions, and predicts concentrations at regular space and time intervals, based on inputs of emissions and meteorology. The aim of this study is to develop a consistent modeling system for characterizing emissions, fate and transport of pollen, co-occurring aeroallergens, and other potentially relevant airborne contaminants, with a subsequent goal of integrating this system within a population exposure and dose modeling framework for multiple air pollutants (Georgopoulos et al., 2005). This is pursued by adapting modules and approaches from existing air quality modeling systems for emissions, meteorology, and pollutant transport. Initial focus of the effort was on birch (Betula) and ragweed (Ambrosia) pollen, since they represent two major types of pollen to which people are commonly exposed, and they represent two extremes with respect to pollen release heights, transport ranges, and pollination seasons.
2. Methods
Components of currently used regulatory air quality modeling systems were adapted for studying pollen transport in a manner consistent with the transport and transformation of other air pollutants. Specifically, databases and modules from existing biogenic emissions models were adapted and augmented by pollen species-specific equations to develop spatial and temporal trends of pollen emissions. The Mesoscale Meteorological Model (MM5) (Grell et al., 1994), was used to provide the underlying meteorological inputs that affect both the release patterns and the transport of pollen. Parameterization of the emission flux was based on existing methodologies developed for particle escape from forest canopies. Finally, the widely-used regulatory photochemical air quality model, the Community Multiscale Air Quality (CMAQ) model (Byun and Ching, 1999; Byun and Schere, 2006), was adapted for simulating pollen transport. The importance of employing a full-chemistry model lies in addressing potential co-exposures to allergens and regular air pollutants in future setups coupled with population exposure and dose frameworks for multiple air pollutants. Although the mechanism of protein nitration is not fully understood, there is evidence of pollen interacting with atmospheric nitrogen dioxide and ozone (Franze et al., 2005). The potential effects of air pollution on pollen allergenicity enhance the relevance of implementing complete atmospheric chemistry in the prototype system. The same methodology along with the supporting land use and vegetation databases were evaluated for studying birch and ragweed pollen transport. Further rationale for the use of these models, and detailed descriptions of the modifications implemented in them, are presented in the following sections.
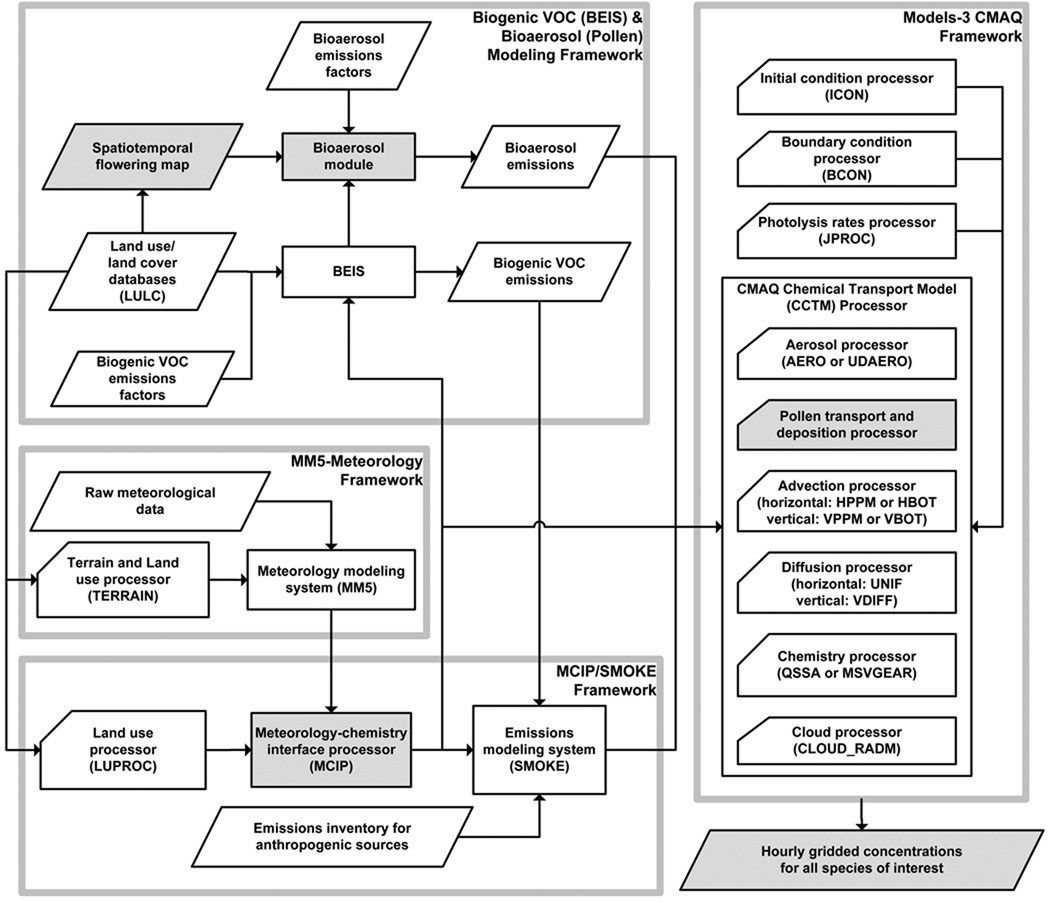
The schematic flowchart of the new pollen emissions module as a part of the Biogenic Emission Inventory System (BEIS) methodology, coupled with the CMAQ modeling framework for common atmospheric pollutants is presented in Figure 1. The MM5 simulation used in this study was performed under the auspices of the Ozone Transport Commission (OTC) for the entire year of 2002 (OTC, 2007). The simulation results have been evaluated with observations and were found to agree closely (Hogrefe et al., 2008; NYSDEC, 2006). The estimates of meteorological parameters corresponding to April and September time periods were used to determine the pollination window and phenological stage of each species. Atmospheric transport and chemistry simulations were carried out for each case during the selected months. Photochemical modeling simulations for the months of interest were driven by meteorological fields generated by the MM5 model for the same computational domains and time periods. Further investigation of the pollen particle dispersal was performed by comparing the CMAQ-MM5 coupling to Hybrid Single-Particle Lagrangian Integrated Trajectory (HYSPLIT) model (Draxler and Hess, 1998), coupled with MM5 in a single-cell source scenario. The following subsections describe the related databases, models and parameterization details implemented for the study area and species of interest.
Figure 1.
Schematic flowchart depicting the modeling methodology for bioaerosols (e.g. aeroallergens, pollen particles, spores) developed in this work for use within the CMAQ-MM5 modeling framework for air quality studies.
2.1. Modeling the emission of pollen
Large-scale pollen emission patterns depend on land cover and meteorological conditions and are governed by multiple species-specific factors. The modeling methodology that is presented here considers seasonal parameters that define the pollination window (mean seasonal pollen production, heat sums), as well as the circadian rhythms that govern the diurnal cycle of the emission profile (wind, temperature, humidity). Several studies have described the emissions flux in terms of algebraic functions of these parameters (Kawashima and Takahashi, 1999; Helbig et al., 2004; Sofiev et al., 2006). Due to the lack of an adequate pollen monitoring network to couple with such modeling approaches, the majority of the existing implementations follow simple formulations to characterize source strength. Nevertheless, such applications provide a solid framework to simulate the evolution of seasonal pollinosis utilizing existing components of air quality systems at the regional scale.
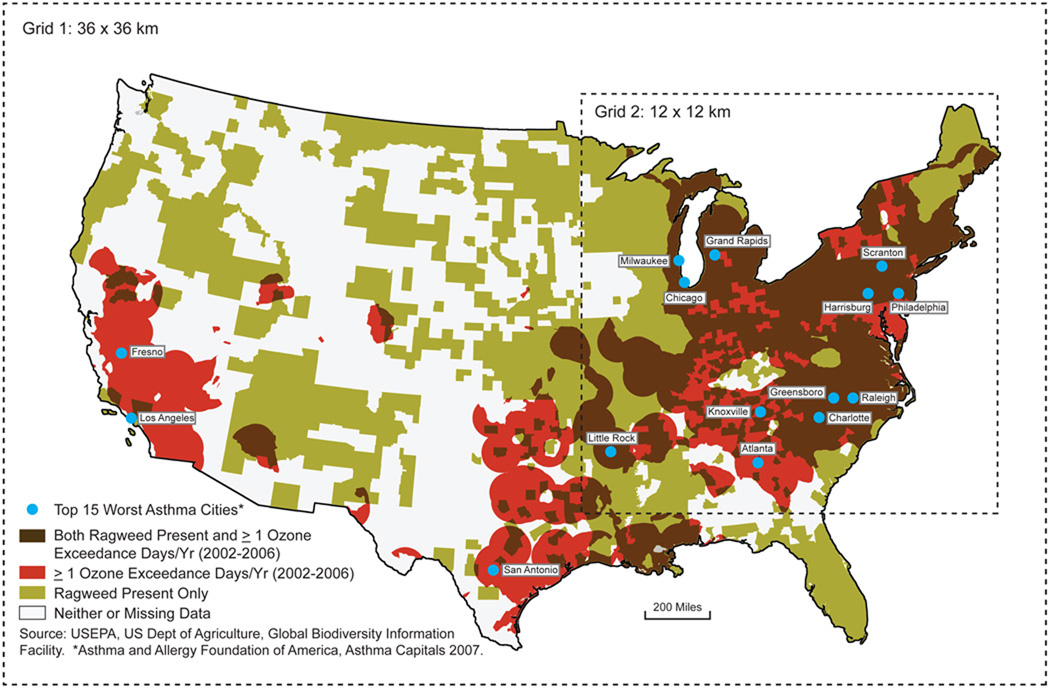
In this work, an algorithm for estimating species-specific emissions of pollen particles in the United States was developed by adapting modules used in the regulatory biogenic emissions models, the BEIS model (Pierce, 1991) and the Model of Emissions of Gases and Aerosols from Nature (MEGAN) (Guenther et al., 2006). The diurnal cycle was constructed from literature sources relevant to the species of interest, based on the daily temporal resolution of the available measurements (Mahura et al., 2009; Hout et al., 2008; Raynor and Hayes, 1970). A similar approach was followed for the climatological rate of release and the meteorological correction factors that have been described in the literature (Helbig et al., 2004; Sofiev et al., 2006). To achieve a proper emission characterization, this work takes into account local meteorological measurements before proceeding with the dispersion simulations. The pollen module also incorporates information from long-term pollen measurements (such as those conducted at the UMDNJ Newark pollen monitoring site - 40.7416N,74.1914W), which provide typical daily counts for total tree, grass, and weed species with explicit identification of ragweed (Port et al., 2006). As described in the following, CMAQ was modified to include pollen sources calculated using BEIS components and meteorology modeled at the regional scale with MM5. As part of the episodic modeling implementation, the emissions algorithm was applied to study the birch pollen and ragweed pollen emission and dispersion during April 2002 and September 2002, respectively. The area of interest covers the Northeast US and is represented by the inner grid (12-km spatial resolution) of the modeling domain shown in Figure 2.
Figure 2.
Intersection of “ragweed-positive” and “8-hour ozone exceedance-positive” areas in the United States. The nested MM5 and CMAQ grid setup which was used for meteorological and pollen emission and dispersion simulations is also depicted. (Adapted from a map published by NRDC, the Natural Resources Defense Council, www.nrdc.org (Knowlton et al., 2007)).
2.2. Meteorological modeling using the MM5 model
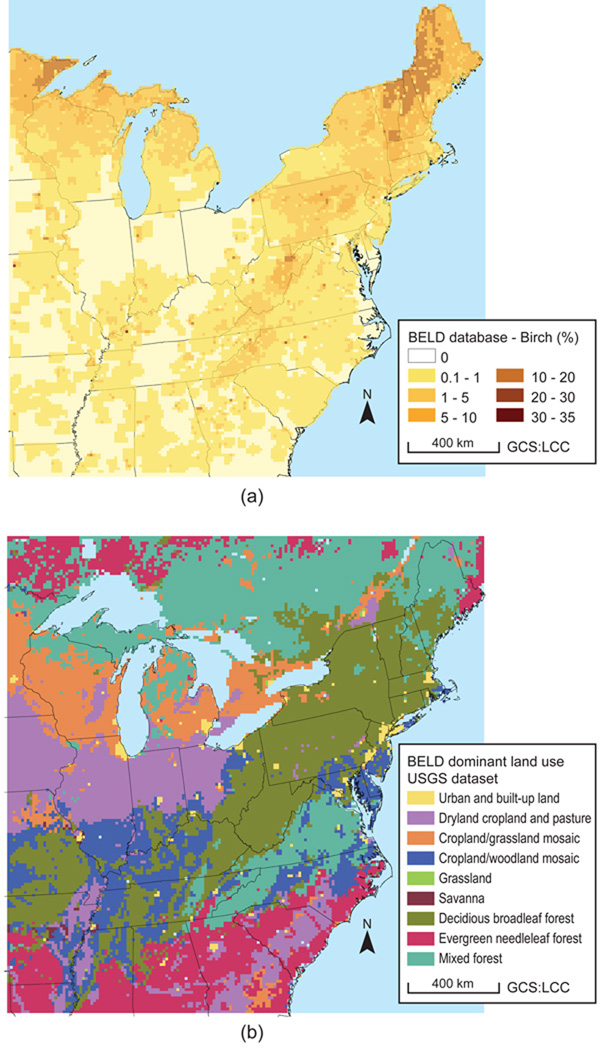
The MM5 mesoscale atmospheric model (Grell et al., 1994) has been widely used to generate meteorological inputs for air quality modeling studies. Meteorological fields generated for the OTC modeling domain featured the nested domains presented in Figure 2. Among the physics options chosen for the MM5 simulations were the Kain-Fritsch convective scheme for both 36-km and 12-km domains (Kain, 2004), the simple ice explicit moisture scheme containing prognostic equations for cloud water (ice) and rainwater (snow) (Dudhia, 1989; Zhang, 1989), the modified version of the Blackadar planetary boundary layer (PBL) scheme (Zhang and Anthes, 1982; Zhang, 1989), the simple radiative cooling scheme (Grell et al., 1994), and the multi-layer soil model to predict land surface temperature using the surface energy budget equation (Dudhia, 1996). In the MM5 simulation, there were 29 layers in the vertical dimension ranging from the surface to the height corresponding to a pressure of 50 mb, with the height of the lowest layer approximately 20 m, and a total of 16 layers below 3 km. The USGS land use and land cover (LULC) database, that was utilized in the MM5 setup, is the same component of the Biogenic Emissions Landcover Database version 3.1 (BELD3) presented in Figure 3b. Additional details on the MM5 model setup and evaluation can be found in the literature (OTC, 2007).
Figure 3.
Mapped components of the BELD3 database used to classify different zones of birch and ragweed pollen sources within the OTC domain: (a) Birch tree areal coverage used for the spring simulations, and (b) Dominant land use-land cover from the USGS component used for the fall ragweed simulations.
2.3. CMAQ model modifications to incorporate pollen emissions and transport
The CMAQ modeling system has been designed to approach air quality in a “one atmosphere setting” with capabilities for modeling multiple air quality issues, including tropospheric ozone, fine particles, toxics, acid deposition, and visibility degradation. As depicted in Figure 1, the overall modeling framework contains three types of modeling components: a meteorological modeling system for the description of atmospheric states and motions, emission models for man-made and natural emissions that are injected into the atmosphere, and a chemistry-transport modeling system for simulation of chemical transformations and transport processes. CMAQ uses standard advection-diffusion and deposition schemes to describe pollutant transport. Published studies on pollen transport modeling have also utilized such schemes (as shown in Table 1). CMAQ describes the major processes that are important for pollen transport: convective transport, turbulent mixing, dry and wet deposition, etc., and is routinely applied to study transport and transformation of particulate matter; hence it is a logical choice for establishing a platform for the simulation of pollen transport, even though the average size of pollen grains is usually larger than that of the particulate matter simulated using the CMAQ aerosol modules (10 and 2.5 µm). As discussed in similar pollen modeling studies, the general problem with dispersion models based on the advection-diffusion equation is that attempts to add realistic features have been limited by difficulties related to characterizing the in-canopy emissions, particle size distributions, particle escape fraction, etc. (Kuparinen, 2006). However, several simplifications specific to particles from anemophilous species have been made to make these models analytically tractable.
Based on the design of this study, MM5-modeled meteorological output was post-processed with the Meteorology-Chemistry Interface Processor (MCIP) utility (Byun and Ching, 1999; Otte and Pleim, 2009) to generate the appropriate inputs for CMAQ. During this post-processing stage, meteorological fields were reformatted to match the input requirements of CMAQ: the number of layers in the vertical dimension was reduced from 29 to 22 by merging selected layers above 3 km, and by calculating multiple meteorological parameters required by CMAQ, that are not provided by MM5 (e.g. the Monin-Obukhov length, deposition velocities, etc.). The CMAQ Chemistry-Transport Model (CCTM) processor consists of various modular components that allow modifications (see Figure 1).
The deposition of particles is calculated within the CMAQ module based on the particle size distribution, as well as meteorological and land-use information. In the current simulation, all pollen particles of each species are assumed to be identically distributed spherical particles, and the scavenging coefficient is simply a function of washout time. The pollen particles are assumed to be completely scavenged by cloud and rain water. The aero depv2 module of CMAQ, which has been widely used to calculate the dry deposition velocities of coarse particles, has been used for estimating the dry deposition velocities.
The aerosol deposition velocity estimation module was parameterized according to typical birch and ragweed particle properties. Although many pollen particles have irregular shapes and aerodynamic adaptations, birch and ragweed are nearly spherical with established densities. Since no information on pollen particle size distributions is available, the calculations were performed with typical average particle sizes (Table 2). Comparisons of the pollen deposition velocity values calculated by the CMAQ module with experimentally-defined formulations for birch and ragweed grains revealed similar results (Aylor, 2002; Hout and Katz, 2004).
Table 2.
Typical birch and ragweed specific parameters used in the simulations.
| Species-characteristic attributes | Birch | Ragweed |
|---|---|---|
| Species spatial coverage | 3.6% | uniform (2%) |
| Particle aerodynamic diameter (µm) | 20 | 20 |
| Particle density (kg/m3) | 800 | 1,200 |
| Particle shape | spherical | spherical |
| Particle terminal velocity (m/s) | 0.70 | 1.1 |
| Plant average release height (m) | 15 | 1.0 |
| Release season | Spring | Autumn |
| Release window (days) | 30 | 30 |
| Heat degree day threshold | 2,200 | 2,800 |
| Pollen production Pq (particles/m2) | 109 | 109 |
| Contained allergens | Bet v1 | Amb α V3, Amb V, |
| Bet v2 | Amb t V, Amb p V | |
The deposition of pollen particles at ground level and within the canopy is a complex process. A further increase in realism through adding vertical variation in horizontal wind and vertical particle movement leads to difficult boundary-value problems with only non-closed form solutions (Kuparinen, 2006). The main mechanism of pollen removal from the atmosphere is believed to be scavenging with precipitation; however, the role of dry deposition should not be underestimated and therefore both are included in the regional modules. With respect to other processes, although the effect of increasing duration of solar radiation to pollen viability has been assessed for some pollen particles (Schueler et al., 2005), it was not incorporated in the simulations of this study due to lack of specific data.
2.4. HYSPLIT model
The National Oceanic and Atmospheric Administration (NOAA) Air Resources Laboratory (ARL) developed HYSPLIT (Draxler and Hess, 1998), which was used in this study for comparison with the pollen dispersion simulations performed with CMAQ. The HYSPLIT model is a system for modeling trajectories, dispersion, and deposition of pollutants, that has been previously used for modeling pollen particles (Pasken and Pietrowicz, 2005). This model uses gridded meteorological model output or a series of gridded analyses, such as Eta Data Analysis Systems (EDAS) (Rogers et al., 1996), or output of a forecast model such as MM5/PSU, Eta (Black, 1994), etc. In this work, the same MM5 output that was processed for CMAQ using the MCIP pre-processor (Byun and Ching, 1999; Otte and Pleim, 2009) was also used for the HYSPLIT model after following a similar step using the MCIP2ARL preprocessor. The approach used in HYSPLIT to calculate trajectories and dispersion of air parcels is a hybrid of Eulerian and Lagrangian methods. Particle advection and diffusion calculations are performed in a Lagrangian framework, while concentrations are calculated on a fixed grid. Air concentration calculations associate the mass of airborne particulates with the release of puffs, particles, or a combination of both, that can be specified by the user. The dispersion rate is calculated from the vertical diffusivity profile, wind shear, and horizontal deformation of the wind field (Draxler and Hess, 1998). In the present work, both trajectory and concentration modes of HYSPLIT were applied with the same parameterizations developed for the CMAQ model for each type of pollen particle. The present study also employed an available spatial analysis tool (TrajStat) (Wang et al., 2009) to perform a combined HYSPLIT/TrajStat analysis of tree pollen counts in order to evaluate the possibility of spatially associating high counts with air parcel trajectories coming from forested regions. The results obtained following this two-fold methodology will be discussed in the relevant sections.
2.5. Allergenic vegetation distribution in the U.S.A
BELD3 (Kinnee et al., 1997) along with the US Department of Agriculture Natural Resources Conservation Service (USDA NRCS) PLANTS vegetation occurrence database (http://plants.usda.gov) were used to determine the spatial patterns of coverage by birch trees and ragweed plants. The birch vegetation mapping in BELD3 utilizes data from the United States Forest Service (USFS) on individual tree species for each county or parish in the United States (US). The USFS data are provided in terms of the area covered by individual tree species as a fraction of total area covered by all tree species. A fraction is given for coverage of all trees in a 1 km2area. In this study, the percentage in each 12 km2 surface cell area is the average of the 144 individual 1 km2 grid cells from BELD3. The resulting map depicting the Birch species aggregate input dataset for the area of interest is presented in Figure 3a.
One limitation of the BELD3 database for aerobiological applications is the lack of information on ragweed species. The PLANTS occurrence database provides nearly uniform spatial density for the ragweed of the Northeast US, without additional information regarding the phenological stage of these sources. Nevertheless, ragweed species are widespread over North America, though their detection using remote sensing methods is limited. Building, construction, and the moving of soil have introduced ragweed contamination within the states of New Jersey and Florida where ragweed was not present in the past. Previous efforts to determine the ragweed plant distribution based on pollen counts indicate moderate coverage over the Northeast U.S. (Girsh, 1982). Coupling of the BELD3 (Figure 3b) and PLANTS databases (Figure 2) was used to allow ragweed emissions from cells marked predominantly as grassland, cropland/woodland mosaic, cropland/grassland mosaic, dryland cropland and pasture. An assumption of a uniform coverage of 2% within these cells was made based on average species coverage within the agricultural area sources. By employing this approach, the effect of urban and forest ragweed sources, though limited, was not excluded in the emissions modeling step.
In addition to the underlying LULC database, another critical component of the allergen production map is its temporal evolution during the pollination window. In previous efforts to incorporate spatiotemporal methods for pollen emission calculations in dispersion models, the results tended to overestimate emissions at the beginning and end of the season (Kawashima and Takahashi, 1999). To account for this in the present study the phenological progression of the pollination period was modeled with a plant-specific function that describes the likelihood to bloom. There are several semi-empirical models for predicting the start and the duration of the flowering seasons commonly applied to the species level. In this work a few simple but robust approaches were evaluated: degree day sum (DD), period units (PU), and calendar days (CD). Existing work indicates that all three methods are equally useful, with the species characteristics affecting the individual performance (Siljamo et al., 2008). More sophisticated promoter-inhibitor models of flowering demonstrate a way of including both temperature and radiation as the driving variables (Schaber and Badeck, 2003).
To capture the variations in the flowering time within the study area, the spatio-temporal flowering map was constructed based on heating degree days (temperature sums above a threshold). Heating degree day calculations (18.33° C threshold) were performed for the entire domain of interest (12 km resolution). Relevant heatsum thresholds for both birch and ragweed species were obtained from observed meteorology at Newark International Airport and applied using the values from the meteorological model at each grid cell. The corresponding parameters are provided in Table 2. Since the heating degree days are quantitative indices derived from temperature observations, these have been calculated from the existing MM5 simulations that have been evaluated with observations at multiple locations within the Northeast US. Prior evaluations of MM5-predicted temperatures with have shown strong agreement with surface measurements of temperatures (NYSDEC, 2006). While heat sums are the most important factors for bud and leaf burst, geographical location including the altitude, habitat and heredity have an effect usually reflected in the corresponding threshold levels. As demonstrated for the case of Betula pubescens (B. pubescens), the latitude determines an amount of heat to be accumulated before flowering can start (Siljamo et al., 2008). Since the average heat sum allowing the bud burst can vary considerably with latitude, and with the climatic conditions of the current and preceding years (Ranta et al., 2008), these parameters can be used to study the effect of climatic change by altering the pollen calendar of the species of interest (Emberlin et al., 2002; Frei, 1998; Rasmussen, 2002). For the purpose of this study the individual birch and ragweed species were mixed into “general” birch and ragweed pollens with appropriate averaging of their characteristics.
2.6. Pollen emission module parameterizations
A number of studies have developed formulations for modeling the vertical escape fraction of pollen particles and spores from a canopy of interest over time (Helbig et al., 2004; Sofiev et al., 2006; Schueler and Schlünzen, 2006; Vogel et al., 2008). Many of these formulations use friction (or critical) velocity for estimating the pollen flux from a canopy. It is well known that different plant species require different meteorological conditions to open their flowers. Most anemophilous trees flower in early spring when high temperatures, low humidity and moderate winds result to a passive dehydration which then leads to a bursting of the anthers. Grasses, on the other hand, require low temperature and high humidity, as the process is more hygroscopic. For the pollen source parameterization in this study the approach described by Helbig et al. (2004) was incorporated with some modifications based on Sofiev et al. (2006). This approach based on an assumption that the vertical flux of pollen particles Fp at the top of the vegetation is proportional to the product of a characteristic concentration and a characteristic velocity.
| (1) |
Here, Fp is an hourly average flux of pollen particles emitted in the transport layer (particles m−2s−1). The term ce is a dimensionless plant specific factor that describes the flowering stage of the selected species this study, and was incorporated in the spatiotemporal flowering database. The effect of favorable meteorological conditions specific to each species is included in the meteorological adjustment factor Ke. This is a dimensionless term that accounts for optimal environmental conditions (wind speed, temperature, humidity) that trigger the particle escape. Cell averaged friction velocity from MM5 was post-processed with MCIP and was used as the characteristic velocity. The characteristic concentration c* is calculated according to the following definition:
| (2) |
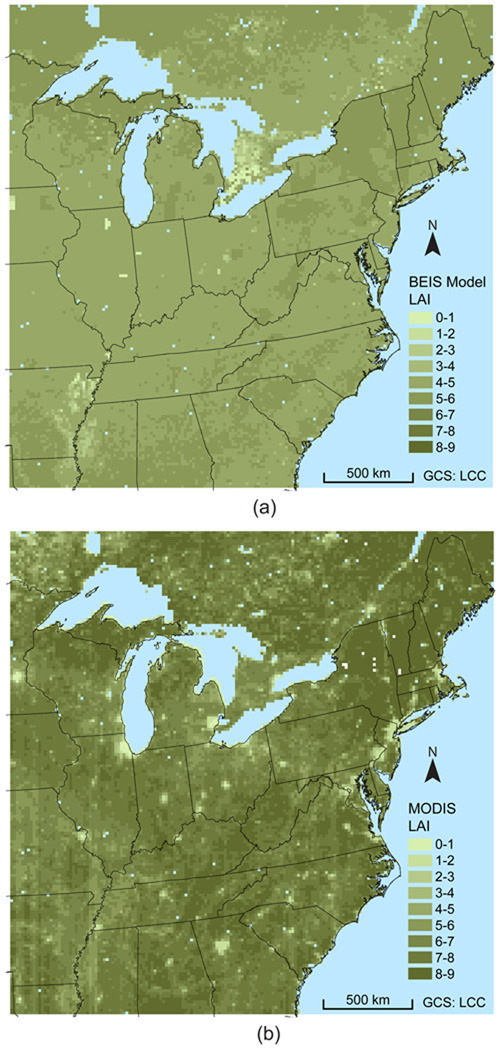
where Pq is the seasonal total pollen production per unit area (particles/m2), LAI denotes the leaf area index term, and Hs is the canopy height of the corresponding species (Helbig et al., 2004). Table 2 provides summary of typical values of birch and ragweed specific parameters involved in the calculations. The final product was included in the spatiotemporal flowering database for consistency, along with the spatial LAI component. For the case of birch, LAI was calculated based on the methodology of the BEIS model (Pierce, 1991). For ragweed, the same methodology is not applicable since the species are not included in BELD3. Instead, the Moderate Resolution Imaging Spectroradiometer (MODIS) 7-day LAI product for the beginning of August 2002 (August 7) was processed for the OTC domain (Fensholt et al., 2004). The corresponding LAI maps that were obtained from the two different approaches are presented in Figure 4. The final output of the module is the potential pollen flux from a uniform canopy per unit time and unit area. The quantity of emitted pollen during each timestep for each grid cell area can then be estimated by multiplying the potential pollen flux by the percentage area coverage of the canopy derived from BELD3.
Figure 4.
Evaluation of different approaches for estimating the leaf area index (LAI) parameter used in the birch and ragweed pollen simulations: (a) BEIS calculated LAI used for the birch pollen simulations, and (b) 8-day composite LAI remote sensing dataset from the MODIS satellite used for the ragweed simulations.
The meteorological triggers (humidity trigger, Kh; wind speed trigger, Kw; precipitation trigger, Kr) that are considered in this study are combined by the unitless term Ke and involve the following parameterizations reflecting the processes of interest:
| (3) |
where, when relative humidity is below 50%, there is full release of pollen. For relative humidity (h) above 80%, there is no pollen release. For values between 50% and 80%, the humidity trigger Kh is given as the following fraction:
| (4) |
The effect of wind and precipitation on the release of pollen above the canopy is simulated using the factors Kw and Kr according to Sofiev et al. (2006):
| (5) |
| (6) |
where h represents the relative humidity (%), w10m is the wind at 10 m above ground (m/s), uconv is the convective wind in (m/s), and p represents precipitation in (mm/h).
The remaining factor, ce is a dimensionless plant-specific function that describes the likelihood to bloom. This factor takes into account that not all flowers are blooming at the same time, although the meteorological conditions can be ideal for pollen release. Several studies describe the day-to-day variation for a number of plant species with a cubic function (Helbig et al., 2004; Schueler and Schlünzen, 2006). This was incorporated into the study via the parameterization proposed by Helbig et al. (2004):
| (7) |
where, d is the actual day of the pollen season lasting for the interval S. Outside of the pollen season, ce is set to zero. As mentioned before, the initiation of the pollen period is calculated at each cell of the model based on a phenology module that utilizes heat sums from the beginning of the modeled year, in conjunction with pollen counts, to derive the pollination window start and end dates. All the above information and databases created as intermediate modeling steps were used to construct a geographical information system (GIS) structure that allows management and visualization of both the input databases and the model results.
3. Results and discussion
3.1. Local pollen counts and backward trajectory clustering for Newark, NJ
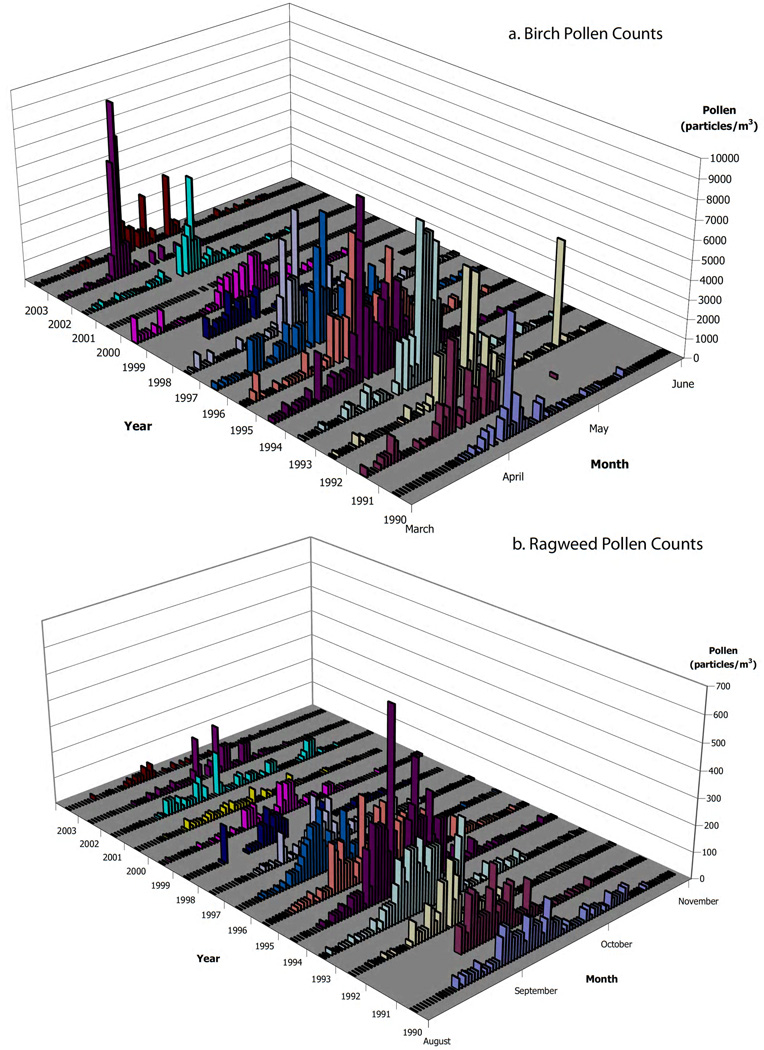
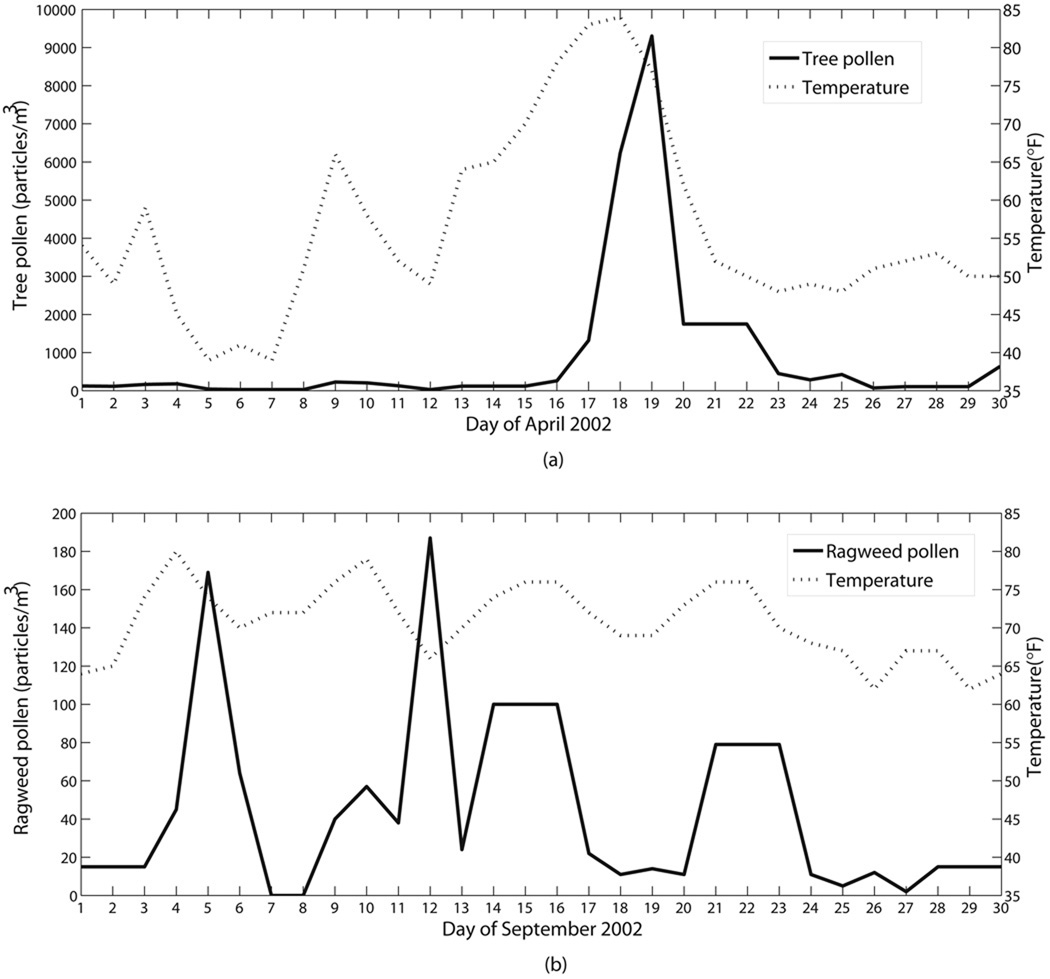
The Rotorod device located in the roof of the UMDNJ building in Newark, New Jersey is one of the most widely used instruments for aerobiological applications (Frenz, 1999). Daily averages were available for the years 1990–2003, excluding the spring of 2000 and some sporadic missing values for tree counts during 1991 and 1998 (Port et al., 2006). It is important to take into account that pollen count data are measured microscopically daily during the week (Monday through Thursday) while the weekend counts are averaged over the relevant 72 hr period (Friday through Sunday). The annual time series plots for total tree and ragweed counts provided in Figure 5 indicate that tree pollen emerges between late March and early May, while ragweed pollen emerges between late August and early September. During 2002 the total tree counts show a mid-April peak while most of the ragweed pollen was trapped during late August-September (see Figure 6). It is clear that the predominant pollen in the region during the spring came from trees, with a study maximum of 9,301 particles/m3 observed during 2002. The spring pollen period of 2002 appeared earlier and stronger than usual, comparable only to the 9,118 particles/m3 captured during the spring of 1994. As a result, the spring of 2002 was selected for tree pollen analysis. Ragweed counts for August, however, indicated substantially smaller atmospheric levels when compared with the tree component. The maximum counts of ragweed pollen also occurred during the year with a high tree count (1994). The study maximum was found to be 690 particles/m3 during 1994, while the maximum daily count for 2002 was 187 particles/m3.
Figure 5.
Daily total tree and ragweed pollen counts measured in Newark, NJ during the years 1990–2003 (Data courtesy of Dr. L. Bielory).
Figure 6.
Observed pollen counts of (a) total tree species and (b) ragweed, plotted with the average temperature for the months of April and September 2002, respectively. Pollen counts were obtained from the Newark UMDNJ location (Data courtesy of Dr. L. Bielory), local meteorology from the Newark Interational Airport meteorological station.
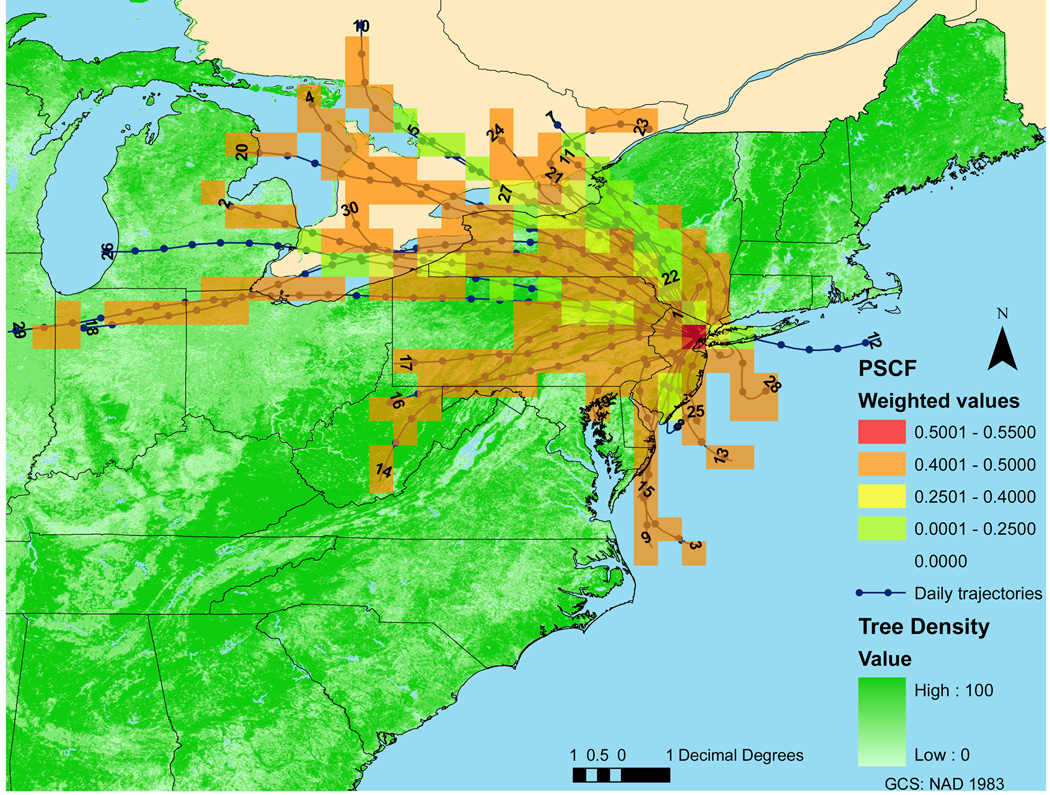
In order to track the area sources of tree pollen emissions, daily 24-hour backward trajectories were calculated using HYSPLIT for the entire month of April 2002. The corresponding measurement data from Newark were associated with the trajectories reaching the Rotorod device at 12 pm every day. The resulting database was analyzed with TrajStat, to spatially identify pollution sources from long-term measurement data. The resulting potential source contribution function (PSCF) is presented in Figure 7, along with the underlying tree density map obtained from the USFS forest cover database (Zhu, 1994). Combining these data reveals the possible forested area sources coinciding with air parcels reaching the UMDNJ location, that contain high pollen concentrations (above 150 particles/m3). The application of this tool is useful for analyzing measurements from either a single station or from multiple locations simultaneously; however, in the case of pollen, due to sparse data, the analysis was limited to a single pollen monitor.
Figure 7.
Weighted potential source contribution function (PSCF) calculated with the TrajStat software ((Wang et al., 2009)) based on daily HYSPLIT modeled backward trajectories corresponding to the pollen counts measured at the Newark UMDNJ location, NJ during the month of April 2002. Meteorological fields were obtained from the MM5 model, while the number at the end of each trajectory represents the day that the air parcel arrives at the UMDNJ location (noon local time).
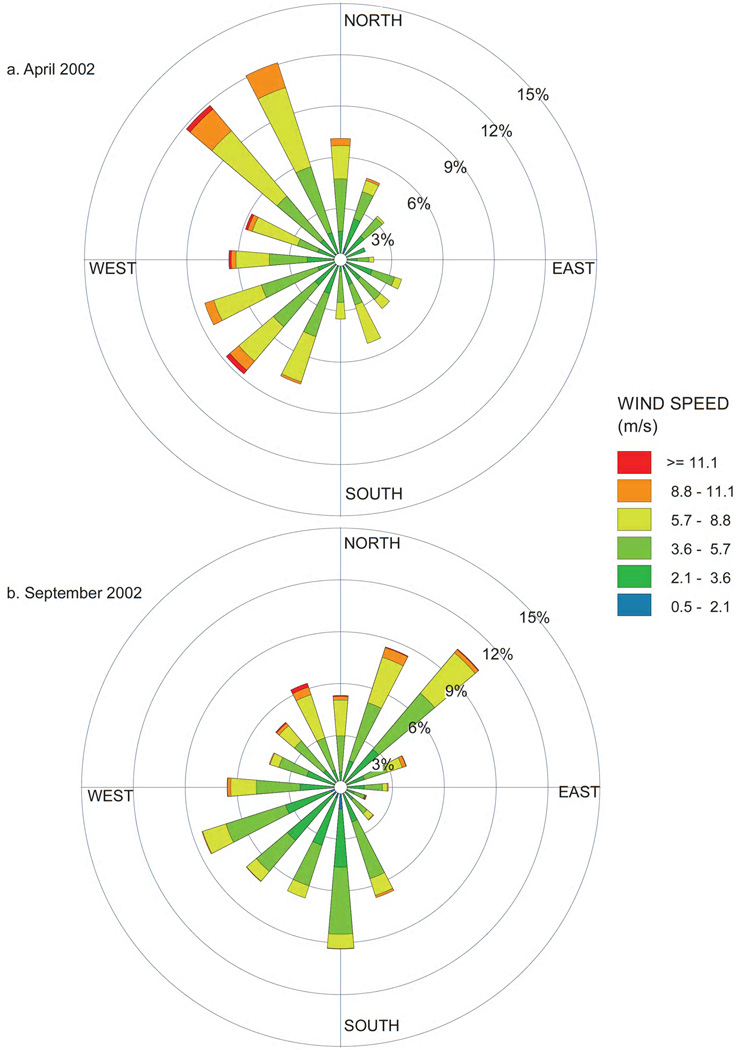
The applicability of the pollen emissions module was evaluated using the measured parameters before proceeding with domain-wide simulations. For the pollination seasons of interest during 2002, detailed plots of the associated pollen counts along with the measured values of related meteorological variables are presented in Figure 6. Wind speed was identified as the most significant variable, which is consistent with the findings of other studies using similar methodologies (Helbig et al., 2004; Vogel et al., 2008). Wind roses for the related periods based on meteorological data from Newark International Airport revealed differences in both strength and direction of the prevailing winds (see Figure 8). The final simulation results utilized modeled meteorology at each grid cell of the surface layer and will be discussed next.
Figure 8.
Wind-rose plots of the local winds from the Newark Interational Airport meteorological station during the tree and ragweed simulation periods of April and September 2002.
3.2. Pollen emission module results
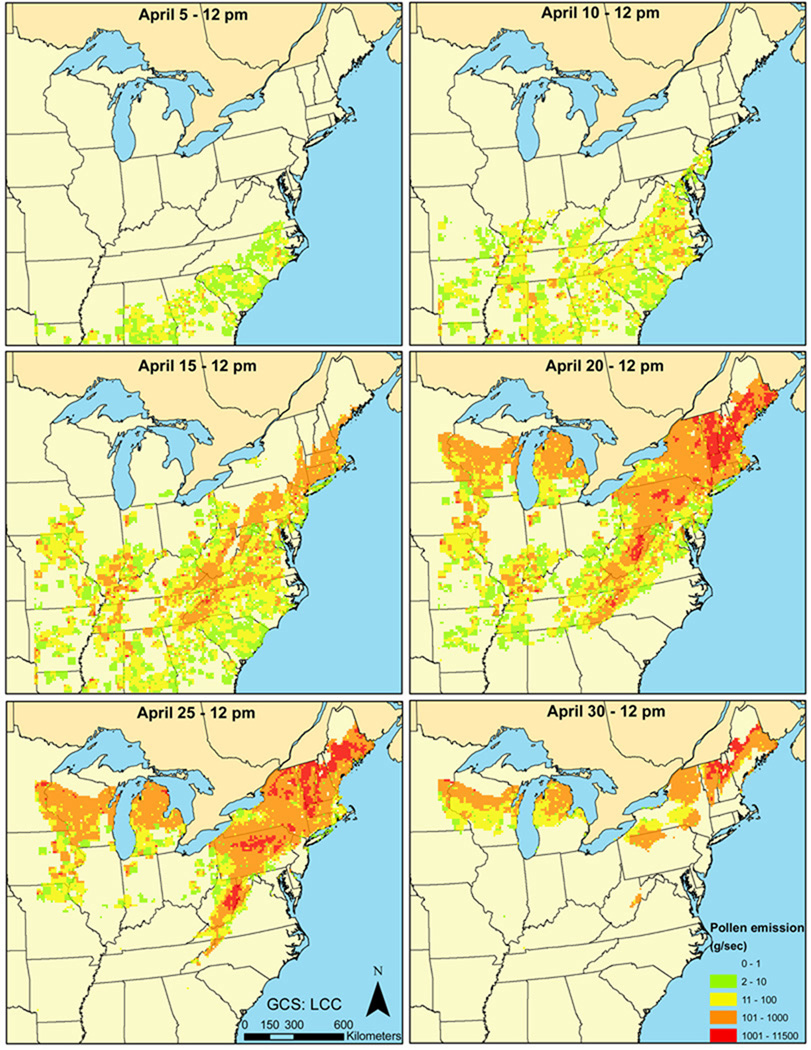
The parameterizations of the pollen module were implemented utilizing preprocessed meteorological output from MM5, as described in the previous section. Allergenic species-specific emission rates exceeding 100 particles m−2s−1 were predicted within 12 km of Newark, NJ (with over 3,000 particles m−2s−1 in some areas within 36 km of Newark, NJ). Corresponding grid cell-level releases were equivalent to less than 3 kg/s for most of the model grid cells that containing birch emissions. Birch pollen fluxes were significantly higher than those for ragweed, reflecting the stronger emission potential for birch described in the literature (Mahura et al., 2009). The diurnal profile of the emissions was also examined and found to be in accordance with recent birch-specific studies (Mahura et al., 2007). The peak pollen emission predictions within 12 km of Newark were within a day of peak pollen counts measured, thus providing independent model verification. The spatiotemporal progression of the birch emissions followed closely the pollen-shedding window, while the lack of a good spatial database, along with a wider pollen-shedding window, had a significant impact on the ragweed emission simulations. The magnitude of the modeled emissions was comparable to the actual pollen counts observed at the UMDNJ Rotorod device in Newark. Maps for calculated birch pollen fluxes, at 12 pm (noon) for selected days during April 2002 are presented in Figure 9. It must be noted that significant uncertainties exist in the modeling of pollen emissions due to assumptions regarding land use and land cover, and dynamics of urban scale meteorolog. Considering these uncertainties and the regional scale of the simulation at a resolution of 12 km, the model performs adequately in capturing the observations.
Figure 9.
Gridded hourly birch pollen emission fluxes (noon - 12 pm) calculated with the pollen model using a spatiotemporal flowering map developed for April 2002 over the Northeast Ozone Transport Commission (OTC) domain.
3.3. Pollen dispersion simulations with CMAQ and HYSPLIT
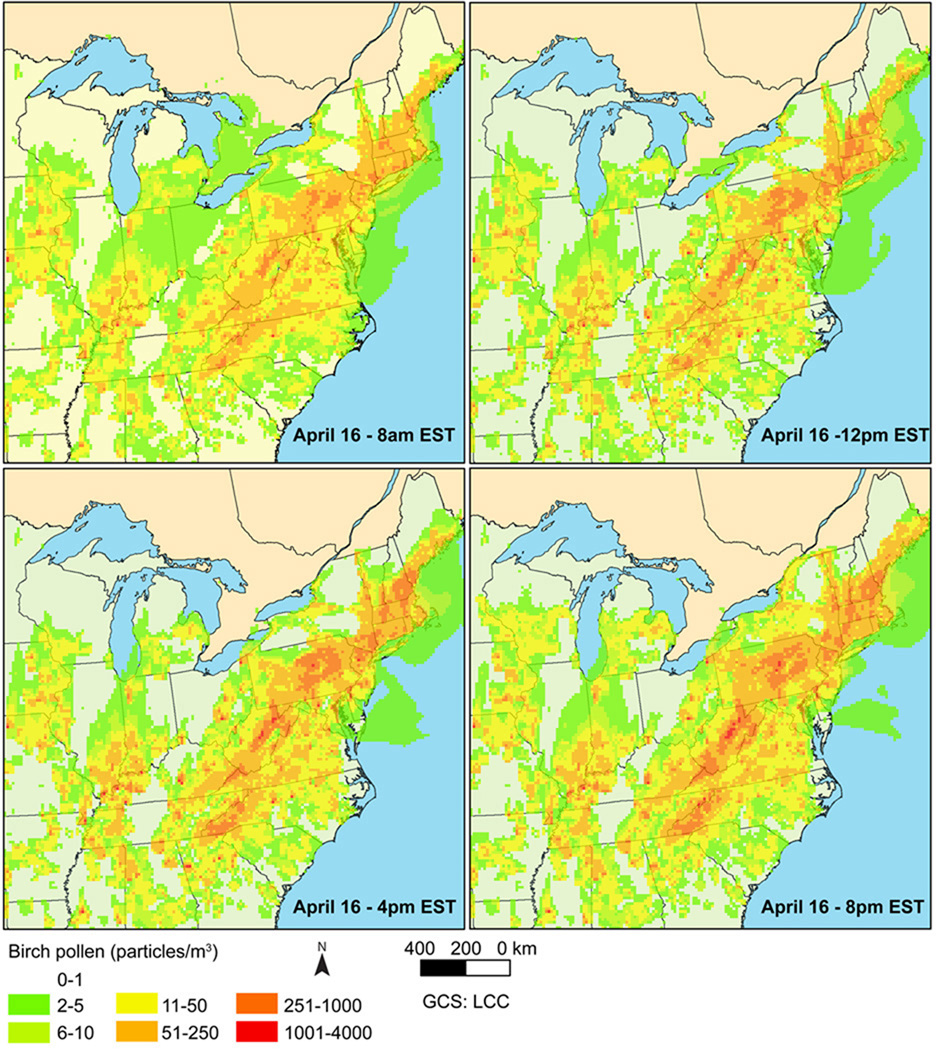
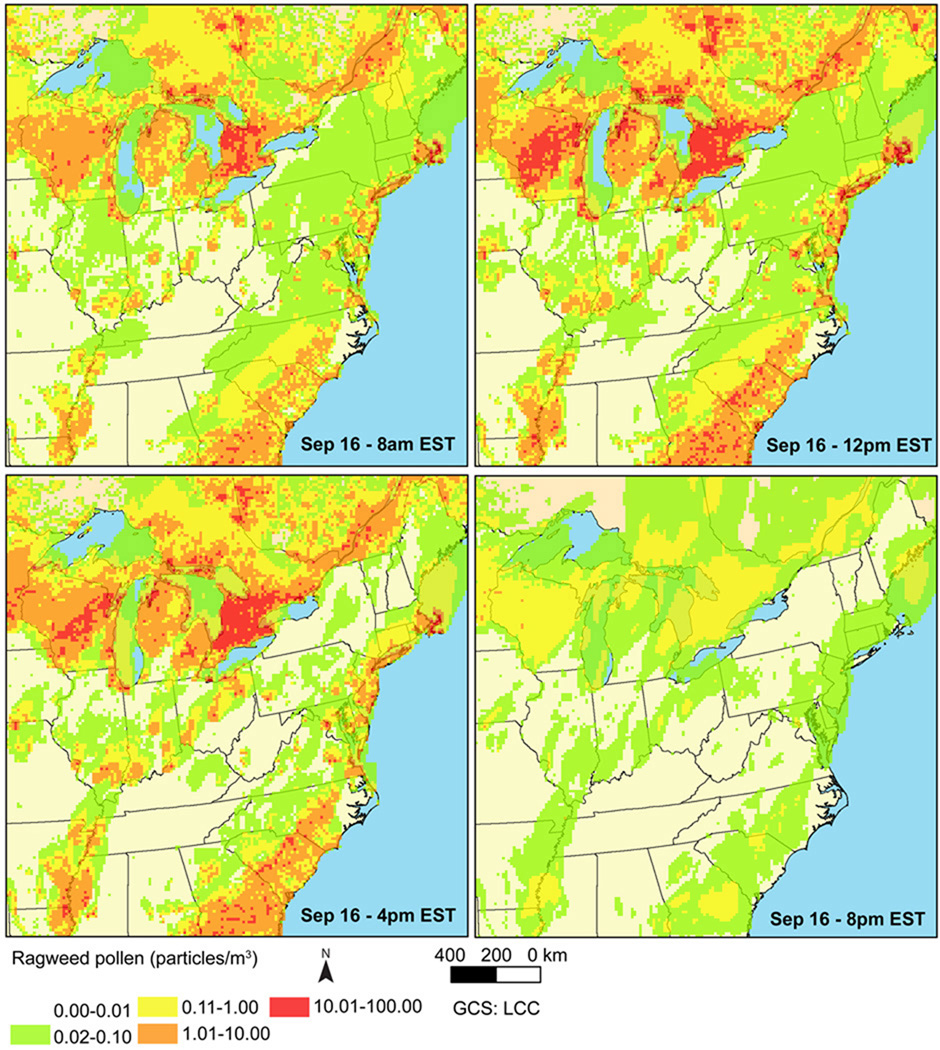
Hourly birch and ragweed levels were calculated as part of the spatial and temporal analysis of the dispersion of pollen in the OTC domain. The diurnal dynamics of the levels in the surface layer are reflected in the maps shown in Figure 10 and Figure 11 for the cases of birch pollen and ragweed pollen respectively. On April 16, a peak pollen emission occured, clearly affecting the concentration of airborne particles over the Northeast United States. Not surprisingly, the highest concentrations of birch particles were found to occur during midday, in grid cells with a strong tree component (Figure 10). The equivalent maps for the case of ragweed reveal a slightly different diurnal pattern with high concentration levels during the day and much lower values during the evening. This is attributed to the different character of the LULC database and the associated meteorological triggers on the ragweed pollen release; this was examined independently in the pollen emissions module. Although studies of the ragweed diurnal emission profile are not as detailed as studies of the birch pollen, qualitative comparisons were in agreement with the relevant literature studies (Raynor and Hayes, 1970).
Figure 10.
Hourly birch pollen levels calculated with the CMAQ-pollen model during April 16th, 2002 over the Northeast Ozone Transport Commission (OTC) domain. All emissions were allocated to the first layer in the vertical dimension and results are provided for every 4 hours.
Figure 11.
Hourly ragweed pollen levels calculated with the CMAQ-pollen model during September 16th, 2002 over the Northeast Ozone Transport Commission (OTC) domain. All emissions were allocated to the first layer in the vertical dimension and results are provided for every 4 hours.
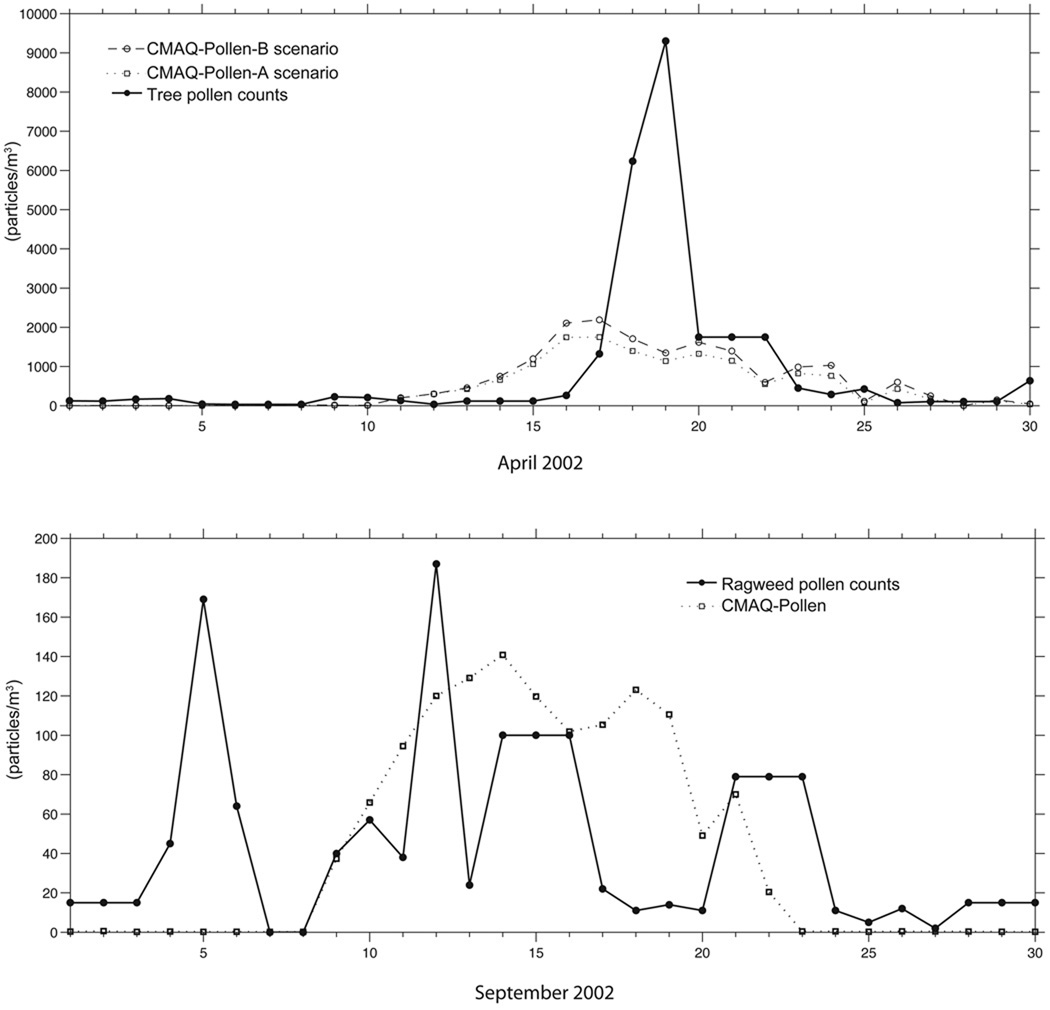
In addition to evaluating the spatial and diurnal components, it is useful to compare the seasonal pollen profiles, as these have been both modeled and measured at the same location. For this purpose, a single cell representing a forested area in Northern New Jersey was selected to provide information on both species. The comparison plot showing CMAQ-pollen model estimates and observed pollen levels in Newark, NJ for the months of April and September 2002 is presented in Figure 12. The top panel shows estimates using two assumptions for pollen emissions: in the CMAQ-pollen-A simulation, all birch pollen emissions were allocated to the first layer in the vertical dimension (from ground to 20 m), while in the CMAQ-pollen-B simulation, 80% of emissions were allocated to the first layer, and 20% were allocated to the second layer (20 to 50 m). The effect of the height of release resulted to an additional 200–300 particles/m3 during the peak days. In the ragweed simulation case (bottom panel), all emissions were allocated to the first layer. The modeled pollen concentration was averaged daily and compared with the total tree pollen counts for the same period. For such comparison plots, it is important to keep in mind that besides including more tree species that flower at the same time, the pollen counts are also averaged over a 72 hr period during the weekends (Friday through Sunday). Hence, an improved species-specific measurement with a better temporal resolution is necessary in order to achieve greater detail in the model-monitor comparisons. Furthermore, the counts themselves are not adequate to establish the allergenic potential of the atmosphere at a certain time, as allergen-specific information is not included (e.g. allergenic content of the particle). Moreover, it is not an easy task to perform concentration measurements of pollen grains with a high temporal resolution (Ronneberger et al., 2002). Although the theoretical framework of pollen viability due to the effect of solar radiation and humidity has been established and modeling efforts have emerged, such degradation processes were not taken into account in this study.
Figure 12.
Comparison plot showing CMAQ-pollen model estimates and observed pollen levels in Newark, NJ for the months of April and September, 2002. The top panel shows estimates using alternative assumptions for pollen emissions: in the CMAQ-pollen-A simulation, all birch pollen emissions were allocated to the first layer in the vertical dimension (from ground to 20 m), while in the CMAQ-pollen-B simulation, 80% of emissions were allocated to the first layer, and 20% were allocated to the second layer (20 to 50 m). In the ragweed simulation case (bottom panel), all emissions were allocated to the first layer.
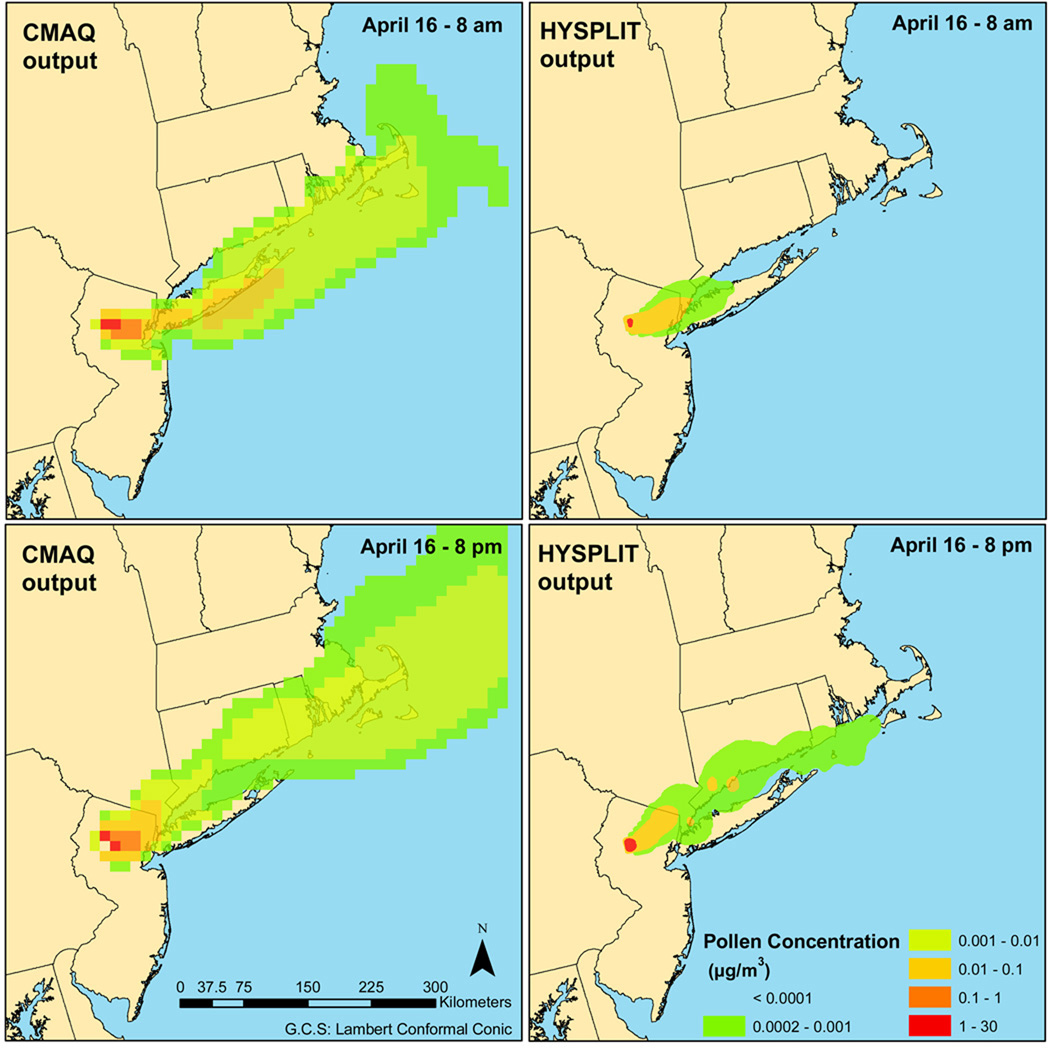
In order to obtain a clear picture of how CMAQ assesses pollen dispersion for the particles considered in this study (birch and ragweed), a comparison with other modeling tools can be very useful. For this comparison, the transport and dispersion of pollen emissions from a single grid cell of the emissions model was simulated using both the CMAQ and HYSPLIT models. The parameterization of the dispersion for the selected birch particles was kept as close as possible in both model implementations. Utilizing the same MM5 meteorology and particle characteristics, the comparison between the models revealed good agreement in both the intensity and directionality of the dispersion processes. As the comparison plots presented in Figure 13 indicate, CMAQ produces a dispersion output that covers a slightly greater spatial extent than the HYSPLIT equivalent. This can be explained by the different setup of surface emission in HYSPLIT. For CMAQ, the particles are injected in the surface layer of the atmosphere, while the exact release height can be defined in HYSPLIT. Nevertheless, the results obtained from both models show comparable treatment of pollen dispersal and capabilities of modeling LRT events of allergenic particles.
Figure 13.
Comparison of CMAQ and HYSPLIT-modeled dispersal of birch pollen, released from a single cell (12×12 km) forested area of Northern New Jersey at 8 am and 8pm of April 16th of 2002. Height of release was 20 m (surface CMAQ layer) and 15 m (HYSPLIT), respectively.
In the specific case studies presented here, the CMAQ simulations were conducted by turning on the full photochemistry and emissions of precursors related to photochemical air pollutants (ozone, oxides of nitrogen, and particulate matter). While the full photochemistry is not required for characterizing the pollen dispersion in the case studies presented, the application of the integrated system with full photochemistry demonstrates the feasibility of modeling of coexposures to multiple, interacting areoallergens in one single simulation, using a consistent formulation for emissions, meteorology, etc. The integrated approach also will allow for addressing interactions among pollen particles and other gas phase pollutants in the atmosphere; these interactions can affect the allergenicity of the pollen. For example, there is evidence of pollen interacting with atmospheric nitrogen dioxide and ozone (Franze et al., 2005).
4. Conclusions
This study presented the development of a new modeling system for investigating the dynamics of emissions and transport of pollen, that utilizes modified components of existing regional scale air quality models and vegetation databases. The implementation of this source-oriented approach accounts for large scale transport, and is based on the simulation of the phenological progression of the seasonal pollination windows. Components of the BEIS model have been adapted to predict pollen emission patterns. The transport module of the CMAQ modeling system was also modified to incorporate pollen transport and the MCIP preprocessor was refined to calculate species-specific deposition velocities. The combined model, CMAQ-pollen, allows for simultaneous prediction of multiple air pollutants and airborne pollen levels in a single model simulation, using consistent assumptions regarding the transport of multiple species. The modeling system presented here can resolve hourly changes in pollen concentrations, with the emission model providing hourly emission rates.
Case studies for evaluating this new combined modeling system included the simulation of airborne birch pollen levels during the month of April 2002, and of ragweed pollen levels during the month of September 2002. CMAQ-pollen outputs were evaluated using tree and ragweed pollen counts in Newark, NJ for the same time periods. The peak birch pollen concentrations were predicted to occur within two days of the measured peak values of total tree pollen, and showed a similar time trend. In the case of ragweed pollen, the model was able to capture the overall patterns of high airborne ragweed pollen levels, but was unable to capture an early monitored peak. Additional sensitivity simulations were performed to evaluate the dispersion patterns predicted by CMAQ-pollen using corresponding patterns predicted by the HYSPLIT model. CMAQ predicted concentration profiles that matched the trajectories of pollen transport estimated by HYSPLIT, support the potential of long-range transport during peak emission events that has been discussed in literature (Skjøth et al., 2007; Sofiev et al., 2006).
The modeling approach presented here allows simultaneous estimation of multiple airborne allergens and other contaminants, and is being developed as a main component of an integrated population exposure modeling system for co-occurring aeroallergens (Modeling ENvironment for TOtal Risk studies, MENTOR (Georgopoulos et al., 2005; Georgopoulos and Lioy, 2006; Georgopoulos, 2008)). As previous efforts to evaluate the use of mesoscale models for pollen dispersion studies also conclude, the most important challenge variable includes the parameterization of the emission terms, that is commonly based on scarce and sometimes outdated experimental data (Schueler and Schlünzen, 2006). Further investigation of such information would be useful in understanding effects of climate change on pollen production and pollen calendars. Another area that requires further research is the biological cycle relating to how and when allergenic pollen is released (diurnal profile). In addition, the vegetation databases were proven to be very limited in the case of ragweed, the areal coverage of which is difficult to determine with remote sensing techniques. Finally, in the context of human exposures, an understanding of the indoor and outdoor pollen relationship needs to be established for the major aeroallergens of concern.
Acknowledgments
This research was funded in part by USEPA under STAR Grant EPA-RD-83454701-0 (Climate Change and Allergic Airway Disease) to Rutgers University and UMDNJ, and under University Partnership Agreement CR 83162501 to the Center for Exposure and Risk Modeling (CERM) of the Environmental and Occupational Health Sciences Institute (EOHSI). USEPA has also supported this work through the Environmental Bioinformatics and Computational Toxicology Center (ebCTC) GAD-R-832721-010. Additional support was provided by the NIEHS sponsored UMDNJ Center for Environmental Exposures and Disease, Grant NIEHS P30ES005022 and by the New Jersey Department of Environmental Protection funded Ozone Research Center at EOHSI under contract AQ05-011.
Footnotes
Publisher's Disclaimer: This is a PDF file of an unedited manuscript that has been accepted for publication. As a service to our customers we are providing this early version of the manuscript. The manuscript will undergo copyediting, typesetting, and review of the resulting proof before it is published in its final citable form. Please note that during the production process errors may be discovered which could affect the content, and all legal disclaimers that apply to the journal pertain.
References
- Aas K, Aberg N, Bachert C, Bergmann K, Bergmann R, Bonini S, Bousquet J, de Weck A, Farkas I, Hejdenberg K. Technical Report. Brussels: The UCB Institute of Allergy; 1997. European allergy white paper: Allergic diseases as a public health problem. [Google Scholar]
- Adhikari A, Reponen T, Grinshpun S, Martuzevicius D, LeMasters G. Correlation of ambient inhalable bioaerosols with particulate matter and ozone: a two-year study. Environmental Pollution. 2006;140:16–28. doi: 10.1016/j.envpol.2005.07.004. [DOI] [PubMed] [Google Scholar]
- Aylor D. Settling speed of corn (zea mays) pollen. Journal of Aerosol Science. 2002;33:1601–1607. [Google Scholar]
- Behrendt H, Becker W. Localization, release and bioavailability of pollen allergens: the influence of environmental factors. Current Opinion in Immunology. 2001;13:709–715. doi: 10.1016/s0952-7915(01)00283-7. [DOI] [PubMed] [Google Scholar]
- Black T. The new nmc mesoscale eta model: Description and forecast examples. Weather and Forecasting. 1994;9:265–278. [Google Scholar]
- Byun D, Ching J. Science algorithms of the EPA Models-3 community multiscale air quality (CMAQ) modeling system. Rep. 1999 EPA/600/R-99 30. [Google Scholar]
- Byun D, Schere K. Review of the governing equations, computational algorithms, and other components of the Models-3 Community Multiscale Air Quality (CMAQ) modeling system. Applied Mechanics Reviews. 2006;59:51–77. [Google Scholar]
- Draxler R, Hess G. An overview of the HYSPLIT modelling system for trajectories, dispersion, and deposition. Australian Meteorological Magazine. 1998;47:295–308. [Google Scholar]
- Dudhia J. Numerical study of convection observed during the winter monsoon experiment using a mesoscale two-dimensional model. Journal of the Atmospheric Sciences. 1989;46:3077–3107. [Google Scholar]
- Dudhia J. A multi-layer soil temperature model for MM5. Boulder, CO: 6th annual MM5 Users Workshop; 1996. pp. 22–24. [Google Scholar]
- Emberlin J, Detandt M, Gehrig R, Jaeger S, Nolard N, Rantio-Lehtimki A. Responses in the start of Betula (birch) pollen seasons to recent changes in spring temperatures across Europe. International Journal of Biometeorology. 2002;46:159–170. doi: 10.1007/s00484-002-0139-x. [DOI] [PubMed] [Google Scholar]
- Fensholt R, Sandholt I, Rasmussen M. Evaluation of MODIS LAI, fAPAR and the relation between fAPAR and NDVI in a semi-arid environment using in situ measurements. Remote Sensing of Environment. 2004;91:490–507. [Google Scholar]
- Franze T, Weller M, Niessner R, Poschl U. Protein nitration by polluted air. Environmental Science and Technology. 2005;39:1673–1678. doi: 10.1021/es0488737. [DOI] [PubMed] [Google Scholar]
- Frei T. The effects of climate change in Switzerland 1969–1996 on airborne pollen quantities from hazel, birch and grass. Grana. 1998;37:172–179. [Google Scholar]
- Frenz D. Comparing pollen and spore counts collected with the Rotorod sampler and Burkard spore trap. Annals of Allergy, Asthma and Immunology. 1999;83:341–349. doi: 10.1016/S1081-1206(10)62828-1. [DOI] [PubMed] [Google Scholar]
- Georgopoulos P. A multiscale approach for assessing the interactions of environmental and biological systems in a holistic health risk assessment framework. Water, Air, & Soil Pollution: Focus. 2008;8:3–21. [Google Scholar]
- Georgopoulos P, Lioy P. From a theoretical framework of human exposure and dose assessment to computational system implementation: the Modeling ENvironment for TOtal Risk Studies (MENTOR) Journal of Toxicology and Environmental Health. 2006;Part B 9:457–483. doi: 10.1080/10937400600755929. [DOI] [PubMed] [Google Scholar]
- Georgopoulos P, Wang S, Vyas V, Sun Q, Burke J, Vedantham R, McCurdy T, zkaynak H. A source-to-dose assessment of population exposures to fine PM and ozone in Philadelphia, PA, during a summer 1999 episode. Journal of Exposure Science and Environmental Epidemiology. 2005;15:439–457. doi: 10.1038/sj.jea.7500422. [DOI] [PubMed] [Google Scholar]
- Girsh L. Ragweed pollen distribution in the USA: utilization of graphic maps. Annals of allergy. 1982;49:23. [PubMed] [Google Scholar]
- Grell GA, Dudhia J, Stauffer DR. Technical Report. Boulder, CO: National Center for Atmospheric Research; 1994. A description of the fifth-generation Penn State/NCAR mesoscale model (MM5) [Google Scholar]
- Guenther A, Karl T, Harley P, Wiedinmyer C, Palmer P, Geron C. Estimates of global terrestrial isoprene emissions using MEGAN (Model of Emissions of Gases and Aerosols from Nature) Atmospheric Chemistry & Physics Discussions. 2006;6:107–173. [Google Scholar]
- Helbig N, Vogel B, Vogel H, Fiedler F. Numerical modelling of pollen dispersion on the regional scale. Aerobiologia. 2004;20:3–19. [Google Scholar]
- Hogrefe C, Civerolo KL, Hao W, Ku JY, Zalewsky EE, Sistla G. Rethinking the assessment of photochemical modeling systems in air quality planning applications. Journal of the Air and Waste Management Association. 2008;58:2627–2638. doi: 10.3155/1047-3289.58.8.1086. [DOI] [PubMed] [Google Scholar]
- Hout RV, Chamecki M, Brush G, Katz J, Parlange M. The influence of local meteorological conditions on the circadian rhythm of corn (Zea mays L.) pollen emission. Agricultural and Forest Meteorology. 2008;148:1078–1092. [Google Scholar]
- Hout RV, Katz J. A method for measuring the density of irregularly shaped biological aerosols such as pollen. Journal of Aerosol Science. 2004;35:1369–1384. [Google Scholar]
- Hugg T, Rantio-Lehtimäki A. Indoor and outdoor pollen concentrations in private and public spaces during the Betula pollen season. Aerobiologia. 2007;23:119–129. [Google Scholar]
- Jones A, Harrison R. The effects of meteorological factors on atmospheric bioaerosol concentrations - a review. Science of the Total Environment. 2004;326:151–180. doi: 10.1016/j.scitotenv.2003.11.021. [DOI] [PubMed] [Google Scholar]
- Kain J. The Kain-Fritsch convective parameterization: an update. Journal of Applied Meteorology. 2004;43:170–181. [Google Scholar]
- Kawashima S, Takahashi Y. An improved simulation of mesoscale dispersion of airborne cedar pollen using a flowering-time map. Grana. 1999;38:316–324. [Google Scholar]
- Kinnee E, Geron C, Pierce T. United States land use inventory for estimating biogenic ozone precursor emissions. Ecological Applications. 1997;7:46–58. [Google Scholar]
- Knowlton K, Rotkin-Ellman M, Solomon G. Technical Report. Natural Resources Defense Council; 2007. Sneezing and Wheezing: How Global Warming Could Increase Ragweed Allergies, Air Pollution, and Asthma. [Google Scholar]
- Kuparinen A. Mechanistic models for wind dispersal. Trends in Plant Science. 2006;11:296–301. doi: 10.1016/j.tplants.2006.04.006. [DOI] [PubMed] [Google Scholar]
- Lamb C, Ratner P, Johnson C, Ambegaonkar A, Joshi A, Day D, Sampson N, Eng B. Economic impact of workplace productivity losses due to allergic rhinitis compared with select medical conditions in the United States from an employer perspective. Current Medical Research and Opinion. 2006;22:1203–1210. doi: 10.1185/030079906X112552. [DOI] [PubMed] [Google Scholar]
- Mahura A, Baklanov A, Korsholm U. Parameterization of the birch pollen diurnal cycle. Aerobiologia. 2009:1–6. [Google Scholar]
- Mahura A, Korsholm U, Baklanov A, Rasmussen A. Elevated birch pollen episodes in Denmark: contributions from remote sources. Aerobiologia. 2007;23:171–179. [Google Scholar]
- Nathan R, Meltzer E, Selner J, Storms W. Prevalence of allergic rhinitis in the United States. Journal of Allergy and Clinical Immunology. 1997;99:808–814. [PubMed] [Google Scholar]
- NYSDEC. Technical Report TSD-1a. New York State Department of Environmental Conservation; 2006. Meteorological Modeling using Penn State/NCAR 5th Generation Mesoscale Model (MM5) [Google Scholar]
- OTC. Technical Report. Ozone Transport Commission; 2007. Draft Modeling Technical Support Document. [Google Scholar]
- Otte T, Pleim J. The meteorology-chemistry interface processor (MCIP) for the CMAQ modeling system. Geoscientific Model Development Discussions. 2009;2:1449–1486. [Google Scholar]
- Otte T, Pouliot G, Pleim J, Young J, Schere K, Wong D, Lee P, Tsidulko M, McQueen J, Davidson P. Linking the eta model with the community multiscale air quality (CMAQ) modeling system to build a national air quality forecasting system. Weather and Forecasting. 2005;20:367–384. [Google Scholar]
- Pasken R, Pietrowicz J. Using dispersion and mesoscale meteorological models to forecast pollen concentrations. Atmospheric Environment. 2005;39:7689–7701. [Google Scholar]
- Pierce T. PC-BEIS: A personal computer version of the biogenic emissions inventory system. Journal of the Air and Waste Management Association. 1991;41:937–941. [Google Scholar]
- Port A, Hein J, Wolff A, Bielory L. Aeroallergen prevalence in the northern New Jersey-New York City metropolitan area a 15-year summary. Annals of Allergy, Asthma and Immunology. 2006;96:687–691. doi: 10.1016/S1081-1206(10)61066-6. [DOI] [PubMed] [Google Scholar]
- Ranta H, Hokkanen T, Linkosalo T, Laukkanen L, Bondestam K, Oksanen A. Male flowering of birch: spatial synchronization, year-to-year variation and relation of catkin numbers and airborne pollen counts. Forest Ecology and Management. 2008;255:643–650. [Google Scholar]
- Ranta H, Kubin E, Siljamo P, Sofiev M. Long distance pollen transport cause problems for determining the timing of birch pollen season in Fennoscandia by using phenological observations. Grana. 2006;45:297–304. [Google Scholar]
- Rasmussen A. The effects of climate change on the birch pollen season in Denmark. Aerobiologia. 2002;18:253–265. [Google Scholar]
- Raynor G, Hayes J. Experimental prediction of daily ragweed concentration. Annals of allergy. 1970;28:580. [PubMed] [Google Scholar]
- Rogers E, Black T, Deaven D, DiMego G, Zhao Q, Baldwin M, Junker N, Lin Y. Changes to the operational” early” eta analysis/forecast system at the national centers for environmental prediction. Weather and Forecasting. 1996;11:391–415. [Google Scholar]
- Ronneberger O, Schultz E, Burkhardt H. Automated pollen recognition using 3D volume images from fluorescence microscopy. Aerobiologia. 2002;18:107–115. [Google Scholar]
- Schaber J, Badeck F. Physiology-based phenology models for forest tree species in Germany. International Journal of Biometeorology. 2003;47:193–201. doi: 10.1007/s00484-003-0171-5. [DOI] [PubMed] [Google Scholar]
- Schoenwetter W, Dupclay L, Appajosyula S, Botteman M, Pashos C. Economic impact and quality-of-life burden of allergic rhinitis. Current Medical Research and Opinion. 2004;20:305–317. doi: 10.1185/030079903125003053. [DOI] [PubMed] [Google Scholar]
- Schueler S, Schlünzen K. Modeling of oak pollen dispersal on the landscape level with a mesoscale atmospheric model. Environmental Modeling and Assessment. 2006;11:179–194. [Google Scholar]
- Schueler S, Schlnzen K, Scholz F. Viability and sunlight sensitivity of oak pollen and its implications for pollen-mediated gene flow. Trees-Structure and Function. 2005;19:154–161. [Google Scholar]
- Siljamo P, Sofiev M, Ranta H, Linkosalo T, Kubin E, Ahas R, Genikhovich E, Jatczak K, Jato V, Nekovar J. Representativeness of point-wise phenological Betula data collected in different parts of Europe. Global Ecology and Biogeography. 2008;17:489–502. [Google Scholar]
- Skjøth C, Sommer J, Stach A, Smith M, Brandt J. The long-range transport of birch Betula pollen from Poland and Germany causes significant pre-season concentrations in Denmark. Clinical & Experimental Allergy. 2007;37:1204–1212. doi: 10.1111/j.1365-2222.2007.02771.x. [DOI] [PubMed] [Google Scholar]
- Sofiev M, Siljamo P, Ranta H, Rantio-Lehtimäki A. Towards numerical forecasting of long-range air transport of birch pollen: theoretical considerations and a feasibility study. International Journal of Biometeorology. 2006;50:392–402. doi: 10.1007/s00484-006-0027-x. [DOI] [PubMed] [Google Scholar]
- Vogel H, Pauling A, Vogel B. Numerical simulation of birch pollen dispersion with an operational weather forecast system. International Journal of Biometeorology. 2008;52:805–814. doi: 10.1007/s00484-008-0174-3. [DOI] [PubMed] [Google Scholar]
- Wang Y, Zhang X, Draxler R. TrajStat: GIS-based software that uses various trajectory statistical analysis methods to identify potential sources from long-term air pollution measurement data. Environmental Modelling and Software. 2009;24:938–939. [Google Scholar]
- WHO. Phenology and human health: allergic disorders. WHO; Technical Report. 2003
- Zhang D, Anthes R. A high-resolution model of the planetary boundary layer: Sensitivity tests and comparisons with SESAME-79 data. Journal of Applied Meteorology. 1982;21:1594–1609. [Google Scholar]
- Zhang DL. The effect of parameterized ice microphysics on the simulation of vortex circulation with a mesoscale hydrostatic model. Tellus, Series A-Dynamic Meteorology and Oceanography. 1989;41:132–147. [Google Scholar]
- Zhu Z. Technical Report Research Paper SO-280. United States Department of Agriculture, Southern Forest Experiment Station; 1994. Forest density mapping in the lower 48 States: a regression procedure. [Google Scholar]


