

Abstract
Raman spectroscopy holds promise as a novel noninvasive technology for the quantification of the macular pigments (MP) lutein and zeaxanthin. These compounds, which are members of the carotenoid family, are thought to prevent or delay the onset of age-related macular degeneration, the leading cause of irreversible blindness in the elderly. It is highly likely that they achieve this protection through their function as optical filters and/or antioxidants. Using resonant excitation in the visible region, we measure and quantify the Raman signals that originate from the carbon double bond (C=C) stretch vibrations of the π-conjugated molecule backbone. In this manuscript we describe the construction and performance of a novel compact MP Raman instrument utilizing dielectric angle-tuned band-pass filters for wavelength selection and a single-channel photo-multiplier for the detection of MP Raman responses. MP concentration measurements are fast and accurate, as seen in our experiments with model eyes and living human eyes. The ease and rapidity of Raman MP measurements, the simplicity of the instrumentation, the high accuracy of the measurements, and the lack of significant systematic errors should make this technology attractive for widespread clinical research.
Index Headings: Noninvasive detection, Raman spectroscopy, Retina, Macular pigments, Lutein, Zeaxanthin
INTRODUCTION
Age-related macular degeneration (AMD) is the leading cause of irreversible blindness in the United States.1 There is no treatment for patients affected with the disease that could lead to an improvement of the severely degraded central vision. Recent epidemiology findings of the Eye Disease Case Control Study have shown that high intakes of fruits and vegetables rich in the carotenoids lutein and zeaxanthin are associated with a significantly lower relative risk of AMD and that the wet form of AMD can be decreased by as much as 43%.2 These results have led to the launch of a large-scale industry in the United States promoting supplements containing lutein and/or zeaxanthin to individuals at risk for visual loss from AMD.
The carotenoids making up the macular pigment (MP) are highly concentrated in the center of the macula lutea, the ~5 mm diameter region of the retina that is essential for highest visual acuity and color vision, and they are much less pronounced in the peripheral retina. Although details of the protective mechanisms are still unknown, it is highly likely that protection occurs via antioxidant and/or optical filter functions. Carotenoid compounds would be excellent free-radical scavenging antioxidants in a tissue at high risk of oxidative damage owing to the high levels of light exposure and to abundant highly unsaturated lipids.1,3 In addition, since these molecules absorb in the blue-green spectral range, they can effectively act as filters, attenuating photochemical damage and/or image degradation caused by short-wavelength visible light components reaching the retina.4
Currently, there is strong interest in the development of noninvasive techniques for the measurement of MP levels both in the young and in the elderly population in order to determine more firmly the link between MP levels and risk of AMD.5 Optical detection approaches include heterochromatic flicker photometry, fundus reflectometry, autofluorescence techniques, and Raman spectroscopy. Clinical studies are carried out by several groups at present and have already provided direct evidence for the importance of MP. For example, recent Raman and flicker photometry clinical studies have shown that MP concentrations are on average declining with age in normally aged (healthy) eyes.6,7 Furthermore, the Raman study found that average levels of lutein and zeaxanthin were 32% lower in AMD eyes versus normal elderly control eyes as long as the subjects were not consuming high-dose lutein supplements.6 Patients who had begun to consume supplements containing high doses of lutein (≥4 mg/day) regularly after their initial diagnosis of AMD had average MP levels that were in the normal range and that were significantly higher than in AMD patients not consuming these supplements.6 These findings are consistent with the hypothesis that low levels of MP in the human macula may represent a pathogenic risk factor for the development of AMD. MP Raman detection is actively used worldwide at present in clinical trials involving larger subject bases and ethnicities.
An advantage of Raman spectroscopy lies in its high specificity for carotenoid detection. Applied as resonance Raman scattering (RRS), the technique is objective as well as noninvasive, fast, and quantitative. Its high specificity can be an advantage when measuring subjects with a variety of ocular pathologies. Carotenoid RRS can be used, besides for in vivo ocular measurements, for fast objective in vivo measurements of carotenoids in other human tissue such as skin and oral tissue as well.8,9 Recently, a skin version of the carotenoid RRS detection technology was successfully commercialized as the Biophotonic Scanner™ for the promotion of nutritional supplements (over 1500 units in use at present), and the market potential of a similar ocular version targeted to the population at risk for AMD appears strong.
The clinical instrument for MP measurements used currently is based on simultaneous multi-channel charge-coupled device (CCD) camera detection and employs dispersion of the detected backscattered light with a high-throughput spectrograph. In this paper we describe a novel instrument employing a simpler, single-channel detection scheme that might significantly reduce the instrument’s complexity. Starting with a summary of the spectroscopic basis for MP Raman detection, we report the design and performance of our single-channel MP Raman detector and compare it with the multi-channel detection variant.
RAMAN SPECTROSCOPY OF CAROTENOIDS
Lutein and zeaxanthin carotenoid molecules are similar to polyenes regarding their structure and optical properties (see molecular structure in Fig. 1). Their carbon backbones contain nine alternating conjugated carbon double and single bonds (C=C and C–C, respectively). The carbon backbone is terminated at each end by an ionone ring to which a hydroxyl group is attached. Four methyl groups are attached to the backbone as side groups. Zeaxanthin differs from lutein only in the location of one of the double bonds, which leads to an extension of the conjugation into one of the end groups. An energy level diagram of the carotenoid molecule is shown in the upper panel of Fig. 1. We use labels associated with the irreducible representations belonging to the C2h point group to describe the symmetries of the electronic states of carotenoids. The strong electronic absorption occurs in a broad band (~80 nm width) centered at ~450 nm and shows clearly resolved vibronic substructure with a spacing of 1400 cm−1. The absorption is caused by electric dipole-allowed vibronic transitions of the molecule’s conjugated π-electron from the 11Ag singlet ground state to the 11Bu singlet excited state. Optical excitation within the absorption band leads to weak luminescence (peak at 530 nm, width 50 nm) with a small Stokes shift, which again shows vibronic substructure. By analogy with the well-studied β-carotene molecule, the extremely low quantum efficiency of the lutein/zeaxanthin luminescence is caused by the existence of a second excited singlet state, a 21Ag state, which lies below the 11Bu state. Following optical excitation of the 11Bu state, the energy relaxes rapidly (within approximately 200–250 fs in β-carotene10) by non-radiative transitions to the lower 21Ag state, from which electronic emission to the ground state is symmetry forbidden. The extremely weak luminescence 11Bu → 11Ag and the absence of 21Ag → 11Ag fluorescence of lutein/zeaxanthin allows one to measure the RRS response of the molecules without potentially interfering fluorescence signals.
Fig. 1.
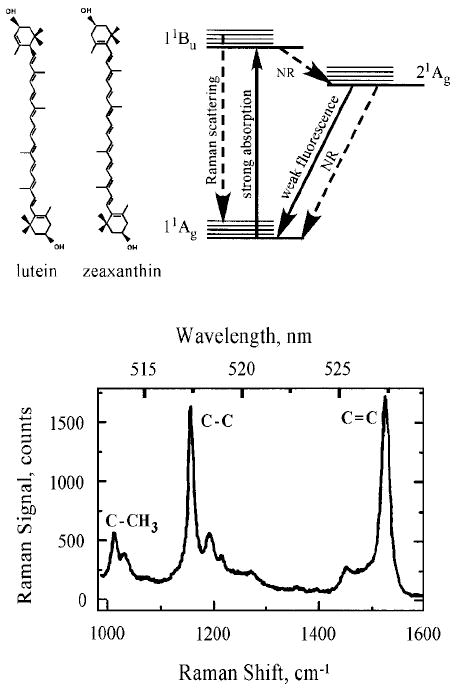
(Left panel) Chemical structure, (right panel) energy level diagram, and (lower panel) resonance Raman spectrum of the macular carotenoids lutein and zeaxanthin. The three most prominent carotenoid Raman peaks occur at 1008, 1159, and 1524 cm−1, as shown for a solution of lutein in tetrahydrofuran (THF), and correspond, respectively, to rocking motions of methyl components (C–CH3) and stretch vibrations of the carbon–carbon single (C–C) and double bonds (C=C). The side peak at 1030 cm−1 is an artifact and corresponds to THF. Laser excitation was at 488 nm. A fluorescence background was subtracted.
The RRS spectrum of carotenoid molecules (see Fig. 1, lower panel) is characterized by two prominent Stokes lines at 1159 and 1524 cm−1, originating, respectively, from the C–C and C=C stretch vibrations of the conjugated backbone. A weaker peak at 1008 cm−1 is attributed to rocking motion of the molecule’s methyl side groups.11 We found that lutein and zeaxanthin have very similar spectra at room temperature in terms of Raman shifts and peak widths. Raman signals are superimposed on a very weak fluorescence background originating from intrinsic 11Bu → 11Ag carotenoid fluorescence that varies slightly in spectral shape and strength depending on the type of the carotenoid molecule. In all cases of resonant excitation of pure carotenoid solutions, the intensity ratio between Raman signal and background fluorescence is about 1:1 at the spectral position of the C=C Raman peak.12
Under resonant visible excitation with λ = 488 nm light, in vivo Raman spectra are only insignificantly affected by spectrally overlapping retinal fluorescence: the Raman-to-fluorescence ratio on average is as low as ~1:3–1:4 and thus not much different from in vitro spectra.12 This shows that no other biological molecules exist in significant concentrations in human ocular tissues that can produce similar resonance enhancement at this excitation wavelength. RRS Raman scattering is a linear spectroscopy, i.e., the scattering intensity scales linearly with the intensity of the incident light. Furthermore, at fixed incident light intensity, the Raman response scales with the population density of the scatterers in a linear fashion. The proportionality factor is the Raman scattering cross-section, a fixed constant determined by excitation and collection geometries. The linearity holds as long as the scatterers can be considered as optically thin, which is the case for ocular tissue. Therefore, the Raman peak height can be used as a measure of MP content in this tissue.
MULTI-CHANNEL RAMAN DETECTOR FOR MACULAR PIGMENTS IN HUMAN RETINA
The most recent version of a multi-channel clinical Raman MP detector is schematically shown in Fig. 2. It is a compact, portable, fiber-based, computer-interfaced instrument with high light throughput. The excitation light, which originates from a 488 nm argon laser, is routed via fiber, band-pass filter F, dichroic beam splitter BS, and eyepiece into the human eye. The Raman scattered light is collected in 180° backscattering geometry and routed through beam splitters BS, holographic Rayleigh light rejection filter NF, and a fiber bundle to a small home-made high-throughput spectrograph. The latter uses a volume holographic transmission grating for dispersion and is coupled to a thermoelectrically cooled silicon CCD camera. A red-light-emitting diode, placed inside the spectrograph, generates a polka-dot pattern on the retina that can be used for self-alignment (see details in Refs. 12, 13, and 14).
Fig. 2.
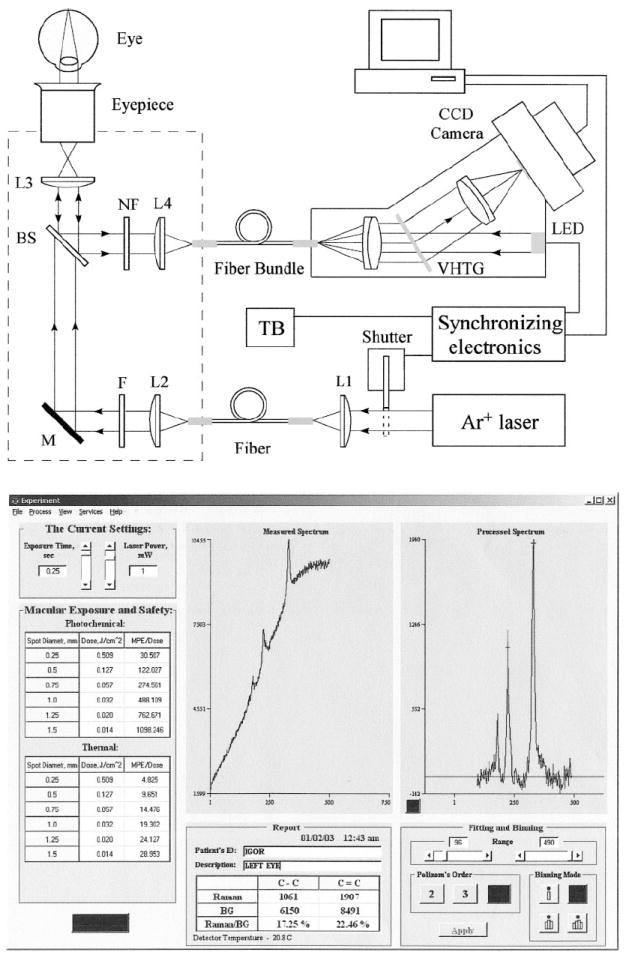
(Upper panel) Optical diagram of the dispersive multi-channel MP Raman detector and (lower panel) MP Raman spectra obtained with it.
After each MP Raman measurement, specially developed software displays the spectrum on the computer screen, identifies the sharp carotenoid Raman peaks riding on the broad fluorescence background, provides a fit of the broad background with a fourth-order polynomial, and subtracts this background from the measured spectrum. As a measure of carotenoid concentration, we chose the absolute peak height of the C=C signal at 1524 cm−1. Raw and processed Raman spectra from the macula of a healthy human volunteer, measured with dilated pupil, are shown in Fig. 2 (bottom panel). A typical spectrum obtained from a single measurement clearly reveals carotenoid Raman signals superimposed upon a weak and spectrally broad fluorescence background. This background is caused partially by intrinsic fluorescence of carotenoids, and partially by lipofuscin, a fluorophor deposited in the retinal pigment epithelial layer. The ratio between intensities of the carotenoid C=C Raman peak and fluorescence background is high enough (~0.25) that it easily allows one to quantify the amplitude of the C=C peak after digital background subtraction.
In all measurements performed with this multi-channel MP Raman detector, the laser power is 1.0 mW, the exposure time is 0.25 s, and the spot diameter on the macula is ~1 mm. These values correspond to a macular exposure of ~32 mJ/cm2, a value that is 488 times less than the ANSI maximum permissible safe dose of 15.5 J/cm2.15
For calibration purposes we used the RRS response from an optically correct model eye containing tissue paper at the position of the retina that was spotted with well-defined, physiological-level carotenoid concentrations of 50, 100, and 200 ng of lutein, respectively, per spot. A plot of the respective RRS Raman signals as a function of lutein concentration yields a linear relationship between carotenoid Raman peak height and carotenoid concentration, with the coefficient of linear correlation R being near unity. These tests demonstrate that excellent linear tracking of carotenoid concentration is possible with our instrument and that the error for prediction for a given physiological concentration level in the model eye is better than 7%.
SINGLE-CHANNEL RAMAN DETECTION OF MACULAR PIGMENTS IN HUMAN RETINA
For single-channel measurements, we again chose the C=C stretch vibration of the carotenoid molecule as a measure of MP concentration. This Raman line is not only the strongest line, but also has the largest Stokes shift (1524 cm−1). This makes it possible to use a simple filter to separate the Raman line from the laser excitation. Signal detection in the presence of a moderate retinal fluorescence has to involve at least two spectral channels. As shown in Fig. 3, detection at the Raman wavelength alone (dashed curve) would result in the sum of Raman signal and fluorescence background. Therefore, the fluorescence background intensity needs to be measured independently, which can be achieved, for instance, in close proximity to the Raman signal (solid curve) and used for correction. We expect this approach to work fine as long as the change in fluorescence intensity from the Raman to fluorescence sampling wavelength is much smaller than the intensity of the Raman peak.
Fig. 3.
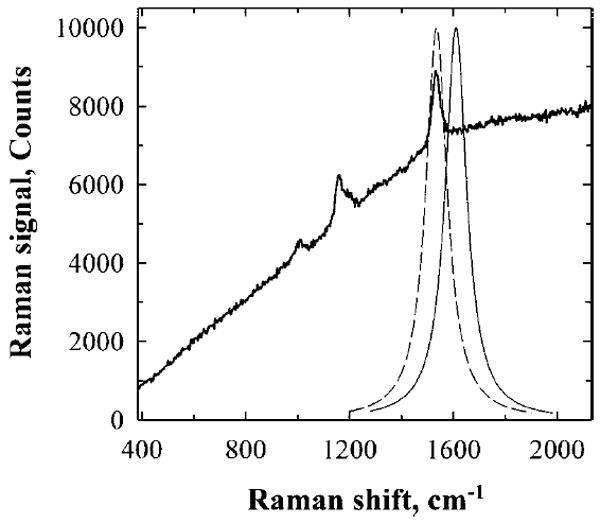
Operational principles of single-channel Raman detection. The intensity of the carotenoid C=C Raman peak can be measured with a tunable narrow band pass filter and single-channel light detector. When the transmission band of the filter is tuned to the C=C peak (dashed curve), both Raman signal and accompanying background fluorescence are measured. When the filter’s transmission curve is slightly shifted from the Raman peak (solid curve), the detector registers only background fluorescence. The subtraction of the latter signal from the former one gives the C=C Raman signal intensity.
In Fig. 4, we demonstrate our implementation of this concept. Filter F is angle-tuned to sequentially transmit the Raman scattered light at 527 nm (on-peak position) or to transmit the background light at a wavelength position of 529 nm, just missing the Raman peak (off-peak position). The bandwidth of filter F is chosen so that it matches the bandwidth of the carotenoid’s C=C Raman peak for maximum signal throughput. A holographic notch filter NF is used for additional, highly effective, laser light rejection. To generate a “pure” Raman signal, we use the difference between two signals measured from the PMT. A first value is obtained with filter F tuned to the on-peak position and another signal with the filter tuned to the off-peak position. For both measurements, identical exposure times and detection conditions must be realized.
Fig. 4.
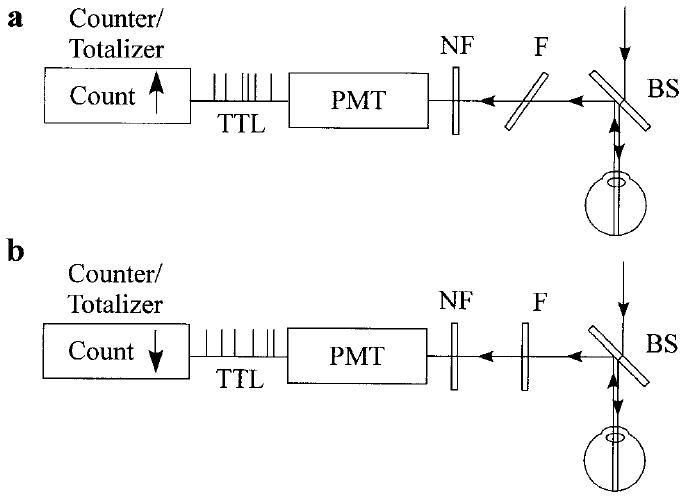
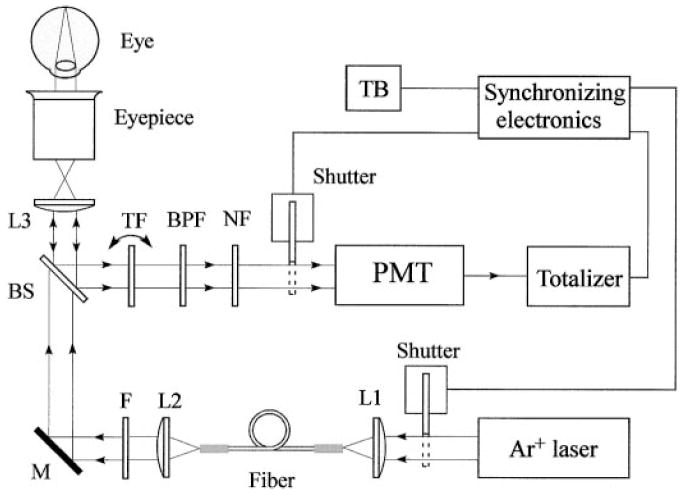
Technical implementation of single-channel MP Raman detection. Blue excitation laser light is routed into the human eye via a dichroic beam splitter (BS). Backscattered Raman light is reflected toward the registration module. A thin, angle-tunable dielectric band pass filter F, transmits, depending on its orientation, either (a) the sum of the retinal fluorescence and carotenoid Raman signal, or (b) retinol fluorescence only. The electronics of a photo multiplier tube (PMT) produces TTL pulses with each photon detection event. Note that the pulse counter/totalizer is synchronized with the angle-tuned filter: it counts UP whenever the filter transmits at the Raman wavelength, and it counts DOWN whenever pure retinal fluorescence is transmitted.
The optical diagram of the single-channel Raman detector is shown schematically in Fig. 5. While light source, light delivery, and collection module are unchanged compared to Fig. 2, all other components are tailored to single-channel detection.
Fig. 5.
Optical diagram of the single-channel version of the MP Raman detector.
Light from an argon laser is routed via single multimode fiber into a light delivery and collection module. Inside the module, the light is collimated by a condenser lens, L2, spectrally filtered at 488 nm with a band-pass filter, F, routed via dichroic dielectric beam splitter, BS, and imaged by a combination of lens L3 and eyepiece onto a 1-mm-diameter spot centered on the fovea of the human macula. The light scattered back from the retina is collected by the eyepiece and lens L3, reflected by the beam splitter, and filtered at the C=C stretch frequency. The filtering is achieved with a combination of two narrow band-pass interference filters (TF and BPF, with bandwidths of 1 and 10 nm, respectively). The bandwidth of the filter TF is chosen so that it matches the bandwidth of the carotenoid C=C Raman peak for maximum signal throughput. A holographic laser light rejection filter, NF, together with filters TF and BPF, provide an extinction of ~10–10 at the Raman excitation wavelength.
An angle-tuned band-pass dielectric interference filter, mounted on a shaft of a rotary solenoid, replaces the spectrograph as dispersive module of the multi-channel detector. We estimate the light throughput to be at least a factor of four higher than that in the multi-channel configuration. This compensates for the lower quantum efficiency of the PMT’s photo-cathode compared to the efficiency of the CCD array chip. The compact photon counting module operates in counting mode and consists of a PMT with low noise bi-alkaline photocathode, builtin high-voltage power supply, pulse amplifier, discriminator, and 1/10 pulse prescaler, and it generates TTL-compatible pulses for which one pulse is the result of 10 photon detection events. The PMT module operates at room temperature (RT) with dark count contribution as low as one TTL pulse per second. The TTL pulses are counted with a low-cost add–subtract totalizer. This type of counter continues to add up detected pulses or to subtract them from previously accumulated numbers depending upon the polarity of a control voltage applied to the counter. An embedded LCD serves as a data output device that displays the measurements. Two electro-mechanical shutters, installed in front of the light delivery fiber and PMT tube, protect the subject’s eyes and the PMT, respectively, from unnecessary excess exposure. A simple micro-controller is used to handle timing and synchronization functions critical for the single-channel Raman instrument. It detects the activation of trigger button TB, resets the counter, and opens two shutters, allowing the laser light to enter the subject’s eye and the backscattered light to enter the detector. For the first 0.25 seconds, an appropriate voltage is applied to the rotary solenoid and to the counter direction control terminal to tilt the band-pass filter TF to ~9 degrees. In this position, it transmits both the C=C Raman signal and the fluorescence (527 nm), and the totalizer adds up the corresponding photon counts. During the next 0.25 seconds, the voltage is zero. This causes the TF filter to return to the normal position and to transmit the background light at a wavelength position of 529 nm, just missing the Raman peak (off-peak position). During this time interval, the totalizer will count down and effectively subtract the fluorescent contribution to the overall signal.
In general it is sufficient to limit the MP measurement to only one cycle, as described. However, to increase the signal-to-noise ratio, we decided to automatically repeat this measurement cycle several times. There is no need to reset the counter since it can continue to add up or subtract pulse counts even when different from zero level. The complete detection process is shown schematically in Fig. 6. After completion of four cycles, the micro controller turns off the laser excitation, shuts off the PMT input window, and disconnects the PMT’s output from the counter circuits. An operator can then read out the overall count figure from the LCD that is proportional to the MP content.
Fig. 6.
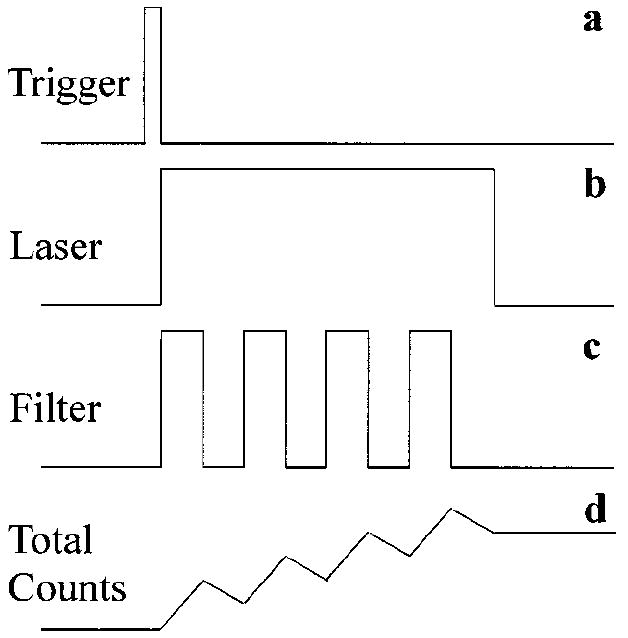
Timing diagram of single-channel measurements. A trigger button initiates measurements providing a trigger signal (a) followed by laser shutter activation (b). Laser light remains ON during several cycles of MP measurements. An angle-tunable filter changes its orientation once per cycle (c) and a pulse counter continues to add up or subtract pulse counts according to the filter position (d). Multiple measurements assure high signal-to-noise ratios.
EVALUATING THE SINGLE-CHANNEL MP DETECTOR
In order to find a correlation between Raman readings and actual carotenoid content of the living macula, we conducted calibration experiments using a “model eye”. It consists of a thin, 1 mm path length quartz cell filled with carotenoid solutions, placed in the focal plane of a positive lens having a focal length of 22 mm. Such a lens is known to approximate the refractive properties of the human eye. The effective excitation volume is then a cylinder with a length of 1.0 mm and a base diameter of 1.1 mm (approximately the diameter of a laser beam), resulting in a sampling volume of about 1 mL. As calibration materials, we initially chose freshly prepared ethanol solutions of zeaxanthin and lutein with varying but known carotenoid content in the 1 mL sampling volume. This corresponded to average carotenoid concentrations typically found in excised human macular samples, as measured by high-pressure liquid chromatography. Also, we measured the absorption of these samples with a precision UV/visible spectrometer.
The calibration results are shown in Fig. 7 for zeaxanthin, which is the predominant carotenoid in the central part of the human fovea. The calibration curve for lutein (not shown) essentially coincides with that for zeaxanthin since both the Raman excitation efficiency and the extinction coefficient are virtually equal for both carotenoids. The calibration response correlates directly with the Raman response, i.e., effective PMT counts, with the concentration of carotenoids, and also shows that linear tracking of carotenoid concentrations is possible for low and moderate concentrations, as is the case for the living human macula. A deviation from the linear response occurs, however, as expected, at higher MP densities, i.e., at MP densities in excess of an optical density of ~0.6 measured at 488 nm, where both the depletion of the excitation light and self-absorption of the Raman light occur. It is worthwhile to point out that the shape of the calibration curve obtained for the single-channel detector is the same as measured previously for the multi-channel detector.12 This fact rules out the PMT–pulse counter saturation and leaves only the effect of absorption to explain the particular shape of the calibration curve. The measured calibration curve is not only useful for correcting MP Raman signals at higher concentrations, but it also serves as a direct correlation between the Raman counts and the average MP optical density measured at 488 nm.
Fig. 7.
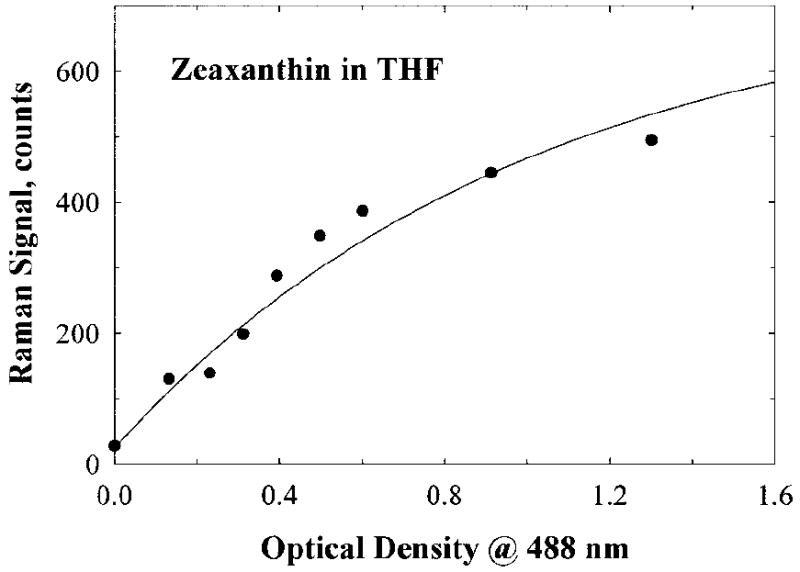
Calibration curve obtained for single-channel MP Raman detection. It links the reading provided by the instrument with the carotenoid content in a human macula. The curve was obtained using a model eye attached to the instrument. The model eye discussed in the text contains zeaxanthin dissolved in methanol. The sampling volume, 1 mL, corresponds to a 1-mm-diameter spot at the macula and contains a carotenoid concentration typical for a human macula.
In subsequent experiments, we measured MP amounts in healthy retinas of two volunteer subjects using both single-channel and multi-channel Raman instruments. The subject’s pupils were pharmaceutically dilated to 9 mm in diameter. The results shown in Fig. 8 are averages of five measurements for each eye, and the data were normalized to facilitate the comparison of the two Raman instruments. According to the bar plot, subject B’s retina is proportionally and consistently lower compared to the readings for the retina of subject A. The single-channel detector, however, gave a slightly higher response for subject B than the multi-channel detector. We believe this small inaccuracy is satisfactory and acceptable for practical applications.
Fig. 8.
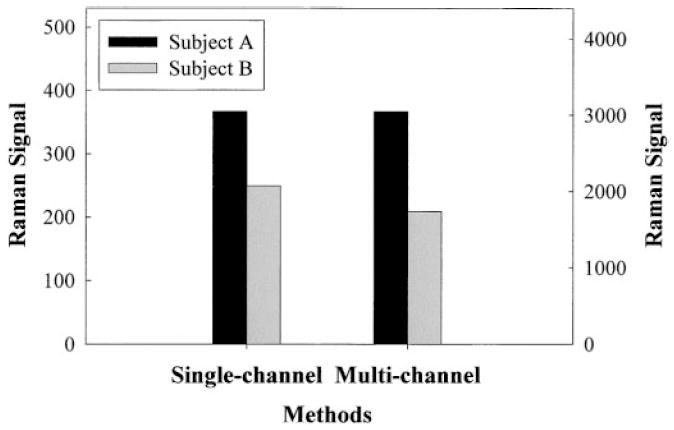
Comparison of single- and multi-channel instruments regarding MP Raman responses of two volunteer subjects, A and B. The Raman signal strength at left corresponds to single-channel detection and the scale at right to multi-channel detection, respectively. The signal strengths obtained with the two instruments for subject A are shown at the same level to facilitate comparison of the responses for subject B.
To compare test-retest repeatability in human MP measurements, we measured MP in the same pupil-dilated eyes five times using both single-channel and multi-channel instruments and allowing 3 to 4 min intervals between measurements. These time intervals ensured that afterimages from the laser exposure had faded. The results are shown in Fig. 9. The relative standard deviation for MP Raman measurements was only slightly better for the multi-channel instrument as compared to the single-channel detection (5.0% versus 5.6%, respectively). Therefore, our simple single-channel MP measurements appear to be in agreement with the results obtained with a more complex multi-channel instrument. The new device can be cross-correlated, demonstrates comparable accuracy and repeatability to multi-channel detection, and holds promise as a simple, cost-effective instrument for retinal carotenoid measurements.
Fig. 9.
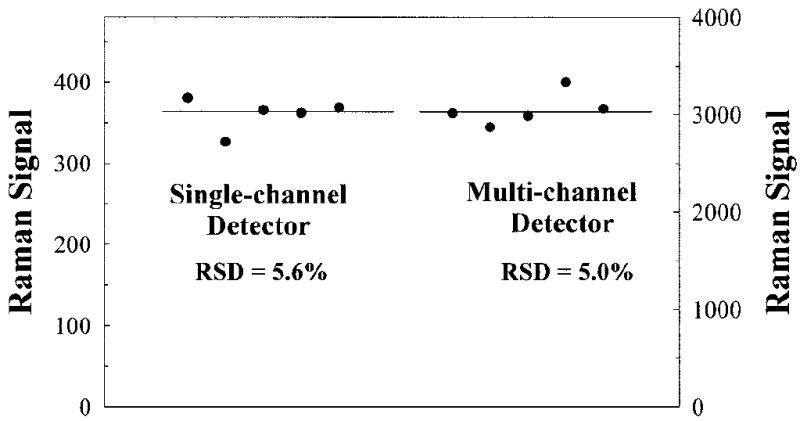
Test-retest repeatability and average values of MP measurements for a subject obtained with single-channel and multi-channel Raman detection. The Raman signal strength at left corresponds to single-channel detection and the scale at right to multi-channel detection, respectively.
CONCLUSION
Using resonant excitation in the visible, we measured Raman responses from carotenoid molecules making up macular pigment in the human retina. This can be achieved in vivo with a new, simple, compact instrument, utilizing a dielectric, angle-tuned band-pass filter for wavelength selection and single-channel photo-multiplier detection for Raman responses. MP concentration measurements are fast and accurate, as seen in experiments with model eyes and living human eyes. The ease and rapidity of Raman MP measurements, the relative simplicity of the instrumentation, the high accuracy of the measurements, and the lack of significant systematic errors should make this technology useful for widespread clinical research.
Acknowledgments
This research was supported by grant 5 R42 EY 12324-03 from the National Institutes of Health, and by Spectrotek, L.C.
References
- 1.Schalch W, Dayhaw-Barker P, Barker FM. The carotenoids of the human retina. In: Taylor A, editor. Nutritional and Environmental Influences on the Eye. CRC; Boca Raton, FL: 1999. pp. 215–250. [Google Scholar]
- 2.Seddon JM, Ajani UA, Sperduto RD, Hiller R, Blair N, Burton TC, Farber MD, Gragoudas ES, Haller J, Miller DT, Yanuzzi LA, Willet W. J Am Med Assoc. 1994;272:1413. [PubMed] [Google Scholar]
- 3.Beatty S, Koh H-H, Henson D, Boulton M. Surv Ophthalmol. 2000;45:115. doi: 10.1016/s0039-6257(00)00140-5. [DOI] [PubMed] [Google Scholar]
- 4.Reading VM, Weale RA. J Am Optom Assoc. 1974;64:231. [Google Scholar]
- 5.Beatty S, Murray IJ, Henson DB, Carden D, Koh H-H, Boulton ME. Invest Ophthalmol Visual Sci. 2001;42:439. [PubMed] [Google Scholar]
- 6.Bernstein PS, Zhao D-Y, Wintch S, Ermakov I, McClane R, Gellermann W. Ophthalmology. 2002;109:1780. doi: 10.1016/s0161-6420(02)01173-9. [DOI] [PMC free article] [PubMed] [Google Scholar]
- 7.Neelam K, O’Gorman N, Nolan J, O’Donovan O, Bee WH, Au Eong KG, Beatty S. Invest Ophthalmol Visual Sci. 2005 paper in press. [Google Scholar]
- 8.Ermakov IV, Ermakova MR, Gellerman W, Lademann J. J Biomed Opt. 2004;9:332. doi: 10.1117/1.1646172. [DOI] [PubMed] [Google Scholar]
- 9.Ermakov IV, Ermakova MR, McClane RW, Geller-mann W. Opt Lett. 2001;26:1179. doi: 10.1364/ol.26.001179. [DOI] [PubMed] [Google Scholar]
- 10.Shreve AP, Trautman JK, Owens TG, Albrecht AC. Chem Phys Lett. 1991;178:89. [Google Scholar]
- 11.Koyama Y, Takatsuka I, Nakata M, Tasumi M. J Raman Spectrosc. 1988;19:37. [Google Scholar]
- 12.Ermakov IV, Ermakova MR, Gellerman W, Bernstein PS. J Biomed Opt. 2004;9:139. doi: 10.1117/1.1627776. [DOI] [PMC free article] [PubMed] [Google Scholar]
- 13.Ermakov IV, McClane RW, Gellermann W, Bernstein PS. Opt Lett. 2001;26:202. doi: 10.1364/ol.26.000202. [DOI] [PubMed] [Google Scholar]
- 14.Gellermann W, Ermakov IV, Ermakova MR, McClane RW, Zhao D-Y, Bernstein PS. J Opt Soc Am A. 2002;19:1172. doi: 10.1364/josaa.19.001172. [DOI] [PubMed] [Google Scholar]
- 15.American National Standards Institute. ANSI Z136.1-2000 Sec 8.3. Laser Institute of America; Orlando, FL: 2000. American national standard for safe use of lasers. [Google Scholar]