Abstract
We describe resonance Raman imaging (RRI) of macular pigment (MP) distributions in the living human eye. MP consists of the antioxidant carotenoid compounds lutein and zeaxanthin, is typically present in high concentrations in the healthy human macula relative to the peripheral retina, and is thought to protect this important central region from age-related macular degeneration. We demonstrate that RRI is capable of quantifying and imaging the spatially strongly varying MP distribution in the human retina. Using laser excitation of the MP molecules at 488 nm, and sequential camera detection of light emitted back from the retina at the MP’s strongest Raman peak position and at an off-peak position, RRI maps of MP are obtained at a resolution below 50 μm within a fraction of a second per exposure. RRI imaging can be carried out with undilated pupils and provides a highly molecule-specific diagnostic imaging approach for MP distributions in human subjects.
1. INTRODUCTION
There is currently strong interest in developing noninvasive optical techniques for the detection of macular pigment (MP) in the human retina. MP is composed of the carotenoid compounds lutein and zeaxanthin, and there is increasing evidence that they help mediate protection against visual loss from age-related macular degeneration (AMD) [1–6], the leading cause of irreversible blindness affecting a large portion of the elderly population [7,8]. Since the MP compounds are taken up through the diet, there is a chance that early age screening of MP concentrations to identify individuals with low levels of MP, accompanied with dietary interventions such as nutritional supplementation, will help prevent or delay the onset of the disease [9–14].
MP in the human retina is concentrated in the foveal region of the macula, a ~1 mm diameter tissue location with a high density of cone photoreceptors, enabling high-acuity color vision. When viewed in cross section, MP is located anterior to the photoreceptor outer segments and the retinal pigment epithelium [15,16], and therefore it is thought to shield these vulnerable tissues from light-induced oxidative damage by blocking phototoxic short-wavelength visible light. Also, MP may directly protect the cells in this area, since lutein and zeaxanthin are efficient antioxidants and scavengers of reactive oxygen species, although their concentrations in the photoreceptor outer segments and retinal pigment epithelium are orders of magnitude lower than in the Henle fiber (cone axon) layer [15,16]. MP concentrations in the healthy human retina are usually assumed to be highest in the very center of the macula, the foveola, and to drop off rapidly with increasing eccentricity, especially when using low-spatial-resolution techniques such as heterochromatic flicker photometry [17,18].
Higher-resolution optical imaging techniques are of interest since they can quantify MP levels and at the same time display spatial variations in the MP distributions, such as varying peak widths and ring-shaped patterns [19–23]. This allows one to investigate correlations of MP patterns with developing pathology and also to track any potential MP level and spatial changes in human subjects upon dietary modification or supplementation.
Resonance Raman spectroscopy has been previously used as an objective optical approach for the detection of carotenoids in living human tissue, including the skin and the retina [24–26]. This Raman method uses excitation of the carotenoids in their absorption band occurring in the blue/green wavelength region and detects resonantly enhanced light scattered at a frequency that is downshifted from the laser excitation frequency by the amount of the vibrational stretch frequency of the carbon double bonds (1525 cm−1) that are part of the backbone of all carotenoid molecules. Since the vibrational line width is spectrally very narrow (smaller than the nanometer-scale instrument line width of the employed high-throughput, low-resolution spectrographs), and since it is unique for each Raman active molecule, the carotenoid Raman response can be easily distinguished from any simultaneously excited, overlapping tissue fluorophores that typically have emission bandwidths that are orders of magnitude wider. For this reason, resonance Raman detection of carotenoids is a highly specific detection approach. Previous Raman measurements of MP in the living human retina employed a relatively small (~1 mm diameter) laser excitation disk projected onto the macula and were thus limited to a detection mode that spatially averaged over the whole foveal region. Resonance Raman imaging (RRI) of MP distributions with physiologically relevant MP concentrations could be realized, too, but the approach has been limited so far to excised human eye-cups [27]. Interestingly, RRI imaging of MP distributions in these excised tissue samples revealed significant deviations from the previously assumed standard rotationally symmetric MP pattern with a high central pigment level and a monotonous decline toward increasing eccentricity. A large fraction of the samples displayed strikingly different axially and rotationally asymmetric MP distribution patterns, including complete or incomplete cone-shaped patterns with sometimes strongly depleted central levels, strongly varying concentration levels between samples, and widely differing widths of the distributions [27].
Earlier studies using small-stimulus heterochromatic flicker photometry measurements of MP distributions in the living human retina [28] and reflectometry-based, two-wavelength imaging with a scanning laser ophthalmoscope [19] had already found deviations such as small central MP depressions and radial profiles with shoulders [19,29]. In spite of these findings, MP distributions are still sometimes modeled with a simple rotationally symmetric, single-exponentially declining function [18]. Since the Raman imaging results obtained with excised eyecups clearly demonstrated the existence of more complex features of human MP distributions, we developed the Raman method as a further objective method for imaging of MP distributions in the living human retina.
MP imaging alternatives to RRI are based on refined lipofuscin excitation spectroscopy (“autofluorescence imaging”) [30,20–22] and fundus reflection methods [23,31]. Compared to RRI imaging, these approaches lack the high carotenoid specificity, but if properly implemented both methods appear to be capable of accurately extracting the spatial features of MP distributions in the living human retina. A recent analysis of MP properties in 41 subjects used two-wavelength autofluorescence imaging with a modified fundus camera and found a bimodal spatial MP distribution pattern in over half of the subjects [32]. The observed pattern is described as an annulus of higher MP density, located at a mean eccentricity of 0.7°, superimposed on a central exponential-like distribution [32]. The bimodal pattern was observed more frequently in women than in men, and women were reported to have a broader MP distribution than men [32]. A fragmentation of the ring was observed for subjects with old age [32]. Largely similar findings were obtained in a study of 53 subjects using two-wavelength reflection as well as autofluorescence-based imaging with a scanning laser ophthalmoscope setup. MP distributions reportedly displayed a ring structure at the same mean 0.7° eccentricity in approximately half the subjects [23]. The authors obtained a good fit to their data with a superposition of a rotationally symmetric, exponentially decaying density as a function of eccentricity, and a rotationally symmetric, Gaussian-distributed ring pattern [23]. No age or gender effects in the prominence of the ring were observed in this study [23].
As one aspect of this work, we test these findings by comparing, for the same subject population, RRI-based MP imaging results with imaging results obtained with a recently developed nonmydriatic version of the lipofuscin imaging method [33].
2. RESONANCE RAMAN IMAGING INSTRUMENTATION AND VALIDATION EXPERIMENTS
Schematics of the RRI instrument are shown in Fig. 1. Blue light from a solid-state 488 nm laser is routed onto a subject’s retina via an optical fiber, a collimating lens, L1, a laser line filter, F1, an achromatic beam expander, L2, a dichroic beam splitter, BS1, and an aperture, AP. The laser excitation disk projected onto the retina has a diameter of ~3.5 mm and has an intermediate focus at the position of the aperture. Laser speckle was effectively removed by mechanically shaking the light delivery fiber of the excitation laser beam, which generates a spatially homogeneous laser excitation spot via fiber mode mixing. A red aiming light, coupled into the setup with beam splitter, BS2, serves as a fixation target for the subject during a measurement. It is projected onto the retina as a ~200 μm diameter disk. The optical shutter is designed such that it allows a small portion of the excitation light, ~0.1 mW, to be transmitted even when it is closed, so the subject can view both the red fixation target and the superimposed excitation disk for optimum head alignment. The latter takes about 15 s. To compensate for refractive errors of the subjects’ eyes, correction lenses are inserted in the detection beam path in front of F2.
Fig. 1.
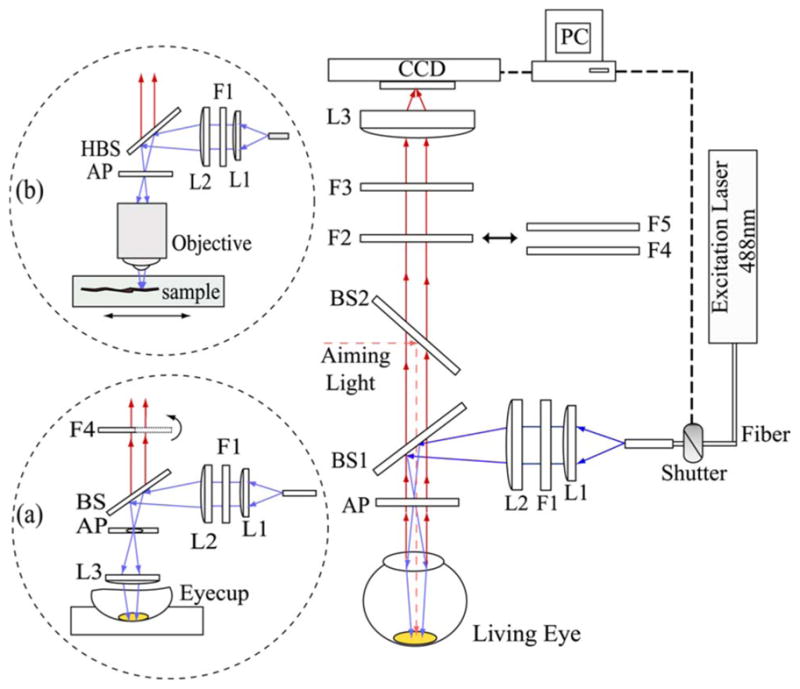
(Color online) Schematics of RRI system used to measure MP distributions in the living human eye and in excised retinal sample preparations. A 488 nm excitation beam from a solid-state laser is routed onto the retina via an optical fiber, collimating lens, L1, laser line filter, F1, achromatic beam expander, L2, dichroic beam splitter, BS1, and aperture, AP. Beam spot size on the retina is 3.5 mm in diameter. Light emitted from the retina is imaged onto the pixel array of a CCD camera with a 50 mm achromat. For RRI imaging, the light returned from the retina is first filtered with a combination of a narrowband tunable filter, F4, a bandpass filter, F5, and a notch filter, F3, effectively limiting the transmitted wavelength range to 528 nm, the spectral position of the resonance Raman response of MP under 488 nm excitation. In order to determine a correction for the background fluorescence, the light returned from the retina is filtered, in a second image, with a bandpass filter centered in the vicinity of the Raman peak at ~540 nm. Inset (a) shows the modification of the setup for measurements of excised eyecups, which are Raman imaged with the help of an angle-tunable filter, F4, tuned to two “on” and “off” Raman peak spectral positions near 528 nm. Inset (b) shows the modification for RRI imaging of retinal tissue sections through a microscope. Samples can be viewed with white-light illumination and translated with micrometer-scale precision.
The light emitted from the excited disk of the retina is collimated by the subject’s eye lens and imaged with a 50 mm achromat onto the 512×512 pixel arrays of a CCD camera (Model ST-9 XE, Santa Barbara Instrument Group, Inc.). Individual pixel dimensions are 20 μm height by 20 μm width; quantum efficiency in the visible wavelength range is about 60%. Pixel binning (3×3) is used to further enhance the camera sensitivity. Background noise levels were typically in the range of 100 counts per pixel, total signal counts typically amounted to ~10,000 counts per pixel. The CCD array was kept at a temperature of −10°C during measurements. The instrument is interfaced to a computer that controls a mechanical shutter and acquires data via camera manufacturer supplied software. For data analysis, the pixel intensity maps are converted to files suitable for export into image processing software (The MathWorks, Inc.).
For each measurement two separate images are recorded. In the first image, the light returned from the retina under 488 nm excitation is filtered to transmit only 528 nm light, which is the spectral position of the resonance Raman response of the 1525 cm−1 carbon-carbon double bond (C==C) stretch frequency of the MP carotenoids. This is achieved with a combination of a narrow-bandpass filter, F4 (transmission range 528±1 nm), a broader bandpass filter F5 (transmission window 525±15 nm), and a notch filter, F3. The latter blocks light scattering at the excitation wavelength and is most effective when used in combination with an aperture AP (diameter, 3.5 mm), which limits any reflected excitation stray light to a small beam diameter with paraxial propagation. The aperture, placed ~2 cm in front of the subject’s cornea, also serves to restrict the light exiting the subject’s eye to a small (3.5 mm diameter) beam waist at the pupil in order to minimize pupil size effects. The obtained image contains the Raman response of MP and overlapping background fluorescence components. In the second image, “fluorescence image,” the light returned from the retina is filtered with a bandpass filter, F2 (used in combination with F3), to transmit only background fluorescence components slightly above the Raman wavelength, in the 530–550 nm range. As further explained below, this image is subtracted from the first image to retrieve the pure RRI image of the MP distribution.
For measurements of excised eyecups, the setup is modified as sketched in inset (a) of Fig. 1. Fluorescence measurements are not needed in this case, and the Raman images are derived from two measurements taken with a narrowband tunable filter that is angle tuned to “on” and “off” Raman spectral positions, as described elsewhere [27]. In a similar modification, the instrument was interfaced to a microscope, as shown in inset (b), for the purpose of Raman imaging of excised retinal tissue samples with micrometer-scale resolution.
Human subjects were recruited from an eye clinic and had their eyes either dilated or undilated, depending on their prior eye examination. To exclude pupil size effects, subjects with dilated eyes were chosen for intersubject comparisons involving absolute MP levels. Other measurements, such as the identification of a specific type of spatial MP pattern in a subject’s eye, or the monitoring of the MP distribution in a subject’s eye over time, were carried out with undilated eyes (see below).
Measurements were carried out in a semidarkened room. Laser power levels at the cornea were 4 mW during a measurement; exposure times were 100 ms for background fluorescence measurements and 300 ms for RRI. At a retinal spot size of 3.5 mm diameter, the area of the exposed retinal field is 0.096 cm2, and the retinal radiant exposure is (4 mW)(400 ms)/0.096 cm2=16.7 mJ/cm2, assuming all radiant power enters the pupil. To put this level into perspective, we compare it with the thermal and photochemical safety limits. Both can be determined from the ANSI standard [34] or from a recently published, more concise formulation of the exposure limits [35]. For the thermal limit, one obtains a 69.3 mJ/cm2 maximum permissible radiant exposure at the cornea and 277 mJ/cm2 at the retina [36]. Thus, the exposure for a single measurement is safe by a factor of 16. The photochemical limit for retinal injury is listed in the same standard as 15.5 J/cm2 for the used wavelengths but does not need to be invoked, since the exposure duration is less than 0.7 s [34] (at the used energy density of 3 mJ/cm2, the exposure would be a factor of ~5000 below the photochemical limit for RRI and a factor of ~15,000 for the recording of the fluorescence image). The laser light exposures caused afterimages that typically disappeared within a few minutes. During this time, the filters were changed to switch from Raman to fluorescence imaging.
Raman and fluorescence signals produced within the ocular media (OM) and retinal layers upon optical excitation with intensity I(λexc) are illustrated in Fig. 2. Under laser excitation with spectral overlap of the MP absorption, a resonance Raman response is obtained only from the MP-containing retinal layer [24]. Fluorescence signals of MP can be neglected since the corresponding fluorescence quantum efficiency is extremely weak. The influence of the photoreceptors in the detector response can be neglected as well since the used light intensities are high enough to ensure temporary bleaching (see below and [33]).
Fig. 2.
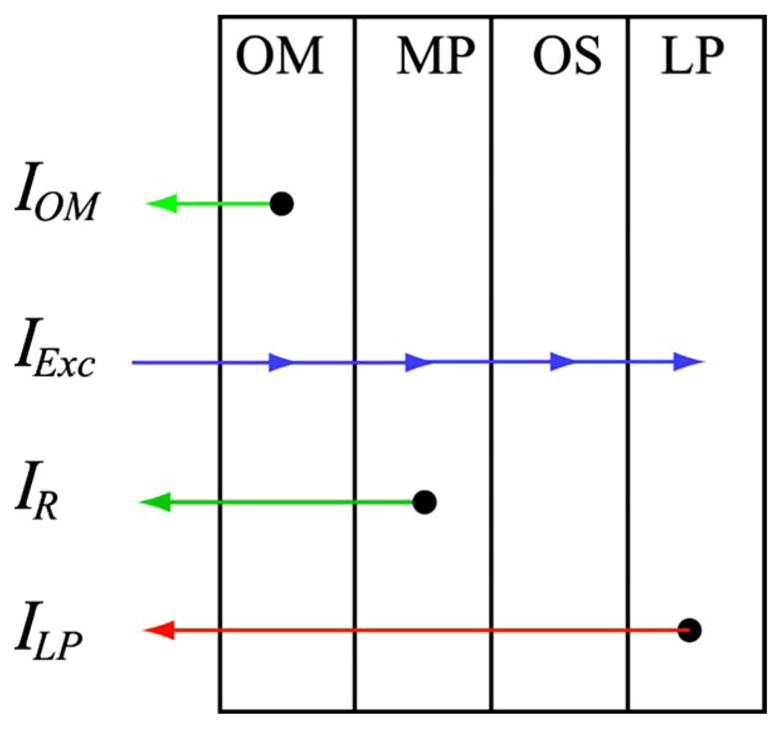
(Color online) Schematics of retinal layer system with indication of excitation and emission light intensities encountered in RRI of MP: OM, anterior optical media; MP, macular-pigment-containing layer; OS, photoreceptor outer segment layer; LP, lipofuscin-containing layer; IOM, light intensity originating from optical media fluorescence; IR, Raman response from MP; ILP, light intensity due to lipofuscin fluorescence (see text).
Under these assumptions, the light intensity, IDet, that is detected in each pixel of the CCD detector array at the spectral position of the Raman wavelength, λR, can be written as
| (1) |
The first term describes fluorescence from the OM, the second term the Raman response from MP, and the third term fluorescence from lipofuscin (LP). In Eq. (1), αOM and αLP are the absorption coefficients of the optical media and lipofuscin, respectively; TOM and TMP are the percentage transmissions of the optical media and MP, respectively, at the indicated absorption and emission wavelengths; NMP is the concentration of the MP molecules, and σMP is their Raman scattering cross section; and ηOM and ηLP describe the quantum efficiencies for optical media and lipofuscin fluorescence transitions, respectively.
The detector signal at the Raman wavelength is a superposition of a weak, spectrally narrow Raman signal and a typically 100-fold stronger and spectrally broad background fluorescence (mostly from the lens and lipofuscin). To retrieve the MP Raman response, the superimposed fluorescence intensities need to be measured and subtracted from the total detector signal. The contribution of the broad fluorescence at the Raman wavelength is approximately the same as at a wavelength slightly offset to a longer wavelength position, λoffset, since all coefficients in the fluorescence terms of Eq. (1) vary only very modestly with wavelength, i.e.,
| (2) |
Accordingly, the Raman term in Eq. (1),
is proportional to the difference of the detector intensities at the Raman wavelength, λR, and the adjacent, slightly longer wavelength, λoffset:
The two optical filters used in the imaging at λR and λoffset have different effective transmissions, TR and Toffset, respectively, due to their differing spectral bandwidths. Therefore, the detector intensities measured at the two wavelengths need to be weighted accordingly with these factors, and one finally obtains
In this expression, all quantities are known except the transmission coefficients for the optical media (see below for a discussion of this factor).
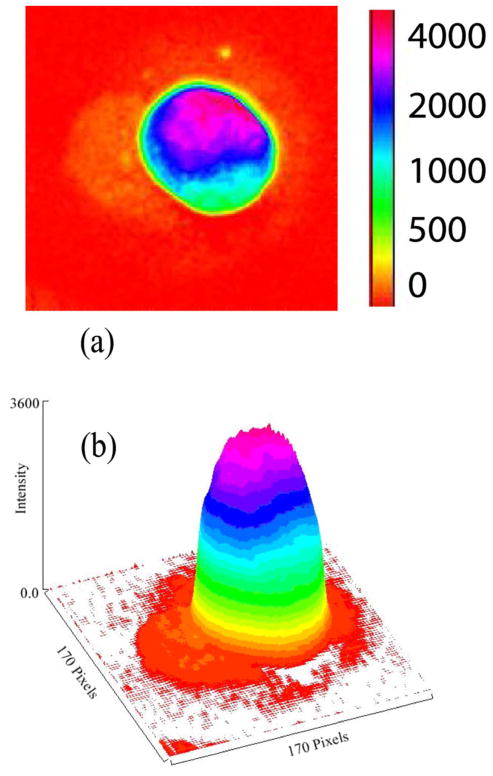
In order to determine the correct position of the angle-tunable transmission filter, to check for the linearity between resonance Raman response and optical density of MP, and to determine the dynamic range of the method, we first measured a number of dried lutein drops with widely differing concentration levels. All drops were spotted onto polyvinyl pyrolidine difluoride (PVDF) substrates. In Fig. 3 we show the RRI image obtained for the lutein drop with the highest concentration level in the center [optical density (OD) ≈0.8]. The intensity of each pixel is color coded according to the linear intensity scale shown at the right. Similar imaging measurements were carried out with half a dozen drops of varying lutein concentrations. The integrated response was found to be roughly linear in concentration up to the highest level.
Fig. 3.
(Color online) En face (a) and three-dimensional (b) pseudocolor-scaled RRI images of a dried drop of lutein spotted onto a PVDF substrate. The lutein solution had a physiological carotenoid concentration OD ≈0.8. The intensity of each pixel is color coded according to the scale shown in (a) and is displayed as a function of pixel position in the camera CCD array (1 pixel= 20 μm).
In a second step, to further validate the RRI setup with physiologically encountered human pigment distributions, we imaged 11 excised human donor eyecups, again widely varying in MP levels, and compared RRI-derived MP levels with levels derived from high-performance liquid chromatography (HPLC) levels. Postmortem human eyes were obtained from the Utah Lions Eye Bank within 24 to 48 h after corneas had been removed for surgical transplantation. All eyes measured were from donors free of macular and retinal diseases. None of the donors had a history of significant lutein supplementation premortem. The eyes were placed on a glass holder, the anterior segment was carefully cut away, and the posterior segments with the macula were left in situ for RRI imaging. At the conclusion of the imaging experiments, the macula was punched out with a 5 mm diameter trephine, and macular carotenoids were extracted and analyzed by well-known HPLC methods.
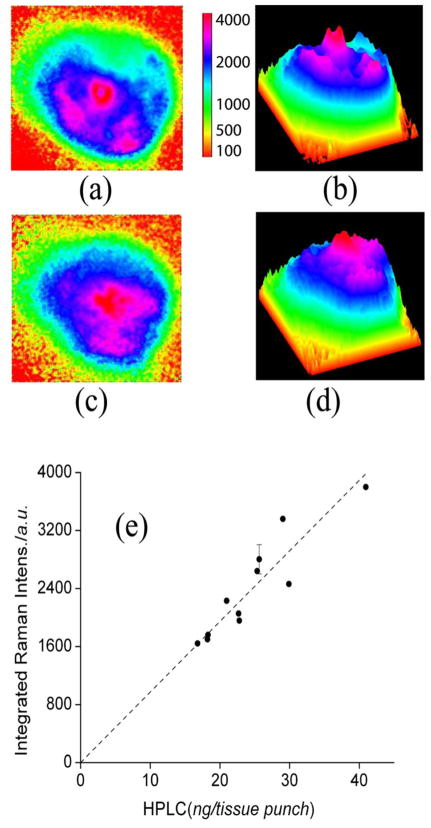
Two-dimensional and three-dimensional pseudocolor Raman images are shown for two representative eyecups in Fig. 4. The first eyecup features an elongate distribution with a relatively strong central peak that has a small depression in it and that is surrounded by a broken-up ring structure [Figs. 4(a) and 4(b)]; the other eyecup displays a strongly asymmetrical distribution with high central levels and a relatively smooth decline toward increasing eccentricities [Figs. 4(c) and 4(d)]. In Fig. 4(e) we plot the spatially integrated Raman intensities obtained from the MP RRI images of all eyecups and compare these optically derived intensities with HPLC-derived MP concentration levels. A high correlation is obtained between optical and biochemical methods (R=0.92; p=0.0001).
Fig. 4.
(Color online) (a), (c) Two-dimensional, pseudocolor Raman images of 2 of the 11 donor eyecups imaged to establish a correlation between Raman- and HPLC-derived carotenoid levels; (b), (d) corresponding three-dimensional images. The color scale bar indicates the color coding of light intensities. The graph in (e) shows the correlation between optical intensities integrated over the macular regions of the eyecups and subsequently derived HPLC levels obtained for 8 mm diameter tissue punches centered on the macula (correlation coefficient R=0.92; p < 0.0001).
3. RESONANCE RAMAN IMAGING OF HUMAN SUBJECTS
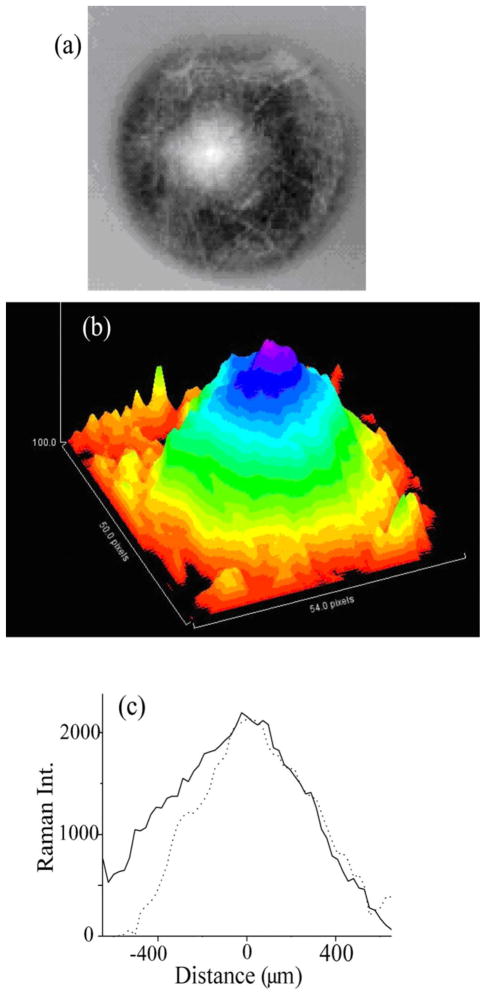
For RRI imaging of MP distributions in human subjects, we recruited 17 healthy volunteers. All procedures were performed with Institutional Review Board (IRB) approval and were in accordance with the tenets of the Declaration of Helsinki. The demographic characteristics of the population are shown in Table 1. Imaging details for one of the subjects are shown in Fig. 5. Figure 5(a) shows the gray-scale image obtained after subtraction of the fluorescence background; Fig. 5(b) a pseudocolor, three-dimensional representation of the distribution; and Fig. 5(c) two line plots along the nasal–temporal and inferior–superior meridians, respectively. The MP distribution in this subject features a wide, axially slightly asymmetric distribution with relatively high central MP levels and a monotonous decline of MP levels toward the peripheral retina. The spatial resolution obtainable with the instrument is below ~50 μm, as can be determined from the size of small blood vessels discernable in the gray-scale images (also refer to [33]).
Table 1.
Demographics of the Population
| Number of normal subjects | 17 |
| Age (yr: mean±SD) | 47±17 |
| Age range (yr) | 22–79 |
| Female (%) | 24 |
| Male (%) | 64 |
| White subjects (%) | 100 |
| Nonwhite subjects (%) | 0 |
| Nonsmokers (%) | 100 |
| Active smokers (%) | 0 |
Fig. 5.
(Color online) RRI results for MP distribution in living human eye. (a) Typical gray-scale image obtained after subtraction of fluorescence background from pixel intensity map containing Raman response and superimposed fluorescence background. (b) Pseudocolor-scaled, three-dimensional representation of gray-scale image. (c) Line plots along nasal–temporal (solid curve) and inferior–superior meridians (dashed curve), both running through the center of the MP distribution.
To check whether the obtained imaging results depend on the degree of bleaching of the photoreceptors, we compared two images of a subject’s retina, one obtained after exposing it to blue bleaching light for 2 min, and the other obtained after no bleaching. The resulting images were seen to be identical.
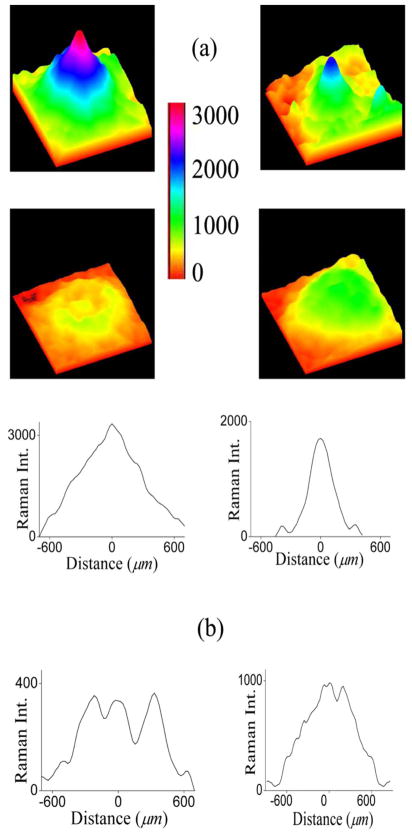
When evaluating the MP distributions of all subjects, distinctly different categories are apparent, represented by the distributions shown in Fig. 6(a): A category displaying relatively wide spatial distributions with a high central level, a second one again with high central levels but narrower spatial extent, a category with a ringlike MP distribution surrounding a central MP peak, and a category with relatively wide but overall low levels. Intensities in the four distributions are all color coded with the same intensity bar. Also, the spatial dimensions are identical. The line plots shown in Fig. 6(b) correspond to the images in Fig. 6(a). They run along primary meridians and highlight the significant intersubject variations in MP levels, symmetries, and spatial extent.
Fig. 6.
(Color online) (a) Pseudocolor-scaled, three-dimensional MP RRI images obtained from four healthy subjects, demonstrating significant intersubject variations in MP levels, symmetries, and spatial extent. Note ringlike MP distribution with small central MP peak and overall low levels in one of the cases (lower left). All images are color coded with the same intensity bar. (b) Intensity plot profiles derived for each MP distribution from pixel intensity maps (22×1400 μm rectangles) running along nasal–temporal meridians through the center of the macula.
In Fig. 7, we summarize the main results of a comparison of MP distributions and concentrations obtained with Raman imaging and nonmydriatic lipofuscin fluorescence excitation [33], respectively. Figures 7(a) and 7(b) compare images of both methods, obtained for the same subject. Compared to the RRI image, the fluorescence-based image is nearly identical, with the exception of a smoother appearance of the distribution. This is due to the derivation of the MP density map as the logarithm of a ratio between perifoveal and foveal fluorescence intensities, which tends to slightly compress the “dynamic range” of the density map amplitudes and smoothen out the resulting MP distribution. For a subgroup of 17 subjects, we integrated the MP levels of images obtained with both methods for each individual over the whole macula region and plot the results in Fig. 7(c). Using a best fit that is not forced through zero, we obtain a high correlation coefficient of R=0.89 between both methods. Forcing the fit through zero makes the correlation coefficient drop slightly to R=0.80. The high correlation is remarkable in view of the completely different optical beam paths and derivation methods used to calculate MP densities in both methods.
Fig. 7.
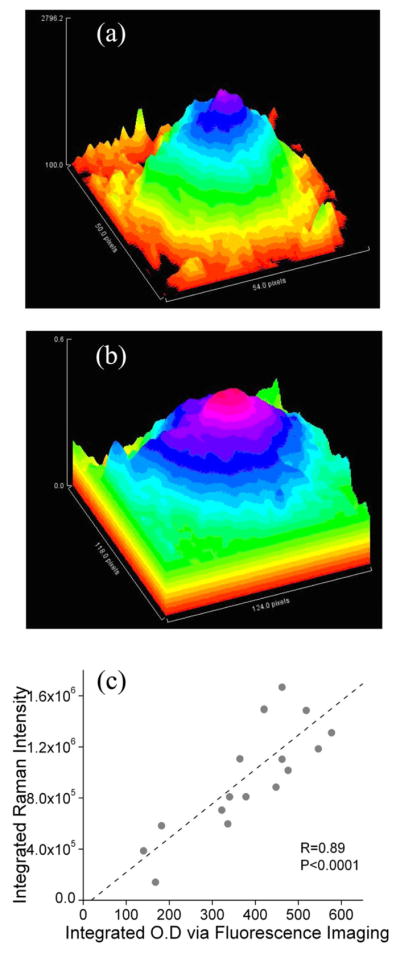
(Color online) Images of MP distributions obtained for the same subject with (a) RRI and (b) fluorescence-based imaging. (c) Comparison of integrated MP densities obtained for 17 subjects with Raman- and fluorescence-based imaging methods. Vertical scale shows integrated MP densities derived from RRI images by integrating intensities over the whole macular region; horizontal scale shows corresponding densities derived via fluorescence imaging. A high correlation coefficient of R=0.89 is obtained for both methods, using a best fit that is not forced through zero. If the fit is forced through zero (not shown), one obtains a correlation coefficient R=0.80.
To explore a potential correlation between MP levels and retinal thickness, we measured for a subgroup of eight subjects the retinal layer thickness with optical coherence tomography depth scans (Zeiss Humphrey, Stratus OCT-3). In Fig. 8 we plot MP optical density levels measured in the center of the fovea versus the corresponding retinal layer thickness for each individual. While the retinal layer thickness varies between ~120 and 180 μm in these subjects, the MP density level of the thinnest measured retina, 120 μm, is higher than for a retina with ~50% higher thickness (170 μm). Also, MP density levels for six subjects with nearly identical retinal thickness in the 170 μm range show up to threefold differences in pigment levels. While limited to only a few subjects, these results demonstrate only a weak correlation between MP levels and retinal thickness, if any. In comparison, a recent study of several hundred subjects measured with heterochromatic flicker photometry (HFP) and two-wavelength fluorescence-based imaging showed a weak (R=0.3) positive correlation between central MP levels and retinal thickness and no correlation at eccentric locations [37].
Fig. 8.
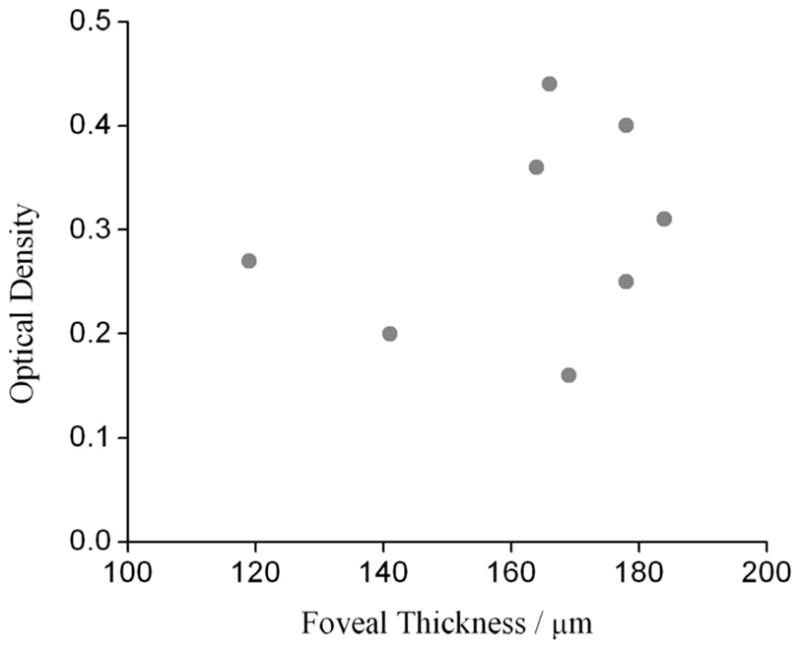
Optical density in fovea versus thickness of retina in foveal pit, measured for eight healthy subjects. Thickness data were obtained from optical coherence tomography scans (see text).
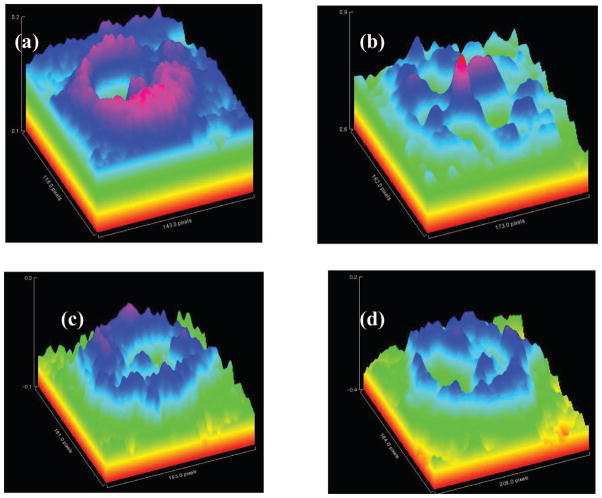
In Fig. 9 we show RRI-derived, pseudocolored three-dimensional MP distributions for three subjects with representative ringlike MP distributions. The distribution for a 57-year-old healthy male [Fig. 9(a)] consists of a narrow central peak and a surrounding strong, nearly complete oblong ring. MP levels in the ring are slightly higher than in the center, feature a noticeable disruption/offset at the “2 o’clock” position, and also reveal a noticeable variation in wall thickness along its perimeter. The inside ring diameter is ~350 μm for the nasal–temporal and inferior–superior meridians, while the outside diameter is 750 μm for the nasal–temporal meridian and 650 μm for the inferior–superior meridian. The distribution of a 70-year-old female diagnosed with a mild form of dry AMD [Fig. 7(b)] shows a weak, nearly rotationally symmetric but broken-up ring structure (diameter ~720 μm) with a relatively high central peak (half-width, 200 μm) and crosslike spokes. The distribution of a 62-year-old healthy female, measured in both eyes before and after vitreous detachment, changes from the pattern of Fig. 7(c) to that in Fig. 7(d), featuring an off-center, double-peak structure inside an oblong ring (nasal–temporal axis, ~1050 μm; inferior–superior axis, ~900 μm width). Detachment of the vitreous apparently caused the split of a single central MP peak into an off-center, double-peak structure in this subject. These results indicate that pathological changes in the retina and/or the vitreoretinal interface may contribute to the appearance of these ring-shaped MP distributions.
Fig. 9.
Pseudocolor RRI images of three subjects with ringlike MP distributions. (a) (Multimedia online; josaa.osa.org) A 57-year-old healthy male with MP distribution consisting of a narrow central peak and a surrounding strong, nearly rotationally symmetric distribution. MP levels in the ring are slightly higher than in the center and feature a noticeable disruption/offset at the “2 o’clock” position. (b) A 70-year-old female diagnosed with a mild form of dry AMD, showing a weak, broken-up ring structure with central high MP density and crosslike spokes. (c), (d) MP distributions in left (c) and right eye (d) of a 62-year-old female measured after detachment of the vitreous in the right eye. Six months prior to detachment, RRI images revealed the same ringlike MP pattern with a central spike in both eyes. Detachment of the vitreous apparently caused the formation of a double-peak MP structure inside the MP ring in this subject.
4. DISCUSSION
The obtained results show that RRI can be used to image MP distributions in human subjects with high molecule specificity at high (~10 μm scale) spatial resolution and that the imaging can be carried out with dilated as well as undilated eyes. The method can be validated with HPLC methods in model systems such as dried lutein spots and in excised human eyecups. The RRI results confirm that highly spatially differing MP patterns observed previously in excised eyecups exist also in the living human retina. Spatially complex MP distribution patterns are seen throughout the subject population. They vary strongly regarding widths, axial and rotational asymmetries, locally depleted areas, and integrated concentration levels. A comparison of the RRI results with fluorescence-based imaging in the same population shows MP distributions with comparable detail and structure and a high correlation between absolute MP levels (R=0.89, p =0.0001). This is remarkable since the underlying assumptions, spectroscopic detection, and processing principles differ drastically in their methodologies. For example, RRI-derived MP levels are attenuated, in principle, by media attenuations, while fluorescence-based results are not.
RRI uses the backscattered, single-path Raman response from lutein and zeaxanthin in the MP-containing retinal layer and largely avoids light traversal through the deeper retinal layers. It does not rely on any reflection of light at the sclera. Overlapping fluorescence signals from the lens and deeper layers can be easily subtracted from the overall light response. Importantly, RRI has no assumptions other than approximating the spectrally broad background fluorescence with the fluorescence response at a wavelength that is slightly offset from the MP Raman response. Furthermore, RRI is a measure of the absolute MP concentration distribution in the macular region since it does not use a reference point in the peripheral retina. In comparison, lipofuscin fluorescence-based and reflectance-based imaging methods are less specific detection methods since they detect the light emitted or reflected from other compounds and derive the absorption features of the MP compounds only indirectly. In these approaches, they have to take into account single- and double-path light traversal, respectively, through deeper retinal layers, have to carefully eliminate image contrast diminishing fluorescence and scattering from the optical media (via confocal detection techniques, filtering, etc.), have to bleach the photoreceptors, and have to use a location in the peripheral retina as a reference point. The peripheral reference could potentially lead to an underestimation of the MP density, especially in individuals regularly consuming high-dose lutein supplements, which can cause substantial increases in even peripheral carotenoid levels [38]. As an advantage of these methods, however, the peripheral reference location allows one to eliminate, in first order, any potentially confounding attenuation from anterior optical media.
Attenuation effects caused by the optical media are fully effective in the Raman method. Two recent studies carried out with modern objective optical methods have shown that the in vivo absorption levels of the human lens are much smaller than originally thought, even in the aging lens [39,40]. In contrast, a very recently published comprehensive analysis of literature data on media transmission [41] largely confirmed the older Pokorny algorithm [42], which predicts significant lens attenuations in the visible wavelength range. Furthermore, their analysis concluded that [39,40] tended to underestimate the absorption around and above 500 nm. According to [41], the total optical densities of the optical media at the Raman excitation wavelength, 488 nm, and the carotenoid carbon double bond stretch frequency, 528 nm, would increase from 0.4 to 0.6 for ages 20–60 years. Light loss by scattering, including large particles, appears to dominate in this analysis at wavelengths >500 nm, relative to absorption losses [41]. If correct, these attenuation effects will have to be taken into account for intersubject comparisons of Raman-based measurements of absolute MP levels. Experimentally, this could be achieved by in situ measurements of media attenuations with Purkinje imaging techniques, using reflections from the cornea and lens.
Potentially existing unknown optical losses from the lens would be irrelevant for the Raman method in longitudinal studies, provided that they are carried out over a time span in which lens absorptions can be considered to stay constant (1 to 2 years) [43], or in any other studies involving subjects with lens implants. The Raman method in its current implementation would therefore be well suited, for example, for nutritional supplementation trials, studies in which significant increases in individual MP levels have been demonstrated to be achievable in a time span of 12 months [13].
In conclusion, we note that Raman-derived MP measurements agree in important aspects (large intersubject differences in MP levels, occurrence and location of ring-like MP structures, and age effects) with previous results obtained with eyecups and with results obtained for the same healthy, unsupplemented population with the completely different objective method of lipofuscin fluorescence spectroscopy. Since the Raman method is an imaging modality with high molecule specificity and relies on only a few assumptions, the RRI imaging results provide independent evidence for a more complicated nature of MP distributions in human subjects.
Regarding technological aspects, RRI requires excitation with a single, narrowband light source, such as a laser, and image recording and processing at two wavelengths, one centered on the strongest MP Raman peak and one in its spectral vicinity. In comparison, lipofuscin fluorescence-based MP imaging can be carried out with nonlaser sources, in principle, and therefore may have a practical advantage. Furthermore, it appears possible with this method, under properly chosen excitation and detection conditions, to obtain MP images with a high accuracy (~95%) using only a single excitation wavelength and therefore only a single light exposure [33].
Future studies with supplemented subjects and subjects with retinal pathology are needed to further evaluate the pros and cons of all objective imaging technologies.
Acknowledgments
This work was supported in part by grants from the State of Utah (Biomedical Optics Center of Excellence grant), by Spectrotek L.C., the National Eye Institute (EY 11600), and the Research to Prevent Blindness Foundation (New York, New York). W. Gellermann, P. S. Bernstein, and the University of Utah hold patent rights to the Raman technology described in this article, and these authors and the University own significant equity interests in Spectrotek, L.C., a company that has licensed the technology.
REFERENCES AND NOTES
- 1.Age-Related Eye Disease Study Research Group. The relationship of dietary carotenoid and vitamin A, E, and C intake with age-related macular degeneration in a case-control study. AREDS Rep. No. 22, Arch. Ophthalmol. (Chicago) 2007;125:1225–1232. doi: 10.1001/archopht.125.9.1225. [DOI] [PubMed] [Google Scholar]
- 2.Eye Disease Case-Control Study Group. Dietary carotenoids, vitamins A, C, and E, and advanced age-related macular degeneration. J Am Med Assoc. 1994;272:1413–1420. [PubMed] [Google Scholar]
- 3.Eye Disease Case-Control Study Group. Antioxidant status and neovascular age-related macular degeneration. Arch Ophthalmol (Chicago) 1993;111:104–109. doi: 10.1001/archopht.1993.01090010108035. [published correction appears in Arch. Ophthalmol. 111, 1228 (1993), Arch. Ophthalmol. 111, 1366 (1993), and Arch. Ophthalmol. 111, 1499 (1993)] [DOI] [PubMed] [Google Scholar]
- 4.Landrum JT, Bone RA. Lutein, zeaxanthin, and the macular pigment. Arch Biochem Biophys. 2001;385:28–40. doi: 10.1006/abbi.2000.2171. [DOI] [PubMed] [Google Scholar]
- 5.Krinsky NI, Landrum JT, Bone RA. Biologic mechanisms of the protective role of lutein and zeaxanthin in the eye. Annu Rev Nutr. 2003;23:171–201. doi: 10.1146/annurev.nutr.23.011702.073307. [DOI] [PubMed] [Google Scholar]
- 6.Krinsky NI, Johnson EJ. Carotenoid actions and their relation to health and disease. Mol Aspects Med. 2005;26:459–516. doi: 10.1016/j.mam.2005.10.001. [DOI] [PubMed] [Google Scholar]
- 7.Congdon N, O’Colmain B, Klaver CC, Klein R, Munoz B, Friedman DS, Kempen J, Taylor HR, Mitchell P. Causes and prevalence of visual impairment among adults in the United States. Arch Ophthalmol (Chicago) 2004;122:477–485. doi: 10.1001/archopht.122.4.477. [DOI] [PubMed] [Google Scholar]
- 8.Friedman DS, O’Colmain BJ, Munoz B, Tomany SC, McCarty C, de Jong PT, Nemesure B, Mitchell P, Kempen J. Prevalence of age-related macular degeneration in the United States. Arch Ophthalmol (Chicago) 2004;122:564–572. doi: 10.1001/archopht.122.4.564. [DOI] [PubMed] [Google Scholar]
- 9.Cho E, Seddon JM, Rosner B, Willett WC, Hankinson SE. Prospective study of intake of fruits, vegetables, vitamins, and carotenoids and risk for age-related maculopathy. Arch Ophthalmol (Chicago) 2004;122:883–892. doi: 10.1001/archopht.122.6.883. [DOI] [PubMed] [Google Scholar]
- 10.Gale CR, Hall NF, Phillips DI, Martyn CN. Lutein and zeaxanthin status and risk of age-related macular degeneration. Invest Ophthalmol Visual Sci. 2003;44:2461–2465. doi: 10.1167/iovs.02-0929. [DOI] [PubMed] [Google Scholar]
- 11.Beatty S, Murray IJ, Henson DB, Carden D, Koh H, Boulton ME. Macular pigment and risk for age-related macular degeneration in subjects from a Northern European population. Invest Ophthalmol Visual Sci. 2001;42:439–446. [PubMed] [Google Scholar]
- 12.Trieschmann M, Beatty S, Nolan JM, Hense HW, Heimes B, Austermann U, Fobker M, Pauleikoff D. Changes in macular pigment optical density and serum concentrations of its constituent carotenoids following supplemental lutein and zeaxanthin: the LUNA study. Exp Eye Res. 2007;84:718–728. doi: 10.1016/j.exer.2006.12.010. [DOI] [PubMed] [Google Scholar]
- 13.Richer S, Stiles W, Statkute L, Pulido J, Frankowski J, Rudy D, Pei K, Tsipursky M, Nyland J. Double-masked placebo-controlled randomized trial of lutein and antioxidant supplementation in the intervention of atrophic age-related macular degeneration: the Veterans LAST study (Lutein Antioxidant Supplementation Trial) Optometry. 2004;75:216–230. doi: 10.1016/s1529-1839(04)70049-4. [DOI] [PubMed] [Google Scholar]
- 14.Richer S, Devenport J, Lang JC. LAST II: differential temporal responses of macular pigment optical density in patients with atrophic age-related macular degeneration to dietary supplementation with xanthophylls. Optometry. 2007;78:213–219. doi: 10.1016/j.optm.2006.10.019. [DOI] [PubMed] [Google Scholar]
- 15.Snodderly DM, Brown PK, Delori FC, Auran JD. The macular pigment. I. Absorbance spectra, localization, and discrimination from other yellow pigments in primate retinas. Invest Ophthalmol Visual Sci. 1984;25:660–673. [PubMed] [Google Scholar]
- 16.Snodderly DM, Auran JD, Delori FC. The macular pigment. II. Spatial distribution in primate retinas. Invest Ophthalmol Visual Sci. 1984;25:674–685. [PubMed] [Google Scholar]
- 17.Bone RA, Landrum JT. Heterochromatic flicker photometry. Arch Biochem Biophys. 2004;430:137–142. doi: 10.1016/j.abb.2004.04.003. [DOI] [PubMed] [Google Scholar]
- 18.Snodderly DM, Mares JA, Wooten BR, Oxton L, Gruber M, Ficek T. Macular pigment measurement by heterochromatic flicker photometry in older subjects: the carotenoids and age-related eye disease study. Invest Ophthalmol Visual Sci. 2004;45:531–538. doi: 10.1167/iovs.03-0762. [DOI] [PubMed] [Google Scholar]
- 19.Elsner AE, Burns SA, Beausencourt E, Weiter JJ. Foveal cone photopigment distribution: small alterations associated with macular pigment distribution. Invest Ophthalmol Visual Sci. 1998;39:2394–2404. [PubMed] [Google Scholar]
- 20.Delori FC. Autofluorescence method to measure macular pigment optical densities: fluorometry and autofluorescence imaging. Arch Biochem Biophys. 2004;430:156–162. doi: 10.1016/j.abb.2004.05.016. [DOI] [PubMed] [Google Scholar]
- 21.Robson AG, Moreland JD, Pauleikoff D, Morrissey T, Holder GE, Fitzke FW, Bird AD, van Kuijk FJGMD. Macular pigment density and distribution: comparison of fundus autofluorescence with minimum motion photometry. Vision Res. 2003;43:1765–1775. doi: 10.1016/s0042-6989(03)00280-3. [DOI] [PubMed] [Google Scholar]
- 22.Trieschmann M, Spittal G, Lommartzsch A, van Kuijk E, Fitzke F, Bird AC, Pauleikoff D. Macular pigment: quantitative analysis on autofluorescence images. Graefe’s Arch Clin Exp Ophthalmol. 2003;241:1006–1012. doi: 10.1007/s00417-003-0796-4. [DOI] [PubMed] [Google Scholar]
- 23.Berendschot TTJM, van Norren D. Macular pigment shows ring-like structures. Invest Ophthalmol Visual Sci. 2006;47:709–714. doi: 10.1167/iovs.05-0663. [DOI] [PubMed] [Google Scholar]
- 24.Ermakov IV, Sharifzadeh M, Ermakova M, Gellermann W. Resonance Raman detection of carotenoid antioxidants in living human tissue. J Biomed Opt. 2005;10:064028. doi: 10.1117/1.2139974. [DOI] [PMC free article] [PubMed] [Google Scholar]
- 25.Gellermann W, Ermakov IV, Ermakova MR, McClane RW, Zhao DY, Bernstein PS. In vivo resonant Raman measurement of macular carotenoid pigments in the young and the aging human retina. J Opt Soc Am A. 2002;19:1172–1186. doi: 10.1364/josaa.19.001172. [DOI] [PubMed] [Google Scholar]
- 26.Ermakov IV, Ermakova MR, Bernstein PS, Gellermann W. Macular pigment Raman detector for clinical applications. J Biomed Opt. 2004;9:139–148. doi: 10.1117/1.1627776. [DOI] [PMC free article] [PubMed] [Google Scholar]
- 27.Gellermann W, Ermakov IV, McClane RW, Bernstein PS. Raman imaging of human macular pigments. Opt Lett. 2002;27:833–835. doi: 10.1364/ol.27.000833. [DOI] [PubMed] [Google Scholar]
- 28.Hammond BR, Wooten BR, Snodderly DM. Individual variations in the spatial profile of human macular pigment. J Opt Soc Am A. 1997;14:1187–1196. doi: 10.1364/josaa.14.001187. [DOI] [PubMed] [Google Scholar]
- 29.Elsner A, Moraes L, Beausencourt E, Remky A, Weiter J, Walker J, Wing G, Burns S, Raskauskas P, Kelley L. Scanning laser reflectometry of retinal and subretinal tissues. Opt Express. 2000;6:243–250. doi: 10.1364/oe.6.000243. [DOI] [PubMed] [Google Scholar]
- 30.Delori FC, Goger DG, Hammond BR, Snodderly DM, Burns S. Macular pigment density measured by autofluorescence spectrometry: comparison with reflectometry and heterochromatic flicker photometry. J Opt Soc Am A. 2001;18:1212–1230. doi: 10.1364/josaa.18.001212. [DOI] [PubMed] [Google Scholar]
- 31.Chang Y, Lee FL, Chen SJ, Chen SF. Optical measurement of human retinal macular pigment and its spatial distribution with age. Med Phys. 2002;29:2621–2628. doi: 10.1118/1.1515761. [DOI] [PubMed] [Google Scholar]
- 32.Delori FC, Goger DG, Keilhauer C, Salvetti P, Staurenghi G. Bimodal spatial distribution of macular pigment: evidence of a gender relationship. J Opt Soc Am A. 2006;23:521–538. doi: 10.1364/josaa.23.000521. [DOI] [PubMed] [Google Scholar]
- 33.Sharifzadeh M, Bernstein PS, Gellermann W. Nonmydriatic fluorescence-based quantitative imaging of human macular pigment distributions. J Opt Soc Am A. 2006;23:2373–2387. doi: 10.1364/josaa.23.002373. [DOI] [PMC free article] [PubMed] [Google Scholar]
- 34.American National Standards Institute. ANSI Z136.1-2000. Laser Institute of America; 2000. American national standard for safe use of lasers. Sec. 8.3. [Google Scholar]
- 35.Delori FC, Webb RH, Sliney DH. Maximum permissible exposures for ocular safety (ANSI 2000), with emphasis on ophthalmic devices. J Opt Soc Am A. 2007;24:1250–1265. doi: 10.1364/josaa.24.001250. [DOI] [PubMed] [Google Scholar]
- 36.The angular field diameter subtended by the excitation spot is 206 mrad, and for the CE parameter in Table 6, ANSI standard one obtains CE = α2/(αmaxαmin)=(206)2/(100 ×1.5)=283. According to paragraph 8.3 of ANSI, since t =0.4 s, one can use an exposure time t=0.07. For the maximum permissible radiant exposure at the cornea, one then obtains CE ×1.8×t0.75×10−3=69.3 mJ/cm2, and for the maximum permissible radiant exposure at the retina 69.3 mJ/cm2×(pupil area/retinal area)=69.3 mJ/cm2×(7/3.5)2=277 mJ/cm2.
- 37.Liew SH, Gilbert CE, Spector TD, Mellerio J, van Kuijk FJ, Beatty S, Fitzke F, Marshall J, Hammond CJ. Central retinal thickness is positively correlated with macular pigment optical density. Exp Eye Res. 2006;82:915–920. doi: 10.1016/j.exer.2005.10.014. [DOI] [PubMed] [Google Scholar]
- 38.Bhosale P, Zhao Da You, Bernstein PS. HPLC measurement of ocular carotenoid levels in human donor eyes in the lutein supplementation era. Invest Ophthalmol Visual Sci. 2007;48:543–549. doi: 10.1167/iovs.06-0558. [DOI] [PubMed] [Google Scholar]
- 39.Savage GL, Johnson CA, Howard DL. A comparison of noninvasive objective and subjective measurements of the optical density of human ocular media. Optom Vision Sci. 2001;78:386–395. doi: 10.1097/00006324-200106000-00010. [DOI] [PubMed] [Google Scholar]
- 40.Zagers NPA, van Norren D. Absorption of the eye lens and macular pigment derived from reflectance of cone photoreceptors. J Opt Soc Am A. 2004;21:2257–2268. doi: 10.1364/josaa.21.002257. [DOI] [PubMed] [Google Scholar]
- 41.van de Kraatz J, van Norren D. Optical density of the aging human ocular media in the visible and the UV. J Opt Soc Am A. 2007;24:1842–1856. doi: 10.1364/josaa.24.001842. [DOI] [PubMed] [Google Scholar]
- 42.Pokorny J, Smith VC, Lutze M. Aging of the human lens. Appl Opt. 1986;26:1437–1440. doi: 10.1364/AO.26.001437. [DOI] [PubMed] [Google Scholar]
- 43.Bernstein PS. personal communication. Moran Eye Center, University of Utah; 65 Medical Drive, Salt Lake City, Utah 84132: 2007. [Google Scholar]


