Abstract
This study examined behavioral strategies for texture discrimination by echolocation in free-flying bats. Big brown bats, Eptesicus fuscus, were trained to discriminate a smooth 16 mm diameter object (S+) from a size-matched textured object (S−), both of which were tethered in random locations in a flight room. The bat’s three-dimensional flight path was reconstructed using stereo images from high-speed video recordings, and the bat’s sonar vocalizations were recorded for each trial and analyzed off-line. A microphone array permitted reconstruction of the sonar beam pattern, allowing us to study the bat’s directional gaze and inspection of the objects. Bats learned the discrimination, but performance varied with S−. In acoustic studies of the objects, the S+ and S− stimuli were ensonified with frequency-modulated sonar pulses. Mean intensity differences between S+ and S− were within 4 dB. Performance data, combined with analyses of echo recordings, suggest that the big brown bat listens to changes in sound spectra from echo to echo to discriminate between objects. Bats adapted their sonar calls as they inspected the stimuli, and their sonar behavior resembled that of animals foraging for insects. Analysis of sonar beam-directing behavior in certain trials clearly showed that the bat sequentially inspected S+ and S−.
Keywords: Texture discrimination, Echolocation, Bat, Adaptive sonar, Frequency-modulated sonar signals
Introduction
Echolocating bats emit high-frequency sounds and listen to the returning echoes to detect, localize and discriminate objects in their environment (Griffin 1958; Busnel and Fish 1980; Nachtigall and Moore 1988; Thomas et al. 2004). To successfully locate and identify insect prey, bats must discriminate echoes returning from insects, twigs, foliage, the ground and other objects. Each object returns an altered version of the original echolocation signal to the bat. Differences in amplitude, arrival time and frequency spectra of the returning echoes provide cues that bats can use to localize, discriminate and identify objects (e.g., von der Emde and Schnitzler 1990; Moss and Schnitzler 1995; von Helversen and von Helversen 2003; Weißenbacher and Wiegrebe 2003; von Helversen 2004; Firzlaff et al. 2007).
Broadband frequency-modulated (FM) sonar calls are well suited to carry echo information about target fine structure (Simmons and Stein 1980). Early studies demonstrated that bats can use echo information to discriminate target shape (Griffin et al. 1965; Bradbury 1970; Simmons and Vernon 1971). To more carefully control the acoustic cues available to bats in target discrimination experiments, psychophysical studies were carried out using physical stimuli (Simmons et al. 1974; Habersetzer and Vogler 1983), as well as phantom target echoes (Schmidt 1988; Mogdans et al. 1993).
Objects with closely spaced reflecting surfaces return echoes that are temporally offset, creating interference patterns with spectral regions of cancelation and reinforcement that are determined by the delay separation between the composite echoes. Using plates with holes drilled to different depths, researchers determined that bats could discriminate differences in hole depth of <1 mm, corresponding to echo delay separations of <60 μs (Simmons et al. 1974; Habersetzer and Vogler 1983). Simmons et al. (1974) argued theoretically that the subject of their study, Eptesicus fuscus, could perceive the echo delay difference between the return from the front and back holes of the plate. However, the spectral and temporal cues used by the bats could not be disentangled in this study. Habersetzer and Vogler (1983) confirmed the basic findings of Simmons et al. (1974) in a different species, Myotis myotis, also requiring bats to discriminate between plates with holes drilled at different depths. They made the surprising discovery that discrimination performance between a positively reinforced (S+) plate at 4 mm and non-reinforced (S−) plate at 3.2 mm differed significantly when presenting two different S− plates (both at 3.2 mm depth), made with different drill bits. One 3.2-mm S− plate was made with a worn drill bit that created 30-μm high ridges at the back of the holes, and the bat’s performance was significantly higher with this S− than with the one made with a drill bit that created smooth drilled holes. These studies demonstrated that FM bats were sensitive to physical offsets of two-echo wavefronts, and the most conservative interpretation of these findings is that the bats use differences in spectral structure to make the discrimination. The results of these studies motivated a series of psychophysical studies that required FM bats to discriminate two-wavefront phantom target echoes, the delay separation of which could be electronically manipulated. Schmidt (1988, 1992) found that Megaderma lyra could discriminate a reference two-wavefront echo with a 7.7-μs temporal offset by comparison of two-wavefront echoes with offsets that differed by as little as 1 μs, but performance deteriorated at some larger delay separations between two-wavefront comparison echoes, e.g., 23.3 μs, which shared spectral similarities to the reference target echo in this study. Schmidt interpreted these findings to indicate that echolocating bats use spectral cues to discriminate the temporal offset of two-wavefront echoes. Mogdans et al. (1993) conducted a similar study with Eptesicus fuscus and also reported that this bat species could discriminate between two-wavefront echo stimuli with different temporal offsets of the component echoes and between one-wavefront and two-wavefront echo stimuli with different internal delays. When the spectral profiles of S+ and S− in Mogdans et al.’s (1993) study were similar, bats showed a drop in discrimination performance, suggesting that spectral cues were used by the bat to discriminate targets with different depth (or internal delay) structure; however, these authors note that their results could also be interpreted to show that the bat relies on a temporal representation of the two-wavefront stimuli to perform the task. Consistent with this notion, Simmons et al. (1990) demonstrated through a series of studies that E. fuscus converts the spectral profile of two-wavefront echoes to the underlying delay (or distance) separation between the first and second wavefronts to perceive the depth structure of phantom targets. The results of these psychophysical experiments demonstrated that FM bats could discriminate the fine structure of target echoes, but they did not explore the adaptive echolocation behaviors that might play an important role in perception by sonar.
Echolocating bats modify the features of their sonar calls in response to the environment in which they operate (Kalko and Schnitzler 1993; Schnitzler et al. 2003), the distance to objects (Griffin 1958; Kick and Simmons 1984; Moss et al. 2006) and the tasks that they perform (Surlykke et al. 2009). Adaptive sonar behavior reveals information a bat seeks in order to perform a particular task and therefore provides a window to the animal’s perception. Adaptive sonar behaviors include adjustments in call duration, peak frequency, bandwidth, interval and intensity (Schnitzler 1968; Siemers and Schnitzler 2000, 2004; Moss et al. 2006; Surlykke and Kalko 2008), as well as the directional aim of the sonar beam (Ghose and Moss 2003, 2006; Surlykke et al. 2009). Here, we report on the adaptive echolocation behavior to support texture discrimination performance in the free-flying big brown bat, E. fuscus.
In the present experiment, free-flying bats were trained to discriminate a smooth object (S+) from textured objects (S−). Bats were able to freely investigate the stimuli by flying around the objects. The bat’s three-dimensional (3-D) flight path was reconstructed using stereo images taken from high-speed video recordings; sonar vocalizations were recorded for each trial and analyzed off-line. A microphone array permitted reconstruction of the sonar beam pattern, allowing us to study the bat’s directional gaze and inspection of objects. Previous studies have shown that bats direct their vocalization beam on objects of interest during a difficult navigation task (Surlykke et al. 2009). In this study, we show that bats use sequential sonar scanning of stimuli to discriminate targets with different textures, controlling the directional aim of the beam axis to inspect closely spaced targets one at a time.
Methods
Subjects
Four wild caught big brown bats (Eptesicus fuscus) were used in these experiments, though only two were successfully trained in this complex behavioral task. Of these two bats, one performed the discrimination task with only a subset of the stimuli, as it fell ill 10 weeks after the experiment was begun. Bats were housed in a climate-controlled room at the University of Maryland, College Park. The room was maintained at a constant temperature (25°C) and humidity (60%), in a reverse 12-h day/night schedule. Bats were maintained on mealworms (Tenebrio molitor) and vitamin water.
Experimental setup
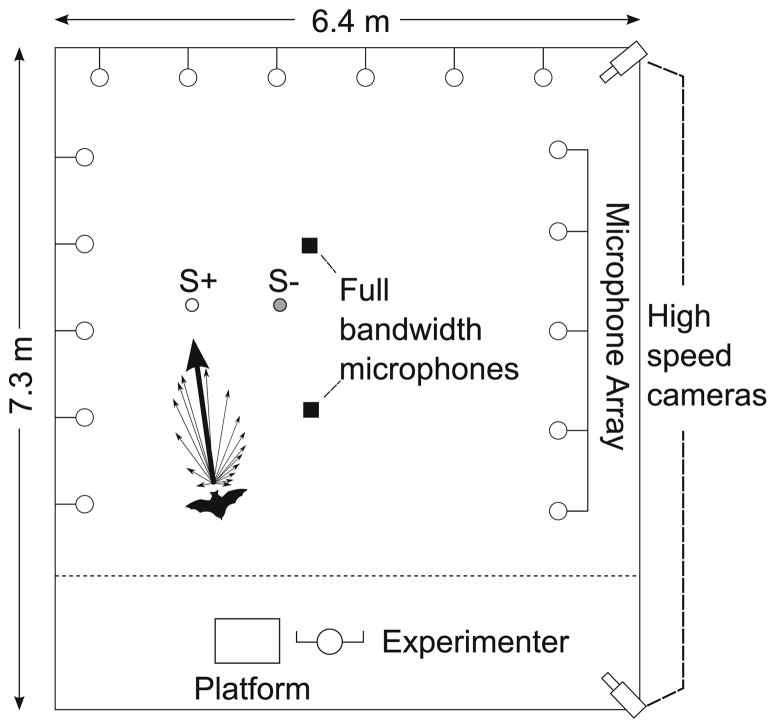
We conducted the experiments in a large carpeted flight room (7.3 m × 6.4 m × 2.5 m) lined with acoustic sound-absorbing foam (Sonex One, Acoustical Solutions, Inc.) in low, long wavelength light (>650 nm, incandescent light through infrared filters, Plexiglas G #2711, Atofina Chemicals). Objects were suspended 80 cm from the ceiling by monofilament fishing line (Berkley Trilene, 0.9 kg test, 0.13 mm diameter). A collapsible platform was positioned in one corner of the flight room for the bat to land on in between trials (Fig. 1).
Fig. 1.
Flight room setup: top down schematic of flight room during recording sessions (not to scale). Sixteen microphones were located on three sides of the room. Two high-speed cameras (240 Hz) were located in the corners of the room and allowed for three-dimensional (3-D) tracking of the bat’s flight path. S+ (white circle) and S− (gray circle) were located in the flight room. Two full bandwidth microphones (black squares) were located on the floor near the objects. The bat’s vocalization has been depicted as arrows representing normalized intensities recorded at each array microphone. The thickest arrow in the schematic represents the calculated beam direction for this example vocalization. The dotted line shows the extent of 3-D reconstruction by the two high-speed cameras
During behavioral sessions, two ultrasonic microphones (UltraSound Advice, SM2 with SP2 amplifiers) positioned on the floor approximately 3 m apart recorded sonar vocalizations. The signals were bandpass filtered from 10 to 100 kHz (Wavetek-Rockland Dual Hi/Lo Filter), recorded at 250 kHz/channel (12 bit, 8.125 s rolling buffer, IoTech 512 Wavebook) and downloaded to a computer.
Stereo video tracking of free-flying bats
Two high-speed (240 frames/s) video cameras (Kodak MotionCorder), located in opposite corners of the room, viewed the same central area of the flight room and allowed the 3-D reconstruction of the flight path of the bat. Video systems recorded a rolling buffer of 8.125 s of the animal’s behavior for each trial.
A calibration frame (Peak Performance Technologies) was placed in the room and filmed by both cameras prior to recording sessions. The video cameras were used to record positions of the two objects (S+ and S−) and the bat’s flight trajectory.
Sonar beam measurements in free-flying bats
Eptesicus fuscus is an oral emitter, and the sonar beam is aligned with the head (Ghose and Moss 2003). A linear microphone array was used to record the bat’s sonar signals at 16 different locations in the flight room, positioned along three walls of the flight room (Fig. 1). For each vocalization detected by the microphone array, the normalized beam intensity at each microphone was computed by correcting for spherical loss and atmospheric attenuation. Vectors between the bat’s position (at vocalization emission time) and each microphone were created. The length of each vector was made proportional to the normalized intensity at the corresponding microphone. The resultant vector sum provides an estimate of the bat’s beam axis, and the angular separation between the beam axis and an object of interest (obstacle or prey) defines the tracking angle (for further details, see Ghose and Moss 2003, 2006).
Behavioral training and data collection
Using operant conditioning, the bats were trained to discriminate between two tethered objects, one designated positive stimulus (S+) and the other negative stimulus (S−). Six different S− objects were used, and each one was paired with a single S+ during the trials. The bats were trained to seek out and touch S+ in free flight while avoiding S−. The bats often attacked the stimuli as if they were prey items. The positions of the objects were changed randomly in the room every trial, and the positions with respect to each other were randomly assigned using a computer-generated trial sequence (S− either on the left, right, front or rear of S+ with respect to the bat’s starting position). The distance between objects was also randomly determined, and the mean distance between objects was 72 cm, the maximum 236 cm and the minimum 15 cm. S+ and S− were present and suspended from the ceiling for the full duration of each trial.
To begin a trial, the bat was released from a holding container on the platform. The bat would fly around the objects until it hit one of them. When the bat correctly hit S+, a high-frequency tone (20 kHz) was manually triggered to signal the bat to return to the platform for its food reward. If the bat incorrectly hit S− before hitting S+, the bat was caught and readied for the next trial without a food reward. A common post-trigger was used to synchronize the acquired video and audio data. An entire trial included the bat’s release from the platform, its flight toward the stimuli and its physical contact with the selected stimulus. The bat was not restricted in its flight path during the trial. The bat often completed the entire trial within the 8-s buffer of our data acquisition system, but in trials in which it did not, we captured only the 8 s prior to the bat hitting S+ or S−.
There were a total of 932 trials with Bat 1 and 630 trials with Bat 2. Each testing session consisted of a series of consecutive trials with a single S−, ranging between 5 and 19 trials, with an average of 11.4 trials/session. There were a total of 74 sessions, 8 of which occurred on the same day as another session. There were no more than two sessions per day. The overall performance with a given S− was calculated as the number of trials in which the bat hit S+ divided by the total number of trials. The total number of trials per bat with a given S− ranged from 56 to 518.
Of a total of 932 trials with Bat 1, video recordings were taken on 618 trials, wideband microphone recordings were taken on 888 trials, and microphone array recordings were taken on 570 trials with Bat 1 (recordings were never performed with Bat 2). Of these recordings, 129 video and wideband microphone trials were processed for video reconstruction and analysis of vocalization timing and structure (through marking start/end time and start/end frequency of the fundamental sweeps of the vocalizations). Of this subset of 129 trials, 76 were processed with the microphone array recordings for beam aim reconstruction. These trials were selected based on video quality and best signal-to-noise ratio in the audio recordings.
Two seemingly identical smooth spherical objects (Darice, 16 mm diameter) were selected as S+. One S+ was chosen at random at the beginning of each session and remained S+ for the entire test session. Control experiments showed that performance did not vary with the particular S+. Ten different objects of different textures and sizes were ensonified to determine their acoustic properties. Of the ten objects, six were chosen for the experimental S−, designated S− 1 through 6 (Table 1).
Table 1.
Pictures of the objects with measured physical characteristics
| Name | Picture | Material | Diameter (mm) | Texture | Shape | Hole diameter (mm) |
|---|---|---|---|---|---|---|
| S+ | 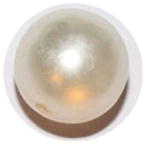 |
Solid plastic | 16 | Smooth | Sphere | 1.5 |
| S− 1 | 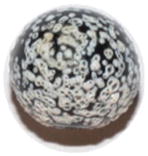 |
Solid plastic | 13.5 | Paint 0.25-mm depth | Oblong sphere14.75-mm width | 1.5 |
| S− 2 | 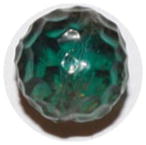 |
Solid plastic | 13 | Molded 0.5-mm depth | Sphere | 1.5 |
| S− 3 | 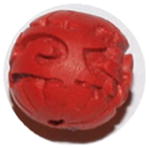 |
Plastic “cinnabar” | 15.25 | Carved 1–2 mm depth | Oblong sphere 16.5 × 15 mm width | 2.25 |
| S− 4 | 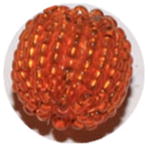 |
Wooden shell | 16.5 | Mini plastic beads around shell 11 per row, 21 rows Small bead size: 2 × 1.5 mm | Sphere | 0 |
| S− 5 | 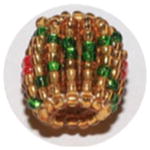 |
Wooden shell | 15.5 | Mini plastic beads around shell 10 per row, 16 rows Small bead size: 2 × 1.5 mm | Cylinder 16-mm width | 5 |
| S− 6 | 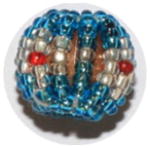 |
Wooden shell | 14 | Mini plastic beads around shell 9 per row, 14 rows Small bead size: 2 × 1.5 mm | Cropped sphere 15.5-mm width | 3 |
Echo recordings
To determine the acoustic characteristics of the echoes reflecting from the objects, ultrasonic recordings were taken. The objects were hung by a fishing line (Berkley Trilene, 0.9-kg test, 0.13-mm diameter) suspended from the ceiling with one fishing line and tethered to the floor with two fishing lines for stability. Computer-generated sounds were broadcast from an ultrasound loudspeaker at each of the objects, and the returning echoes were recorded. The sound generated was a frequency sweep from 100 to 10 kHz with a duration of 1 ms, windowed by a cosine function. Frequency range encompassed the entirety of the fundamental sweep and a large portion of the first harmonic of the vocalizations emitted by E. fuscus (Surlykke and Moss 2000). The signal was created in MATLAB (Math-works), sampled at 1 MHz (National Instruments PCI-6071E), low pass filtered at 200 kHz (Krohn-Hite 3550), amplified and broadcast through a loudspeaker (Ultrasound Advice S56 with amplifier S55). Each object was ensonified from separate angles in five degree increments from −90° to 90° at a distance of 50 cm. The echoes returning from the objects were recorded using an ultrasound-sensitive microphone (Ultrasound Advice UM3) connected to an amplifier (Ultrasound Advice SP3). The signal from the microphone was bandpass filtered from 10 to 99 kHz and amplified by 20 dB (Stanford Research Systems, Inc. SR650). The signals were recorded using the same data acquisition board, sampled at 1 MHz and downloaded to a computer. Each angle’s recording contained 50 echoes, which were later averaged to improve signal-to-noise ratio. During processing of echo recordings, the outgoing signal from the loudspeaker, recorded on the microphone, was carefully removed, leaving only the echo return from the object.
The echo recording setup’s frequency response was characterized by recording echoes from a large, flat surface positioned at the same distance as the objects (50 cm) and taking the magnitude of the Fourier transform of those echoes. Transfer functions for each of the objects at each angle were calculated as a ratio of the magnitude of the Fourier transforms of the echoes divided by the echo recording setup’s frequency response. Values between 20 and 90 kHz were used in later analyses as those frequencies fit within the echo recording setup’s best frequency response. Analyses of the echo recordings and behavioral data were performed off-line using custom software written in MATLAB.
Results
Discrimination performance
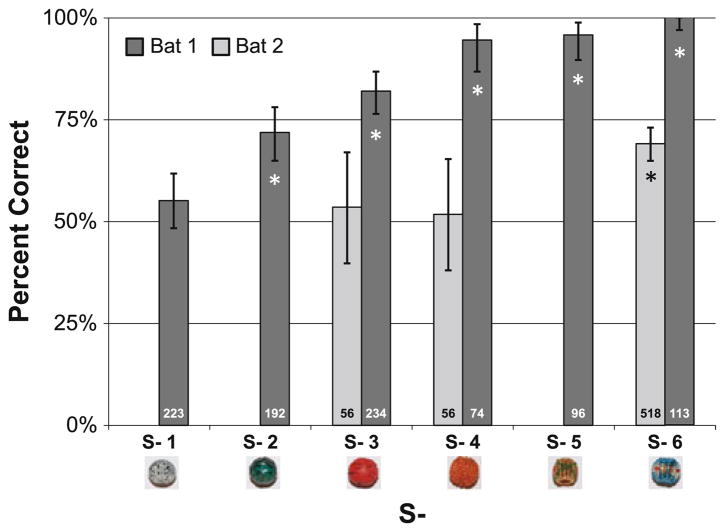
Bat 1 was able to successfully discriminate many of the S− from S+; Bat 2 was able to discriminate S− 6 from S+ (Fig. 2). Binomial confidence intervals were calculated for the number of successes by each bat. Bat 1 successfully discriminated S+ from S− significantly better than the chance with S− 2, 3, 4, 5 and 6 (p < .05). Bat 2 successfully discriminated S+ only when S− was S− 6 (p < .05), and this bat’s overall performance was poorer than Bat 1 across all S−. We speculate that this bat’s poor performance may be attributed in part to the complexity of the behavioral task, which required learning to tap an inedible target in flight and traveling to a landing platform to receive a food reward for correct responses. This bat never achieved better than 70% correct performance for any of the S−, whereas Bat 1 achieved around 100% correct performance for several S−. When bats made errors in this task, they often failed to inspect S+ before tapping S−. Of 15 trials in which the bat hit S− and we were able to determine beam-directing behavior of the objects, Bat 1 did not inspect S+ but instead immediately hit S−. These trials were with S− 1 (7 trials), S− 2 (4 trials) and S− 3 (4 trials). In contrast, of 82 correct trials, Bat 1 often inspected both S+ and S− before hitting S+ (18% of the trials).
Fig. 2.
Bat performance with different S− objects. Confidence intervals calculated using a binomial distribution. The total number of trials for each S− is indicated at the base of each of the bars. Whether the bat’s performance is significantly different from chance for each S− is indicated with an asterisk (p <.05). Bat 1 was tested with all the S−, while Bat 2 was only tested with S− 3, 4 and 6
Echo measurements
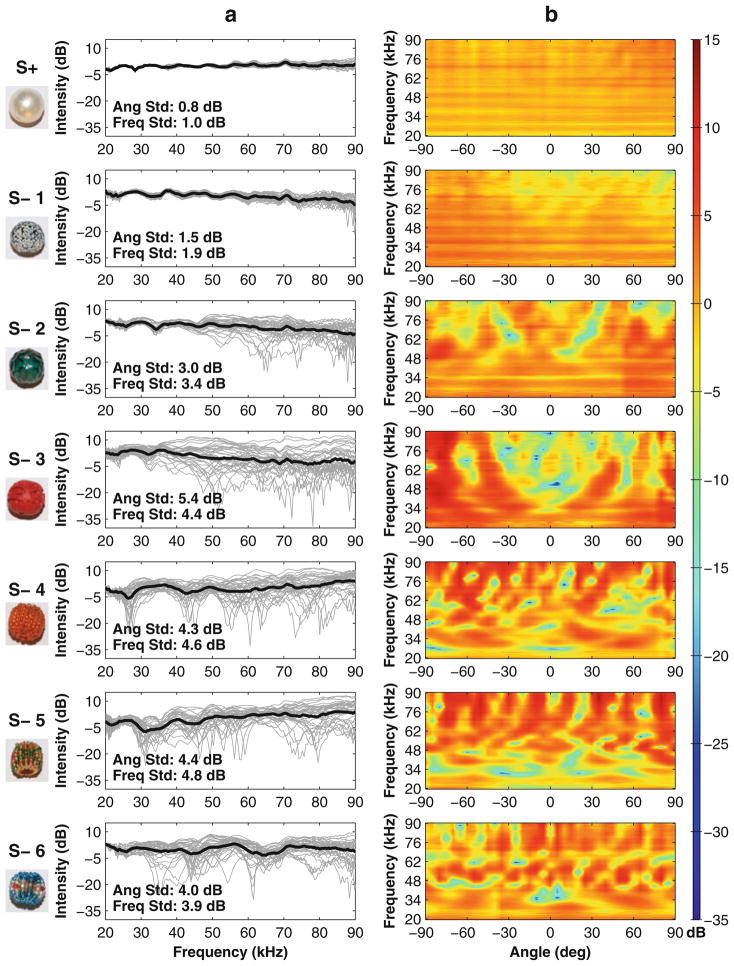
Figure 3a shows transfer functions of the smooth S+ and the textured S−s for all angles sampled (−90° to 90°, 5° increments, gray lines). The mean transfer function across all angles was plotted for each object (black line). S− objects had echo intensity differences within 4-dB RMS of the smooth S+. Mean intensity differences alone did not seem to have a role in the bat’s performance, as S− with large differences in intensity to S+ were not better discriminated than S− with similar intensities to S+ (S− 1 was the only S− that Bat 1 could not discriminate, but it had a large difference in intensity to S+; S− 5 was the closest in intensity to S+, but it was well discriminated from S+ by Bat 1). Angular changes in transfer functions varied from being negligible (S+) to considerably different (S− 3). Changes in intensity across frequency in the transfer functions (peaks and notches) also varied between the objects. S+ had the flattest frequency response (1 dB average standard deviation), and S− 5 had the greatest (4.8 dB average standard deviation). The transfer functions for S− 1 had a flat frequency response and a small variation with angle, similar to S+. S− 2 had greater variability in its transfer functions across angles at higher frequencies (>50 kHz) than at lower frequencies (<50 kHz). S−3 had large changes in intensity of its transfer function with angle, but no consistent notch at any particular frequency across angles. S− 4, 5 and 6 had large angular and frequency variations and contained prominent notches in intensity especially at lower frequencies. While the transfer functions for some objects had notches that remained constant across angles (S− 4 at 27 kHz, S− 5 at 31 kHz), most notches either changed frequency or disappeared with changes in angle.
Fig. 3.
Transfer functions calculated from echo recordings taken from different angles of the different objects used in the study. Objects are presented from top to bottom in the same order that Bat 1 performed, from worst to best (S+ at the very top). a The calculated transfer functions at each angle (gray lines) and the mean transfer function across angles (black line) were plotted across frequency (x-axis) and intensity (y-axis). Echo transfer functions from each bead were normalized so that the mean value is positioned at 0 dB on the y-axis. The average change in intensity between angles is displayed on each panel as “Ang Std” and was quantified as the standard deviation in intensity at each frequency across angles (−90° to 90°, 5° increments) and averaged across frequencies (20–90, 0.5 kHz resolution). The average change in intensity in frequency (the amount of peaks and notches in the transfer functions) is displayed on each panel as “Freq Std” and was quantified as the standard deviation in intensity for each angle’s transfer function across frequency and averaged across angles. b The change in intensity across angles of the transfer functions is shown, with angle on the x-axis, frequency on the y-axis and intensity represented as color. This shows the effect of changing surface structure on each object’s transfer functions
Figure 3b illustrates intensity changes in the transfer functions across frequencies as sampled from different angles. S+ had a nearly uniform intensity across angles and frequencies, while the S− objects showed different amounts of changes in intensity across angles and frequency. While S− 1 had a relatively constant intensity across frequencies and angles, S−2 had notches at around 65 kHz when ensonified from around ±20°. At wider angles, the notches increased in frequency. S− 3’s transfer functions showed a complex series of notches—one notch around 0° and 33 kHz, a second notch again at 0° and around 53 kHz, and additional notches at higher frequencies for ensonification angles out to 40°. An additional notch in transfer functions from S− 3 occurred for ensonification angles of approximately ±60° azimuth at 70 kHz. S− 4, 5 and 6 transfer functions showed complex patterns of changing intensity across frequency that repeat their patterns of notches and peaks with angular changes around the objects. The texture of the objects produced distinct spectral interference patterns across ensonification angle that could provide cues for echo discrimination.
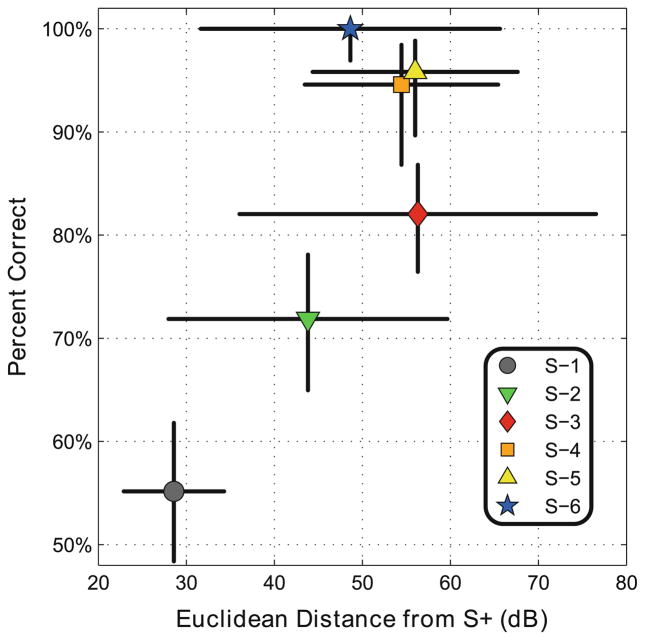
A quantitative analysis of the transfer function differences between S+ and the six different S− objects was performed by calculating the Euclidean distances between their angle-dependent transfer functions and S+’s mean transfer function. We compared this result with Bat 1’s overall discrimination performance with each S− (Fig. 4). We found the magnitude of this measure showed an increase with Bat 1’s percent correct level of performance.
Fig. 4.
Euclidean distance metric between the angular-dependent transfer functions from each S− to S+ plotted against percent correct performance of Bat 1. The mean intensity of each transfer function was removed before computing this metric, as performance data indicated that the bat was not using overall intensity as a cue for discrimination. Error bars indicate the standard deviation for both the Euclidean distance metric and percent correct performance
Adaptive sonar behavior
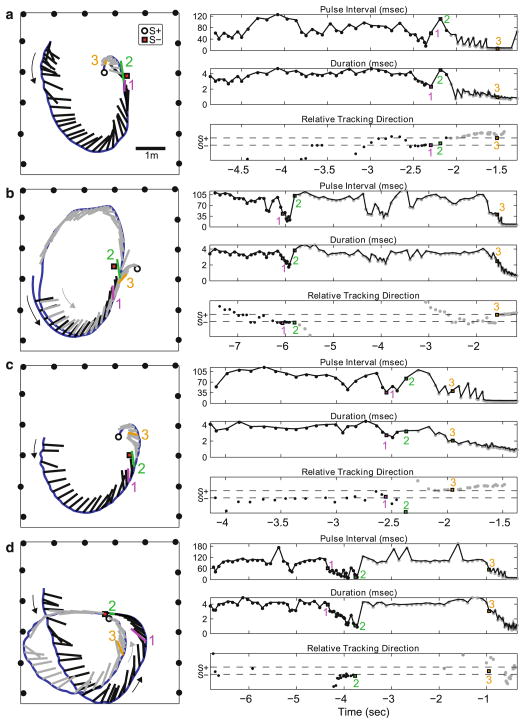
Sonar vocalizations and flight trajectories were analyzed to investigate the bat’s behavioral strategies in performing the discrimination task. The sonar vocalizations’ duration and pulse interval (onset time from pulse to pulse) determines the pulse echo separation, which the bat adapts to parse echoes from different directions and distances. Measures of pulse duration revealed how the big brown bat adjusted its sonar gaze along the range axis to inspect one target at a time (see Surlykke et al. 2009). The 3-D flight path of the bat was reconstructed for trials in which video and microphone array data were collected. Combining the flight path reconstruction with the microphone array data permitted an analysis of the bat’s head aim as it performed the discrimination task in flight. Four example trials from Bat 1 are shown in Fig. 5a–d. The left panels show an overhead view of the bat’s flight path and the beam-directing behavior, while the right panels show details of pulse interval (PI), duration and relative sonar tracking angle to S+ or S− during the trial. Note that the microphone array was set up along three walls and the absence of microphones along one wall produced a small error in the beam aim reconstruction during segments when the bat directed its vocalizations toward that wall (final segment of trials a and c, before the bat hits S+ and early segments of the loops in trials b and c). By combining the bat’s 3-D flight path, vocal behavior and relative tracking angle, the scanning behavior of each object by the bat can be investigated.
Fig. 5.
a–d Example behavior trials. Left panel top down view of flight room showing the bat’s flight trajectory (blue line) with vocalization beam directions (tick marks along flight trajectory, black before first pass, gray after first pass). The beam direction vectors were scaled in length to the inner window (minimum overlap zone, time between outgoing pulse duration and returning echo time). S+ labeled as white circle, S− labeled as red square. Microphones from the microphone array are indicated by black circles present on three sides of the room. Large curved arrows indicate the direction of bat’s flight path. Scale bar represents 1 m. Right top panel pulse interval (PI) of the bat’s vocalizations. Right middle panel duration of the bat’s vocalizations. Right bottom panel relative tracking direction of the bat’s sonar vocalizations. Relative tracking angle was defined as the difference between the measured tracking angle and the mean angle between the bat and the objects, divided by the mean difference angle between the bat and the objects. The resulting calculation returns −1 when the bat’s tracking angle is perfectly aligned with S− and +1 when tracking angle is aligned with S+. The y-axis numbering at −1 and 1 has been replaced with S− and S+. For right panel plots, x-axis time labeled according to each trial’s trigger time. Vocalizations numbered 1–3 were selected to highlight the bat’s beam-directing behavior at particular segments of the trial (see text)
In Fig. 5a, the bat begins its flight path from the upper left quadrant of the plot and loops around toward the objects, first encountering S− and then S+. Note that as the bat flies toward the objects, it directs its sonar beam at S− (vocalization 1, relative tracking direction toward S−), decreases pulse interval time and progressively shortens duration. Between −4.5 and −2.7 s before trial end time (trigger time 0), the interval between successive sounds fluctuates between 50 and 120 ms, but as the bat approaches each of the objects, the interval shortens considerably (as low as 15.5 ms) and the duration also decreases (to nearly 2 ms). Before the bat passes S−, it increases its call duration and pulse interval, “looking” beyond S−, before flying toward S+ (right panel, vocalization 2). As it approaches S+, the calls progressively shorten until the bat makes contact with S+. Vocalization 3, from the terminal buzz phase of the sonar call sequence produced by the bat (Griffin 1958; Surlykke and Moss 2000), shows the bat’s beam direction locked onto S+ (left panel, sticks pointing at S+; right panel, vocalizations line up with S+ horizontal axis). Pulse intervals during this phase occur at about 6–7 ms, and pulse duration is at around 1 ms, resembling call parameters produced by a bat intercepting insect prey. The shifts in beam-directing behavior from one target to the other, coupled with adjustments in call duration and interval, were observed (Fig. 5b, c). In Fig. 5b and d, the bat makes two passes at the objects. In b, the bat first directs its beam axis at S− (vocalizations labeled 1 and 2), but the bat does not directly shift its gaze and approach S+; instead, the bat loops around the flight room and returns to tap S+ (after vocalization 3). Vocalization 1 marks the beginning of a decrease in PI and duration as the bat approaches and inspects S−, and the beam-tracking direction remains fixed on S−. Vocalization 2 occurs before the bat has passed S−, but the pulse interval and pulse duration have already increased, indicating that the bat may have shifted its sonar gaze beyond S−. Vocalization 3 shows the bat’s beam axis directed toward S+ and the decrease in pulse interval and duration that ends with the bat tapping S+, with relative tracking direction on S+. In c, the bat makes a single pass as in a. In this trial, the bat approaches S− first and directs its beam toward S−(vocalization 1), decreasing pulse interval and duration. At vocalization 2, the bat increases PI and duration, even as the beam axis still falls closer to S− than S+, indicating that the bat may be shifting its attention beyond S−. The bat continues toward S+ with vocalization 3 occurring during the terminal buzz sequence, at a low PI and duration and a tracking direction locked to S+. In d, S+ and S− are located very close together. In this trial, as the bat first approaches S−, it directs its sonar beam at S−, as indicated by the small tracking angle relative to S− (vocalizations 1 and 2). However, after the bat loops around and it makes its final approach to the closely spaced targets, the tracking angle does not show a locking beam direction to either object (vocalization 3). In this case, we do not see evidence for sequential inspection of the two targets.
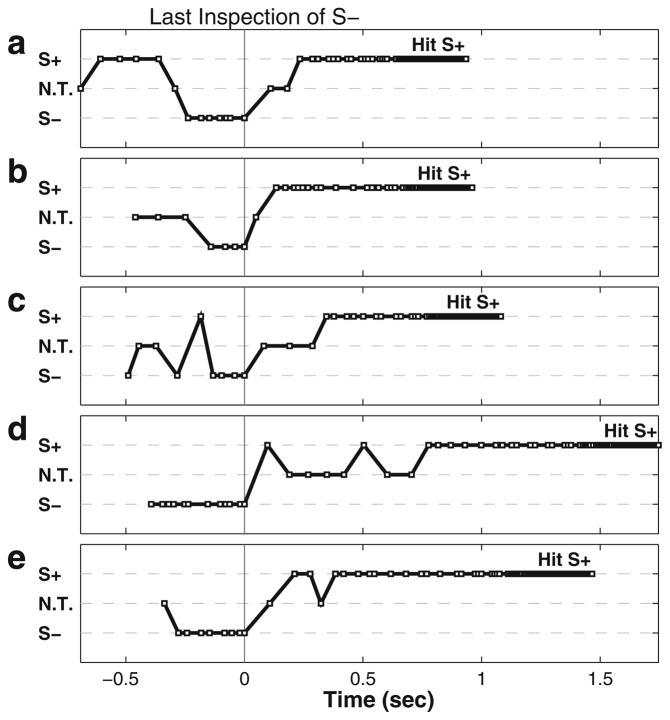
Figure 6 shows the beam-directing behavior in five trials in which the bat first approached S−, correctly discriminated S− and then, without making a second pass around the room, hit S+ (as in example trials shown in Fig 5a, c). The relative beam direction, duration, and PI were used to manually assign each vocalization to either being directed at S+, S− or at neither one (no target, NT, either between targets or directed well away from either target). In each trial, the bat directed its beam toward S− during inspection for at least 100 ms, then shifted its beam direction toward S+, and finally hit S+.
Fig. 6.
a–e Sequential scanning (using the sonar beam axis) of S− and S+ in five trials in which the bat first inspects S− and then subsequently hits S+ with vocalizations indicated by squares. The beam axis was manually assigned to either S+ or S− or no target (NT) for each vocalization by examining the relative tracking direction, duration and pulse interval. Time zero corresponds to the last vocalization directed at S− before the bat shifted its beam axis away from or beyond S−
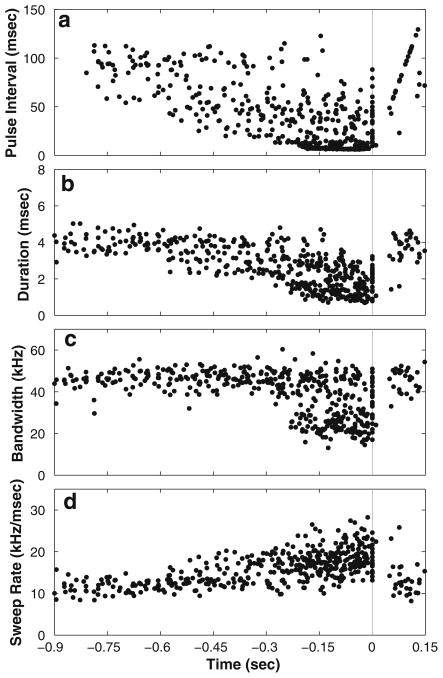
Figure 7 shows the vocal behavior of the bat leading up to inspection and successful discrimination of S− over 23 trials and 452 vocalizations. All S− are included except S− 1, which the bat rarely inspected without hitting. As the bat inspected S−s, PI, duration and bandwidth of the fundamental of the bat’s sonar vocalization decreased, while sweep rate (bandwidth divided by duration) increased. Bandwidth of the fundamental decreased as the bat entered the terminal buzz, but because of the larger decrease in call duration, the sweep rate increased. The harmonic structure of the bat’s vocalizations was not measured due to limitations in equipment. A drop in bandwidth of the fundamental need not necessarily produce an overall loss in signal bandwidth, as harmonics can extend well above 100 kHz. The decrease in bandwidth of the fundamental corresponds to the bat’s entrance into buzz 1 sequence (Surlykke and Moss 2000).
Fig. 7.
Changing vocalization behaviors during approach toward S− during inspection and correct rejection of S− prior to eventual tapping of S+ in 23 trials (452 total vocalizations). a Pulse interval (onset to onset) between each vocalization and its preceding vocalization. b Duration measured as the difference between the beginning and end of the fundamental sweep. c Bandwidth measured as the difference between the start and end frequency of the fundamental sweep. d Sweep rate measured as the ratio of bandwidth to duration. The last inspection of S− before the bat passed S− or directed its beam axis elsewhere has been aligned to time 0 and is indicated by a vertical gray line
Discussion
Our study of texture discrimination in free-flying big brown bats measured performance using objects with different acoustic profiles. We also observed the bat’s adaptive behavior that accompanied successful sonar discriminations. Two bats showed the highest discrimination performance for S− 6 over other stimuli, but absolute performance was greater in one bat than the other (Fig. 2). Below, we discuss the acoustic cues that may have been used by the bats to perform the texture discrimination and behavioral echolocation strategies they employed in this task.
Bat 1’s discrimination performance increased from S− 1 to S− 6, and while Bat 2’s performance was lower, it was above chance with S− 6 as well. Bat 1’s high discrimination performance for S− 4, 5 and 6 could have been based on the strong presence of notches in the transfer functions at lower frequencies (Fig. 3). Note in Fig. 3 that the standard deviations of the transfer functions across angles and across frequencies for these objects were higher than those for S+ and S− 1. These data suggest that echo-to-echo spectral variation was an important cue for the bats performing this discrimination task, a result consistent with an earlier study of target roughness discrimination by Eptesicus fuscus (Zagaeski and Moss 1994).
We computed the Euclidean distance between S+ and each S− to quantify the angle-dependent differences in transfer functions between S+ and each S− object. The Euclidean distance metric tended to increase with the bat’s percent correct performance (Fig. 4); however, this single metric cannot represent all possible cues available to the bat. It is also possible that the bat used different cues for discrimination depending on the S− object presented. This metric does demonstrate the availability of angular-dependent differences in transfer functions of each S− to S+ and could be one way for the bat to discriminate the S− objects from S+.
During discrimination trials, S+ and S− were randomly positioned throughout the room, and in most trials, the two objects were placed less than a meter apart. When the bat approached closely spaced stimuli, the sonar beam was broad enough to ensonify S+ and S− simultaneously. In some trials, data showed that the bat precisely controlled its sonar beam-directing behavior, along with range-dependent call duration, to suggest that it inspected the two objects sequentially (Figs. 5a–c, 6). In these examples, the bat directed the beam axis toward one object at a time, rather than positioning the axis at a location between the two objects for a long duration of time. It was not possible, however, in every trial, to differentiate between sequential and simultaneous inspection of the stimuli, and in some trials, where the objects were placed extremely close together, the bat may have used a different inspection strategy (Fig. 5d).
Some trials revealed abrupt changes in call duration as the bat approached the two objects, suggesting that it shifted its sonar gaze from the closer S− to beyond S−, leading to an eventual tap of S+ (Fig. 5a–c, vocalizations marked “2”). Animations of the trials presented in Fig. 5 are available as supplementary videos (SM 1–4) and through the following link http://www.bsos.umd.edu/psyc/batlab/bead-discrim. This adaptive sonar behavior is consistent with recent reports of sequential scanning behavior in bats that performed a prey capture task in the presence of obstacles (Surlykke et al. 2009).
An analysis of the bat’s scanning behavior during discrimination revealed that the bat often inspected the objects sequentially before making its decision (Fig. 6). Locking the sonar beam onto one object at a time may aid the bat in making its discrimination, as successive echoes from a textured object that change over time and space could reveal information about the changing surface structure of the object.
The adaptive vocal behaviors presented in Fig. 7 show changes in call interval (a), duration (b), bandwidth (c) and sweep rate (d) as the bat inspected and successfully discriminated S− from S+. These changes in vocalization parameters produced by the bat as it approached S− resemble adaptive vocal behavior exhibited by Eptesicus as it approaches its prey (Surlykke and Moss 2000; Ghose et al. 2006, 2009). We attempted to determine if this bat showed object (S−)-specific call adjustments in this task by including only data from trials when the bat clearly inspected S− just before tapping S+. There was a trend for the bat to produce longer buzz-like sequences when it inspected a stimulus that yielded comparatively poor discrimination performance, but the low number of trials meeting criterion for inclusion in this analysis prevented us from making quantitative statements or performing statistical tests on these data.
Overall, the results of this study show that the big brown bat, Eptesicus fuscus, is capable of discriminating small objects that differ primarily in texture. It is possible that the bats in this study developed a representation of S+, the object it encountered on every trial, and used this representation to perform the discrimination task. A somewhat more conservative interpretation of the data, which draws from echo recordings from the stimuli, is that the bat listened for spectral variations in echoes from S− to perform the task. S− stimuli that returned echoes with less spectral variation were the targets that yielded the poorest discrimination performance, even when small target intensity cues were likely available.
The sonar beam-directing behavior of the bat performing this task, measured with microphone array recordings, combined with adjustments in temporal call parameters, were used to infer target inspections by the bat. These data clearly demonstrate that the bat sequentially inspected closely spaced stimuli in certain trials. In some trials, it was not possible to differentiate between simultaneous and sequential inspections. Taken together, the findings of this study suggest that the big brown bat can use its biological sonar to actively probe and perceive fine details about inedible objects in its environment.
Target discrimination and adaptive sonar behaviors were the subjects of many studies conducted by Professor Gerhard Neuweiler’s research group over the years. He expressed particular interest in the sonar beam-directing behavior of the free-flying bat, and for this reason, we chose to include the results of the present study in this special issue to honor his tremendous contributions to the field of animal sonar and his commitment to science education.
Supplementary Material
Acknowledgments
This research was supported by the NSF grant, “Active Sensing for Three-Dimensional Auditory Localization” to CFM, an NSF-REU award to BF and an HHMI Undergraduate Research Fellowship and Senior Summer Scholars awards to TW. Data were collected under a research protocol approved by the University of Maryland Institutional Animal Care and Use Committee. We would also like to thank Ray Gracon, Amaya Perez, Wei Xian and Kaushik Ghose for their assistance.
Footnotes
Electronic supplementary material The online version of this article (doi:10.1007/s00359-010-0621-6) contains supplementary material, which is available to authorized users.
Contributor Information
Ben Falk, Department of Psychology, University of Maryland, College Park, MD 20742, USA. Neuroscience and Cognitive Science Program, University of Maryland, College Park, USA.
Tameeka Williams, Department of Psychology, University of Maryland, College Park, MD 20742, USA.
Murat Aytekin, Department of Psychology, University of Maryland, College Park, MD 20742, USA. Neuroscience and Cognitive Science Program, University of Maryland, College Park, USA. Institute for Systems Research, University of Maryland, College Park, MD 20742, USA.
Cynthia F. Moss, Department of Psychology, University of Maryland, College Park, MD 20742, USA. Neuroscience and Cognitive Science Program, University of Maryland, College Park, USA. Institute for Systems Research, University of Maryland, College Park, MD 20742, USA cmoss@psyc.umd.edu
References
- Bradbury JW. Target discrimination by the echolocating bat Vampyrum spectrum. J Exp Zool. 1970;173:23–46. doi: 10.1002/jez.1401730103. [DOI] [PubMed] [Google Scholar]
- Busnel RG, Fish JF, editors. Animal sonar systems. Plenum Publishing Corporation; New York: 1980. [Google Scholar]
- Firzlaff U, Schuchmann M, Grunwald JE, Schuller G, Wiegrebe L. Object-oriented echo perception and cortical representation in echolocating bats. PLoS Biol. 2007;5:e100. doi: 10.1371/journal.pbio.0050100. [DOI] [PMC free article] [PubMed] [Google Scholar]
- Ghose K, Moss CF. The sonar beam pattern of a flying bat as it tracks tethered insects. J Acoust Soc Am. 2003;114:1120–1131. doi: 10.1121/1.1589754. [DOI] [PMC free article] [PubMed] [Google Scholar]
- Ghose K, Moss CF. Steering by hearing: a bat’s acoustic gaze is linked to its flight motor output by a delayed, adaptive linear law. J Neurosci. 2006;26:1704–1710. doi: 10.1523/JNEUROSCI. 4315-05.2006. [DOI] [PMC free article] [PubMed] [Google Scholar]
- Ghose K, Horiuchi TK, Krishnaprasad PS, Moss CF. Echo-locating bats use a nearly time-optimal strategy to intercept prey. PLoS Biol. 2006;4:e108. doi: 10.1371/journal.pbio.0040108. [DOI] [PMC free article] [PubMed] [Google Scholar]
- Ghose K, Triblehorn JD, Bohn K, Yager DD, Moss CF. Behavioral responses of big brown bats to dives by praying mantises. J Exp Biol. 2009;212:693–703. doi: 10.1242/jeb.019380. [DOI] [PMC free article] [PubMed] [Google Scholar]
- Griffin DR. Listening in the dark. Yale University Press; New Haven: 1958. [Google Scholar]
- Griffin DR, Friend JH, Webster FA. Target discrimination by the echolocation of bats. J Exp Zool. 1965;158:155–168. doi: 10.1002/jez.1401580204. [DOI] [PubMed] [Google Scholar]
- Habersetzer J, Vogler B. Discrimination of surface-structured targets by the echolocating bat Myotis myotis during flight. J Comp Physiol A Neuroethol Sens Neural Behav Physiol. 1983;152:275–282. doi: 10.1007/BF00611192. [DOI] [Google Scholar]
- Kalko EKV, Schnitzler H-U. Plasticity in echolocation signals of European pipistrelle bats in search flight: implications for habitat use and prey detection. Behav Ecol Sociobiol. 1993;33:415–428. [Google Scholar]
- Kick SA, Simmons JA. Automatic gain control in the bat’s sonar receiver and the neuroethology of echolocation. J Neurosci. 1984;4:2725–2737. doi: 10.1523/JNEUROSCI.04-11-02725.1984. [DOI] [PMC free article] [PubMed] [Google Scholar]
- Mogdans J, Schnitzler HU, Ostwald J. Discrimination of two-wavefront echoes by the big brown bat, Eptesicus fuscus: behavioral experiments and receiver simulations. J Comp Physiol A Neuroethol Sens Neural Behav Physiol. 1993;172:309–323. doi: 10.1007/BF00216613. [DOI] [PubMed] [Google Scholar]
- Moss CF, Schnitzler HU. Hearing by bats. Springer handbook of auditory research. Springer; Berlin: 1995. Behavioral studies of auditory information processing; pp. 87–145. [Google Scholar]
- Moss CF, Bohn K, Gilkenson H, Surlykke A. Active listening for spatial orientation in a complex auditory scene. PLoS Biol. 2006;4 doi: 10.1371/journal.pbio.0040079. [DOI] [PMC free article] [PubMed] [Google Scholar]
- Nachtigall PE, Moore PWB, editors. Animal sonar: processes and performance. Plenum Publishing Corporation; New York: 1988. [Google Scholar]
- Schmidt S. Evidence for a spectral basis of texture perception in bat sonar. Nature. 1988;331:617–619. doi: 10.1038/331617a0. [DOI] [PubMed] [Google Scholar]
- Schmidt S. Perception of structured phantom targets in the echolocating bat, Megaderma lyra. J Acoust Soc Am. 1992;91:2203–2223. doi: 10.1121/1.403654. [DOI] [PubMed] [Google Scholar]
- Schnitzler H-U. Die Ultraschall-Ortungslaute der Hufeisen-Fledermäuse (Chiroptera-Rhinolophidae) in verschiedenen Orientierungssituationen. J Comp Physiol A Neuroethol Sens Neural Behav Physiol. 1968;57:376–408. doi: 10.1007/BF00303062. [DOI] [Google Scholar]
- Schnitzler H-U, Moss CF, Denzinger A. From spatial orientation to food acquisition in echolocating bats. Trends Ecol Evol. 2003;18:386–394. doi: 10.1016/S0169-5347(03)00185-X. [DOI] [Google Scholar]
- Siemers BM, Schnitzler H-U. Natterer’s bat (Myotis nattereri Kuhl, 1818) hawks for prey close to vegetation using echolocation signals of very broad bandwidth. Behav Ecol Sociobiol. 2000;47:400–412. doi: 10.1007/s002650050683. [DOI] [Google Scholar]
- Siemers BM, Schnitzler H-U. Echolocation signals reflect niche differentiation in five sympatric congeneric bat species. Nature. 2004;429:657–661. doi: 10.1038/nature02547. [DOI] [PubMed] [Google Scholar]
- Simmons JA, Stein RA. Acoustic imaging in bat sonar: echolocation signals and the evolution of echolocation. J Comp Physiol A Neuroethol Sens Neural Behav Physiol. 1980;135:61–84. doi: 10.1007/BF00660182. [DOI] [Google Scholar]
- Simmons JA, Vernon JA. Echolocation: discrimination of targets by the bat, Eptesicus fuscus. J Exp Zool. 1971;176:315–328. doi: 10.1002/jez.1401760307. [DOI] [PubMed] [Google Scholar]
- Simmons JA, Lavender WA, Lavender BA, Doroshow CA, Kiefer SW, Livingston R, Scallet AC, Crowley DE. Target structure and echo spectral discrimination by echolocating bats. Science. 1974;186:1130–1132. doi: 10.1126/science.186.4169.1130. [DOI] [PubMed] [Google Scholar]
- Simmons JA, Moss CF, Ferragamo M. Convergence of temporal and spectral information into acoustic images of complex sonar targets perceived by the echolocating bat, Eptesicus fuscus. J Comp Physiol A Neuroethol Sens Neural Behav Physiol. 1990;166:449–470. doi: 10.1007/BF00192016. [DOI] [PubMed] [Google Scholar]
- Surlykke A, Kalko EKV. Echolocating bats cry out loud to detect their prey. PLoS One. 2008;3:e2036. doi: 10.1371/journal.pone. 0002036. [DOI] [PMC free article] [PubMed] [Google Scholar]
- Surlykke A, Moss CF. Echolocation behavior of big brown bats, Eptesicus fuscus, in the field and the laboratory. J Acoust Soc Am. 2000;108:2419–2429. doi: 10.1121/1.1315295. [DOI] [PubMed] [Google Scholar]
- Surlykke A, Ghose K, Moss CF. Acoustic scanning of natural scenes by echolocation in the big brown bat, Eptesicus fuscus. J Exp Biol. 2009;212:1011–1020. doi: 10.1242/jeb.024620. [DOI] [PMC free article] [PubMed] [Google Scholar]
- Thomas JA, Moss CF, Vater M, editors. Echolocation in bats and dolphins. 1. University of Chicago Press; Chicago: 2004. [Google Scholar]
- von der Emde G, Schnitzler H-U. Classification of insects by echolocating greater horseshoe bats. J Comp Physiol A Neuroethol Sens Neural Behav Physiol. 1990;167:423–430. doi: 10.1007/BF00192577. [DOI] [Google Scholar]
- von Helversen D. Object classification by echolocation in nectar feeding bats: size-independent generalization of shape. J Comp Physiol A Neuroethol Sens Neural Behav Physiol. 2004;190:515–521. doi: 10.1007/s00359-004-0492-9. [DOI] [PubMed] [Google Scholar]
- von Helversen D, von Helversen O. Object recognition by echolocation: a nectar-feeding bat exploiting the flowers of a rain forest vine. J Comp Physiol A Neuroethol Sens Neural Behav Physiol. 2003;189:327–336. doi: 10.1007/s00359-003-0405-3. [DOI] [PubMed] [Google Scholar]
- Weißenbacher P, Wiegrebe L. Classification of virtual objects in the echolocating bat, Megaderma lyra. Behav Neurosci. 2003;117:833–839. doi: 10.1037/0735-7044.117.4.833. [DOI] [PubMed] [Google Scholar]
- Zagaeski M, Moss CF. Target surface texture discrimination by the echolocating bat, Eptesicus fuscus. J Acoust Soc Am. 1994;95:2881–2882. doi: 10.1121/1.409387. [DOI] [Google Scholar]
Associated Data
This section collects any data citations, data availability statements, or supplementary materials included in this article.


