

Abstract
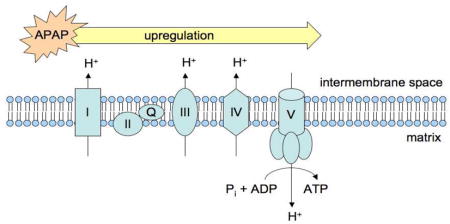
Comparative proteomic analysis following treatment with acetaminophen (APAP) was performed on two different models of APAP-mediated hepatocellular injury in order to both identify common targets for adduct formation and track drug-induced changes in protein expression. Male C57BL/6 mice were used as a model for APAP-mediated liver injury in vivo and TAMH cells were used as a model for APAP-mediated cytotoxicity in vitro. SEQUEST was unable to identify the precise location of sites of adduction following treatment with APAP in either system. However, semiquantitative analysis of the proteomic datasets using spectral counting revealed a downregulation of P450 isoforms associated with APAP bioactivation, and an upregulation of proteins related to the electron transport chain by APAP compared to control. Both mechanisms are likely compensatory in nature as decreased P450 expression is likely to attenuate toxicity associated with N-acetyl-p-quinoneimine (NAPQI) formation, whereas APAP-induced electron transport chain component upregulation may be an attempt to promote cellular bioenergetics.
Keywords: Acetaminophen, electron transport chain, spectral counting, mitochondria. TAMH
Introduction
APAP is considered to be relatively safe at recommended doses and is a commonly used analgesic and antipyretic throughout the world today.1 However, overdose cases are fairly common due to its widespread availability,2 and over 50,000 emergency room visits resulting in over 25,000 hospitalizations occur annually in the United States due to APAP-associated overdoses.3 The majority of an APAP dose is metabolized to relatively nontoxic products via sulfation and glucuronidation reactions,4 whereas only a small percentage of the dose is metabolized to a reactive intermediate, N-acetyl-p-quinoneimine (NAPQI).5 Although, low levels of NAPQI are efficiently cleared by glutathione, at higher doses increased concentrations of NAPQI lead to enhanced glutathione depletion, protein adduct formation and oxidation, and oxidative/nitrosative electrophilic stress resulting in hepatocellular injury.5–9
Initial studies relating APAP metabolism to hepatocellular injury through glutathione depletion and the covalent modification of proteins can be found in a classic series of papers from the Laboratory of Chemical Pharmacology at the NIH.10–13 In the past forty years since these papers were published, the correlation between APAP-induced liver injury and hepatic protein adduct formation has been the subject of many investigations. It was initially proposed that a reactive metabolite of APAP formed covalent adducts to hepatic proteins, thus decreasing their functionality, and that theses changes in protein activity play a key role in APAP-induced liver injury.13 However, studies of hepatic protein adduction caused by 3-hydroxyacetanilide (AMAP), a non-toxic regioisomer of APAP, led researchers to revise this hypothesis, since the reactive metabolites of AMAP form more covalent protein adducts compared to those formed during APAP metabolism, yet AMAP is less hepatotoxic.14–16
Due to the fact that total covalent adduct formation did not provide a definitive explanation for the differences in APAP and AMAP toxicity, it was proposed that the localization and stability of these adducts were more critical factors. In fact, it has been shown that AMAP adducts predominantly reside in the cytosol and endoplasmic reticulum while APAP adducts are more prevalent in the mitochondria.7,16–19 From this, it was hypothesized that “lethal” mitochondrial APAP-protein adducts perturb mitochondrial homeostasis. In contrast, AMAP-adducts in the cytosol and endoplasmic reticulum are “non-lethal”, and this difference might be a major factor in differentiating toxicological outcomes of the regioisomers.17,18,20 This is supported by the finding that progression of initiated protein damage proceeds through pathways involved in cell death for APAP, whereas it proceeds through pathways involved in cell survival for AMAP.21
The use of mass spectrometry as a tool in the field of proteomics has been applied to a wide array of research strategies relating to protein science.22 Previous groups have used either densitometric 2-D gel electrophoresis18,20,23 or ICAT tagging24 coupled with mass spectrometry to measure protein expression by APAP. However, no group has performed these comparisons using label-free quantitative proteomics by counting spectra (Scheme 1). By utilizing shotgun proteomic techniques coupled with tandem mass spectral database searching, peptide fragments can be matched to predicted tandem mass spectra using SEQUEST to both identify the precise location of adducts using post-translational modification qualifiers and generate semiquantitiatve protein expression data with spectral counting.25,26 Using male C57BL/6 mice as a model for APAP-mediated liver injury in vivo27 and TAMH cells as a model for APAP-mediated cytotoxicity in vitro,21 we hypothesized that proteomic analysis of enriched peptide mixtures containing mitochondrial proteins isolated from cells treated with APAP would lead to the identification of critical mitochondrial targets associated with APAP-induced hepatocellular injury.
Scheme 1.
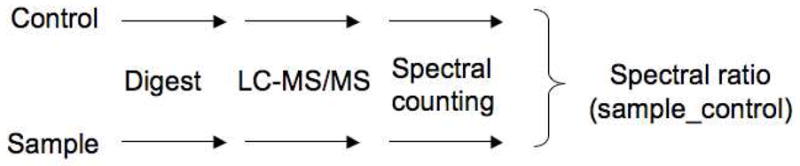
Spectral counting schematic. Spectral counting is a label-free quantitative proteomic method in which each sample is subjected to individual LC-MS/MS analysis. The number of identified tandem mass spectra from peptides within the same protein are then compared across treatment groups and the relative quantification of that protein is assessed based on the number of spectra.
Experimental Procedures
Materials
Acetaminophen, dexamethasone, nicotinamide, soybean trypsin inhibitor and mitochondrial isolation kits, ammonium bicarbonate, urea, Tris base, dithiothreitol (DTT), tris(2-carboxyethyl)phosphine (TCEP), iodoacetamide, and trifluoroacetic acid (TFA) were obtained from Sigma-Aldrich (St. Louis, MO). Gentamicin, trypsin, Dulbecco’s modified Eagle’s medium/Ham’s F12 (1:1), Dulbecco’s phosphate buffered solution (DPBS), 4-(2-hydroxyethyl)-1-piperazineethanesulfonic acid (HEPES) solution and Hank’s balanced salt solution were purchased from Invitrogen (Carlsband, CA). ITS premix was obtained from BD Bioscience (Bedford, MA). The protease cocktail inhibitor tablet was purchased from Roche (Palo Alto, CA). Rodent chow (LabDiet® 5053 PicoLab® Rodent Diet 20) was purchased from Animal Specialities (Woodburn, OR). Methanol, potassium chloride, mannitol, sucrose, ethylenediaminetetraacetic acid (EDTA), formic acid, HPLC-grade water, acetonitrile, tissue culture plates, dishes, and tubes were purchased from Fisher (Pittsburg, PA). Sequencing grade trypsin was obtained from Promega (Madison, WI). Vydac Silica C-18 MicroSpin columns were purchased from the Nest Group, Inc. (Southborough, MA). Two hundred Å and one hundred Å Magic C-18 particles were purchased from Microm Bioresources (Auburn, CA). All reagents used in the determination of protein content were supplied in a bicinchoninic acid (BCA) assay kit (Pierce, Rockford, IL). Sterile saline solution was purchased from Baxter International, Inc. (Deerfield, IL).
Mitochondrial isolation from in vivo samples
All procedures for animal use were in accordance with the National Institutes of Health Guide for the Use and Care of Laboratory Animals and were approved by the University of Washington Institutional Animal Care and Use Committee. Male C57BL/6 mice were allowed unlimited access to food and acidified sterile water (pH = 2.77) until 12 hours prior to experimentation, at which point food was withdrawn. After 12 hours, mice were dosed by intraperitoneal injection with either sterile saline solution (10 uL/g body weight) (n = 3 for each timepoint) or 300 mg/kg APAP dissolved in sterile saline (n = 3 for each timepoint). After 2 and 6 hours, mice were euthanized with CO2 narcosis and cervical dislocation. Mitochondria were isolated from the right anterior liver lobe by differential centrifugation as previously described.28 Briefly, the right anterior lobe was homogenized on ice in 1.0 mL of a buffer containing 200 mM mannitol, 50 mM sucrose, 10 mM KCl, 1 mM EDTA, 10 mM HEPES, pH 7.4 and 1X Roche Complete protease inhibitor cocktail. Following twenty passes with a Dounce homogenizer with a Teflon-coated pestle, samples underwent centrifugation (1000 × g) at 4°C for 5 minutes. The supernatant was then collected and underwent a second centrifugation step (10000 × g) at 4°C for 10 minutes. The supernatant was removed and pellets (mitochondria) were washed once then resuspended in 300 uL of the mannitol-sucrose buffer and subsequently stored at −80°C.
Cell culture
TAMH cells were grown in serum-free Dulbecco’s modified Eagle’s medium/Ham’s F12 (1:1) medium supplemented with 100 nM dexamethasone, 10 nM nicotinamide, 0.1% (v/v) gentamicin, and 0.1% (v/v) of an ITS premix containing insulin (5 mg/mL), transferrin (5mg/mL) and selenium (5 ng/mL). Cell passages between 25 and 35 were grown in a humidified incubator with 5% CO2 and 95% air at 37°C. During passages, cells were incubated with trypsin at room temperature for approximately one minute. Cell detachment was monitored using a microscope. Once detachment was complete, 5 mL of sterile-filtered 0.5 mg/mL soybean trypsin inhibitor in Hank’s balanced salt solution was added before re-plating.
Mitochondrial isolation from in vitro samples
TAMH cells grown to 80–90% confluence in 150mm2 tissue culture dishes and were dosed with 2 mM APAP that was dissolved directly into the culture medium and prepared on the same day as the dosing regimen. Mitochondrial fractions were isolated using the protocol described in Sigma’s Mitochondria Isolation Kit (St. Louis, MO). Briefly, after various treatments, cells were collected into preweighed 15 mL Falcon tubes by scraping. After centrifugation (800 × g) for 3 minutes at 4°C, the supernatant was removed by aspiration and cell pellets were washed with 2× volume of extraction buffer A (EBA). Following centrifugation (800 × g) for 3 minutes at 4°C, excess EBA was removed by aspiration and cells were resuspended in 10× volume of EBA containing 2 mg/mL albumin to remove excess lipids from the samples. Homogenization was performed (10 passes) on ice using a Dounce homogenizer with a Teflon-coated pestle, and efficiency was monitored every 5 passes under a microscope. The homogenate was then centrifuged (600 × g) for 5 minutes at 4°C, at which point the supernatant was transferred to Eppendorf tubes and centrifuged (11000 × g) for 10 minutes at 4°C. Supernatant was removed and pellets were resuspended in 10× volume of EBA. Again, the sample was centrifuged (600 × g) for 5 minutes at 4°C, at which point the supernatant was transferred to preweighed Eppendorf tubes and centrifuged (11000 × g) for 10 minutes at 4°C. The supernatant was removed by aspiration and the mitochondria were resuspended in 1× volume of storage buffer. Protein concentrations were determined by BCA assay.
Whole cell preparation
TAMH cells grown to 80–90% confluence in 6-well plates were dosed with 2 mM APAP that was dissolved directly into the culture medium and prepared on the same day as the dosing regimen. Once the dosing regimen was complete, TAMH cells were collected by centrifugation, cell pellets were transferred to preweighed Eppendorf tubes and resuspended in ice-cold DPBS rather than being plated. Samples were then centrifuged (700 × g) for 5 minutes at 4°C and excess DPBS was removed by aspiration.
Sample preparation for proteomic analysis
For each treatment condition, a volume of 100mM ammonium bicarbonate was added to 300 ug of mitochondrial protein to reach 100 uL. Approximately 34 mg of urea was then added and dissolved by gently vortexing the samples. 7 uL of 1.5 M Tris (pH 8.8) and 2.5 uL of 200 mM TCEP were added followed by a one-hour incubation and 37°C. Afterwards, samples were incubated for one hour at room temperature in the absence of light with 20 uL of 200 mM iodoacetamide followed by another one-hour incubation at room temperature with 20uL of 200mM DTT. 900 uL of 100mM ammonium bicarbonate and 200uL of methanol were then added to aid in the digestion of hydrophobic regions of the protein. Six mg of sequencing grade trypsin was then added to each sample followed by an overnight incubation at room temperature in the absence of light. The next day, a Speed Vac was used to bring samples to complete dryness (approximately 5 hours). Samples were then dissolved in 200uL of 5% acetonitrile containing 0.1% TFA. In order to ensure sample pH was less than 5, 20 uL of 0.5% TFA was added to each sample. Vydac Silica C-18 MicroSpin columns were prepared by washing once with 200 uL of a 50% acetonitrile solution containing 0.1% TFA, followed by washing three times with 200 uL of a 5% acetonitrile solution containing 0.1% TFA. Each wash contained a centrifugation step (400 × g) for 2 minutes. Once the washing and centrifugation steps were complete, samples were loaded and underwent centrifugation (400 × g) for 2 minutes. The flow-through was collected and reloaded onto the columns and underwent another 2 minute centrifugation (400 × g). Loaded columns were washed three times with 200 uL of a 5% acetonitrile solution containing 0.1% TFA. Again, each wash contained a centrifugation step (400 × g) for 2 minutes. After washing, the loaded columns were transferred to fresh Eppendorf tubes at which point the samples were eluted with for two minutes at 400 × g using 200 uL of a 50% acetonitrile solution containing 0.1% TFA. A speed vac was used to dry samples for 30–60 minutes at which point 5% acetonitrile containing 0.1% TFA was added to bring sample volumes up to 40 uL. Samples were then transferred to autosampler vials and stored at −80°C.
Reverse-phase HPLC and tandem mass spectrometry
A homemade precolumn and column were employed consisting of 100 uM and 75 uM i.d. fused silica capillary, respectively. The homemade precolumn was packed with approximately 2 cm of 200 Å Magic C-18 particles (Microm Bioresources) after a 1–2 mm sintered glass frit was in place. Packing was performed at 500 psi using laser grade helium. The homemade column with a gravity-pulled tapered tip was packed with approximately 20 cm of 100 Å Magic C-18 particles (Microm Bioresources). Packing was initially performed at 500 psi using laser grade helium and eventually increased to 1000 psi. Both columns were connected to a Thermo LTQ Orbitrap XL hybrid FT mass spectrometer, which combines a linear ion trap mass spectrometer with an Orbitrap mass analyzer. The columns were equilibrated for approximately 30 minutes with a 95% water 5% acetonitrile solution at a flow rate of 300 uL/min. Approximately 1 ug of sample per treatment condition was loaded on the precolumn in 95% water 5% acetonitrile containing 0.1% formic acid and eluted with an acetonitrile and water gradient containing 1% formic acid. The gradient ranged from 95% water 5% acetonitrile to 25% water 75% acetonitrile over the course of 130 minutes. Tandem mass sprectra were acquired in the linear ion trap and Orbitrap mass analyzer. As spectra were collected using Xcaliber 2.0.7, singly charged ions were excluded and sprectral redundancy was limited by excluding previously selected precursor ions for 30 seconds.
Peptide identification and spectral counting
All tandem mass spectrometry data was subjected to a SEQUEST search in order to identify peptides. Collected data were matched against the ipi.MOUSE.fasta.v3.54 database with a peptide mass tolerance of 2.10 and taking various possible post-translational modifications into account. A mass of 57.0216 Da was added to all cysteine residues to account for iodoacetamide alkylation, and differential modifications were included for oxidized methionine (15.9949 M), APAP-cysteine adducts (92.02622 C), and nitrotyrosine (45.9929 Y). Tandem mass spectra were then counted in order to measure peptide levels in a semiquantitative manner (Scheme 1). Briefly, scan numbers, precursor masses and charge states, monoisotopic masses and charge states, and intensities were extracted from the tandem mass spectra. From these extracted data, log files were generated upon which spectral counting was performed. Compared to control, an increase in the number of counted spectra was considered to represent upregulation of that protein, whereas a decrease in the number of counted spectra was considered to be representative of protein down regulation.
Pathway analysis of proteomic data
Pathway analysis was performed using the online bioinformatics database, DAVID (Database for Annotation, Visualization and Integrated Discovery, http://david.abcc.ncifcrf.gov/).29,30 A list containing proteins of interest was entered into DAVID as a gene list using OFFICIAL_GENE_SYMBOL as the identifier. Once uploaded, the gene list and background were set to Mus musculus and both BioCarta and KEGG (Kyoto Encyclopedia of Genes and Genomes, http://www.genome.ad.jp/kegg/) pathways were analyzed using the functional annotation tool within DAVID.
Statistical analysis
Data are presented as spectral count ratios. Comparisons between multiple groups were performed with Stata 10 using one-way analysis of variance (ANOVA) and subsequent t tests. For BioCarta and KEGG pathway data, statistical analysis and data normalization were carried out using DAVID.29
Results
Identification of post-translational modifications
Mitochondrial lysates from both in vivo and in vitro systems were subjected to proteomic analysis in order to determine putative sites for post-translational modifications using SEQUEST. Spectra of interest were investigated by hand to ensure that theoretical and acquired precursor ion masses matched well. While many interesting and promising cysteine residues were identified as potential sites for APAP adduction, upon further investigation of the individual spectra the results were inconclusive. Furthermore, no tyrosine resides were identified in separate searches as targets for nitration. These results suggest that SEQUEST searches utilizing post-translational modification qualifiers of 149.04768 Da to cysteine residues and 45.9929 Da to tyrosine residues are not capable of detecting APAP adducts or tyrosine nitration using current sample work-up protocols.
Spectral counting of mitochondrial protein levels in vivo
Spectral counting followed by subsequent pathway analysis was performed on the C57BL/6 mouse liver mitochondrial protein dataset. Differences in counted spectra of peptides from APAP-treated mice were compared with counted spectra of peptides from saline-treated mice. While 374 proteins were identified, spectral counts from 119 were found to be significantly different between APAP and control treatments (p < 0.1). Gene lists for those proteins found to be significantly up and downregulated according to counted spectra were uploaded to DAVID separately to identify pathways in which significantly altered proteins were implicated.
From the 50 proteins found to be differentially downregulted, DAVID identified two closely related KEGG pathways significantly altered by APAP compared to control in vivo; drug metabolism and metabolism of xenobiotics by cytochrome P450. The downregulation of proteins involved in these pathways are quantitatively expressed as a ratio of spectral counts from mitochondrial proteins of APAP-treated mice over spectral counts from mitochondrial proteins of vehicle saline-treated mice (Table 1). Furthermore, the mechanism of acetaminophen activity and toxicity was identified by DAVID as the most significant BioCarta pathway altered by APAP compared to control, suggesting that APAP treatment might be activating mechanisms that lead to a decrease in its bioactivation to NAPQI by downregulating protein levels of murine Cyp1a2, Cyp2e1, and Cyp3a11.
Table 1.
Differentially regulated mitochondrial proteins identified experimentally in the drug metabolism KEGG pathway following 6 h APAP treatment compared to control in vivo.
| Murine protein | Human ortholog | Description | Ratioa APAP/CON |
|---|---|---|---|
| Cyp1a2 | CYP1A2 | Cytochrome P450 1A2 | 0.321 |
| Cyp2a5 | CYP2A6 | Cytochrome P450 2A5 | N.D.b |
| Cyp2c54 | CYP2C19 | Cytochrome P450 2C54 | 0.167 |
| Cyp2e1 | CYP2E1 | Cytochrome P450 2E1 | 0.287 |
| Cyp3a11 | CYP3A4 | Cytochrome P450 3A11 | 0.295 |
| Cyp2d9 | - | Cytochrome P450, family 2, subfamily d, polypeptide 9 | 0.200 |
| Mgst1 | MGST1 | Microsomal glutathione S-transferase 1 | 0.617 |
Ratio of APAP-induced spectral counts over control spectral counts as described in reference 56; ratios greater than 1 represent upregulation, whereas ratios less than 1 represent downregulation.
Spectral count ratio could not be determined because no spectra were identified in APAP treatment.
From the 69 proteins found to be differentially upregulated, DAVID identified six KEGG pathways significantly altered by APAP compared to controls in vivo (Table 2, Supplemental Table 1). Of these pathways, four (Parkinson’s disease, Huntington’s disease, oxidative phosphorylation and Alzheimer’s disease) are associated with perturbations to mitochondrial bioenergetics. More specifically, approximately 22% of these upregulated proteins were associated with the electron transport chain (ETC) were found to be the major proteins upregulated by APAP (Figure 1). The upregulation of each protein related to the ETC and mitochondrial permeability transition pore (mPTP) is quantitatively expressed as a ratio of APAP-induced spectral counts over saline-induced spectral counts (Supplemental Table 2). Compared to control, APAP treatment led to significant upregulation of all differentially regulated proteins associated with the mPTP, all five mitochondrial electron transport complexes (I–V), as well as the mitochondrial isoform of superoxide dismutase (Sod2).
Table 2.
KEGG pathways differentially upregulated between APAP treatment and control.
| KEGG pathway | C57BL/6 |
TAMH |
||
|---|---|---|---|---|
| %a | p valueb | %a | p valueb | |
| Parkinson’s disease | 21 | 2.95E-08 | 14 | 5.86E-06 |
| Huntington’s disease | 22 | 1.27E-07 | 13 | 1.58E-03 |
| Oxidative phosphorylation | 19 | 3.78E-07 | 11 | 8.36E-03 |
| Valine, leucine and isoleucine degradation | 13 | 2.65E-06 | - | - |
| Alzheimer’s disease | 19 | 1.83E-05 | - | - |
| Fatty acid metabolism | 9 | 3.11E-02 | - | - |
Indicates the percentage of genes identified experimentally from the total number of genes related to that KEGG term (only KEGG pathways with % > 1 were considered).
p value < 0.05; includes FDR correction.
Figure 1.

Comparison of the total number of upregulated proteins to those associated with the ETC. Mitochondrial proteins from APAP-treated C57BL/6 mice and TAMH cells were isolated and analyzed by mass spectrometry. Proteins were characterized as significantly upregulated during APAP treatment compared to control by comparing the number of spectral counts for a given protein (p < 0.1). The subset of proteins associated with the ETC is shaded in black, whereas both shaded regions represent the total number of upregulated proteins.
Spectral counting of mitochondrial protein levels in vitro
Spectral counting followed by subsequent pathway analysis was performed on the TAMH mitochondrial protein dataset. Differences in counted spectra of peptides from APAP-treated cells were compared with counted spectra of peptides from those found in control samples. While 527 proteins were identified, spectral counts from 151 were found to be significantly different between APAP and control treatments (p < 0.1). Gene lists for those proteins found to be significantly up and downregulated according to counted spectra were uploaded to DAVID separately to identify pathways in which significantly altered proteins were involved.
No pathways were identified from the list of 67 proteins found to be differentially downregulated. However, from the list of 84 proteins found to be differentially upregulated, DAVID identified three KEGG pathways significantly altered when comparing APAP to control, all of which were previously identified in the APAP vs. control comparison in vivo (Table 2, Supplemental Table 3). Approximately 13% of these upregulated proteins were related to the ETC (Figure 1), and again, diseases associated with mitochondrial dysfunction were found to be the major pathways differentially regulated by APAP compared to control. The upregulation of each of the proteins involved in these pathways are quantitatively expressed as a ratio of drug-induced spectral counts over control spectral counts in Supplemental Table 4.
in vitro/in vivo comparisons
It was apparent that APAP treatment in the in vivo and in vitro samples significantly affected the same pathways (Table 2) and caused similar changes to protein components within the ETC (Supplemental Tables 2 and 4). In order to more clearly illustrate this point, spectra relating to ETC proteins that were significant and differentially regulated between drug treatments and control were grouped within their respective ETC complex. For example, all proteins relating to Complex I (NADH ubiquinone oxioreductase), which included Ndufa4, Ndufa6, Ndufa8, Ndufa9, Ndufb10, Ndufs8, Ndufv3, were pooled and comparisons were made with respect to treatment condition and model system (Table 3). When comparing APAP-induced ETC protein expression between in vivo and in vitro systems, both led to an increase in ETC protein, however, the upregulation was more pronounced in C57BL/6 mouse livers.
Table 3.
Significantly altered proteins within the electron transport chain following APAP treatment.
| Protein | Complex | 2 h APAP/CON Ratioa |
6 h APAP/CON Ratioa |
||
|---|---|---|---|---|---|
| C57BL/6 | TAMH | C57BL/6 | TAMH | ||
| NADH dehydrogenase | I | 1.7 | 1.6 | 1.8 | 1.3 |
| Succinate dehydrogenase | II | 1.0 | N.D.b | 2.2 | N.D.b |
| Cytochrome b-c1 complex | III | 2.6 | 1.0 | 4.3 | 1.6 |
| Cytochrome c oxidase | IV | 1.1 | 2.4 | 2.5 | 1.1 |
| ATP synthase | V | 1.5 | 1.4 | 1.5 | 1.2 |
Ratio of APAP-induced spectral counts over control spectral counts as described in reference 56; ratios greater than 1 represent upregulation, whereas ratios less than 1 represent downregulation
Spectral count ratio could not be determined because no spectra were identified as significantly different among treatment groups.
Discussion
Initial studies relating the metabolic activation of APAP to protein adduct formation led to the hypothesis that decreased function of the adducted proteins was the major cause of APAP-induced liver injury.13 However, no proven causal relationship between the formation of these adducts and APAP-induced liver injury has been identified,31,32 despite extensive efforts to identify and characterize functional changes to proteins susceptible to APAP adduction.18,33–44
Further evidence against a causal relationship between the extent of APAP-protein adduct formation and APAP-induced toxicity is the fact that reactive metabolites of AMAP form more covalent protein adducts compared to those formed during APAP metabolism, yet AMAP remains less toxic both in vivo15,16 and in vitro,14 establishing one of the first models where protein adduct formation did not serve as an ideal predictive screen for hepatotoxicity. This prompted comparisons of the protein adduction profiles of APAP and AMAP in hopes of differentiating adducts that were and were not related to hepatotoxicity. Early evidence suggested that APAP adducts were predominately, though not exclusively, formed on cysteine and sulfhydryl residues.45,46 Later work not only confirmed that APAP treatment led to a decrease in protein thiol levels, but that this depletion was not as severe during AMAP treatment.47 While sulfhydryl depletion may be one factor differentiating the toxicities of the regioisomers, evidence also suggests that the localization and residence time of the adducts plays an important role.19 Indeed, research has shown that AMAP adducts are more prevalent in the cytosol and endoplasmic reticulum while APAP adducts are more prevalent in the mitochondria.7,16 This would be consistent with observations that more reactive, shorter-lived AMAP metabolites bind closer to their site of bioactivation,48 whereas less reactive, longer-lived APAP metabolites are able to migrate and bind to mitochondrial proteins.17
When the results from these studies are applied to the “lethal” protein adduct hypothesis,15 it would suggest that “lethal” protein adducts are localized predominantly in the mitochondria, whereas “non-lethal” adducts occur closer in proximity to the site of bioactivation. For this reason mitochondria were isolated from both an in vitro model (TAMH) and an in vivo model (C57BL/6 mouse liver) in an attempt to identify the mitochondrial protein targets involved in APAP-induced mitochondrial dysfunction, which has been shown to play an important role in early events leading to APAP-mediated hepatocellular injury in mice.49–53
In this study, proteolytic digests and HPLC-tandem mass spectrometry (LC-MS/MS) with spectral counting was employed, rather than using APAP-antibodies or radiolabeled APAP combined with 2-D gel electrophoresis. It was anticipated that APAP protein adducts would be identified by SEQUEST by including 149.04768 Da as a possible cysteine modification in the database searches. Unfortunately, no adducts were conclusively identified in any of the mitochondrial preparations. In order to determine whether the mitochondrial preparation method could be responsible for destabilizing these adducts, TAMH whole cell lysates were prepared and analyzed by mass spectrometry. However, results from these studies also failed to identify any adducts. This suggests that the conditions during sample digest, desalting, or ionization, such as acid exposure or unanticipated adduct fragmentation, are likely responsible for the destabilization of adducts and not mitochondrial isolation conditions. It is also possible that these adducts only occur on a relatively small fraction of the individual proteins, or that adduct formation is occurring on low abundance proteins. In the latter case, increasing the amount of time before a previously selected precursor ion can be reselected might be potentially beneficial.
Although we were unable to detect stable protein adducts caused by APAP, these adducts only represent a small fraction of the changes to the liver proteome. This is based on our previous failure to characterize an APAP adduct to glucose-6-phosphate dehydrogenase (G6PDH) in livers of mice treated with hepatotoxic doses of APAP even though the enzyme activity was decreased by more than 80% and a standard of an adduct was prepared and fully characterized.36 Based on further studies, it appears that NAPQI, the major reactive and toxic metabolite of APAP, mostly forms an unstable ipso adduct with cysteinyl thiol groups that are subsequently S-thiolated.54 The ipso adduct, which has been shown to form reversibly and decompose rapidly at low pH,54 may explain why covalent protein adducts accounted for only 6% of the modifications to protein thiols detected in mouse liver after exposure to hepatotoxic doses of APAP.7
Since negative results were observed with respect to the identification of protein adducts, attempts were made to quantify protein expression. Spectral counting is a method that has been shown to accurately predict relative protein abundance from LC-MS/MS data.26 Furthermore, studies comparing label-free quantitative proteomic techniques have illustrated that these methods are capable of accurately detecting changes in protein expression.55–57 Currently, there are no reports quantitatively analyzing APAP-induced changes in protein expression using spectral counting.
The results from spectral counting experiments yielded consistent results between the in vitro and in vivo systems with respect to APAP-induced protein upregulation. The three KEGG pathways identified to be most significantly affected by APAP-induced protein upregulation in both TAMH and C57BL/6 mouse liver are all associated with mitochondrial dysfunction or bioenergetics (Table 2). Not only does this further validate TAMH as a good model for APAP-induced mitochondrial toxicity, but the striking consistency of these results also suggests that proteins associated with the ETC and mPTP are upregulated following APAP treatment. These findings correlate well with reports in the literature suggesting that mitochondrial dysfunction and activation of the mitochondrial permeability transition via pore opening are key mechanisms in APAP-induced liver injury.53,58–61 It is worth noting that while the general trend of APAP-induced upregulation of ETC proteins was consistent among the in vitro and in vivo samples, the upregulation was more pronounced in vivo (Table 3).
One difference observed between the in vitro and in vivo samples was the fact that proteins related to drug metabolism were significantly downregulated by APAP treatment in vivo (Table 1), whereas no pathways were significantly affected by protein downregulation in vitro. With respect to Cyp1a2, Cyp2e1, Cyp3a11, and Mgst1, the sequence coverage was greater than 20% and at least seven unique peptides were identified for each protein in vivo (Supplemental Table 5). Initially, it was confusing that these proteins related to drug metabolism, which are typically known to be microsomal in origin, were identified in mitochondrial lysates. However, two of these P450 isoforms, Cyp1a2 and Cyp2e1, have been shown to incorporate into mitochondria,62,63 as has Mgst1.64 Rationales for why the additional P450s in Table 1 were found in mitochondrial lysates are less clear. Two possible explanations might be that these P450 isoforms have yet to be identified in mitochondrial membranes, or perhaps the differential centrifugation used to isolate the mitochondria was not totally efficient at removing cytosolic and microsomal proteins. In any case, the fact that APAP-induced downregulation of P450 protein levels is consistent among all the differentially regulated isoforms that were identified suggests that this regulation may not be an artifact. Furthermore, Cyp1a2, Cyp2e1, and Cyp3a11, which were identified as the P450 isoforms with the highest sequence coverage (Supplemental Table 5), are responsible for the majority of the metabolism of APAP to the toxic metabolite, NAPQI, and have been shown to be modulated by the constitutive androstane receptor (CAR).65 With respect to Cyp3a11, expression has been shown to be dependant on CAR activity and independent of peroxisome proliferator-activated receptor alpha (PPAR∝) using knockout studies in mice.66,67 This observation may be an attempt to attenuate APAP-induced toxicity by preventing its bioactivation at the protein level. Another explanation may be that APAP treatment upregulates proinflammatory cytokines, which have been shown to down regulate P450s.68
APAP-induced upregulation of ETC and mPTP proteins in both TAMH and C57BL/6 mouse liver correlates well with published reports investigating the effects of APAP treatment on cellular morphology.69,70 Both studies observed mitochondrial proliferation accompanied by biomarkers related to toxicity following treatment with APAP, which explains why spectral counting identified upregulation of ETC and mPTP proteins in APAP-treated samples. Two plausible factors may explain these observations. First, this effect may be compensatory in nature due to the fact that APAP treatment has been shown to downregulate mitochondrial respiration through inhibition of numerous complexes within the ETC.58,69,71,72 Second, APAP-induced mitochondrial proliferation may be related to mitochondrial fission, a phenomenon associated with mitochondrial outer membrane permeabilization and apoptosis.73–75
Lastly, the results from these studies were compared to results previously reported in the literature at identical time points (Table 4). Using either densitometric 2-D gel electrophoresis23 or ICAT tagging24 coupled with mass spectrometry, protein expression was measured following treatment with APAP. When interpreting the results from Table 4, it is important to recognize variation among groups can be attributed to variables such as dose amount, dosing time, and mouse strain differences. With respect to dosing time and amount, previous work has shown that timepoint selection is critical in order to capture major time and dose-dependant changes in mitochondrial protein changes.23 Furthermore, the results presented here were obtained from mitochondria enriched samples, unlike results from previously published work. After 2 h of APAP treatment, the in vitro system (TAMH) appears to behave similarly to CD-1 mice23 as evidenced by consistent downregulation of Acaa2 and upregulation of Hspa9. In contrast, the in vivo system (C57BL/6) behaved quite differently from CD-1 mice after 2 h. Proteins such as Acaa2, Aldh2, Atp5b, and Prd were all found to be upregulated in C57BL/6 mice and downregulated in CD-1 mice (Table 4). Of additional interest is the fact that APAP has been shown to form adducts with or inhibit the activity of many of the proteins on this list including Aldh2, Cps1, and Sod2.37,39,44,76 In the case of Sod2, it was recently reported that a large increase in Sod2 activity was observed following 6 h APAP treatment without a corresponding increase in Sod2 protein as measured by Western blotting.76 However, using spectral counting this increase in Sod2 was observed at 6 h (Table 4). After 6 h, only Cyp3a11 expression was found to be differentially regulated between one of our systems (C57BL/6) and prior reports.24 This consistency is interesting because both laboratories used identical doses in the same mouse strain. Furthermore, the downregulation of a P450 known to metabolize APAP to NAPQI may indicate an attempt to attenuate APAP-induced mitochondrial injury by preventing its bioactivation.
Table 4.
Differential expression of protein levels associated with APAP treatment in C57BL/6 mouse liver and TAMH cells, and their comparison to protein expression changes that have been previously reported in the literature.
| Symbol | Description | 2 h, 300 mg/kg, C57BL/6 | 2 h, 2 mM, TAMH | 2 h, 150mg/kg, CD-1 a | 2 h, 500mg/kg, CD-1 a | 6 h, 300 mg/kg, C57BL/6 | 6 h, 2 mM, TAMH | 6 h, 300 mg/kg, C57BL/6 b | 6 h, 300 mg/kg, SJL b |
|---|---|---|---|---|---|---|---|---|---|
| Acaa2 | 3-ketoacyl-CoA thiolase | 1.3 | 0.7 | 0.7 | 0.6 | 1.4 | - | - | - |
| Aldh2 | Aldehyde dehydrogenasec | 1.8 | - | 0.7 | 0.6 | 1.8 | - | - | - |
| Atp5a1 | Atp5a1 ATP synthase subunit alpha | - | - | 1.0 | 0.5 | 1.4 | - | - | - |
| Atp5b | Atp5b ATP synthase subunit beta | 1.4 | - | 1.0 | 0.8 | 1.4 | - | - | - |
| Cps1 | Carbamoyl-phosphate synthase [ammonia]c | 1.1 | - | - | - | 1.3 | - | - | - |
| Cyp3a11 | Cyp3a11 Cytochrome P450 3A11 | - | - | - | - | 0.3 | - | 0.4 | 0.9 |
| Glud1 | Glutamate dehydrogenase 1c | 2.1 | 0.9 | - | - | 1.3 | - | - | - |
| Hspa9 | Stress-70 proteinc | - | 1.2 | 2.4 | 3.3 | - | - | - | - |
| Prd | Thioredoxin-dependent peroxide reductasec | - | 3.9 | 0.4 | 0.8 | - | 2.7 | - | - |
| Sod2 | Superoxide dismutase [Mn]c | - | - | - | - | 2.2 | - | - | - |
In summary, it appears that sample preparation protocols for proteomic analysis using SEQUEST, mass spectrometer fragmentation conditions, or both need to be modified in order to detect APAP adduct sites using this method due to the fact that adduct detection was not fully sucessful. However, the use of spectral counting to quantify proteins differentially regulated by each treatment group was consistent and identified ETC proteins as a target for APAP-induced upregulation among C57BL/6 mice and TAMH cells. The changes in ETC protein expression may be a compensatory mechanism to maintain ATP production during periods of drug-induced stress, since ATP levels are not only directly related to cell viability following treatment with APAP,21,47,77 but are also necessary to maintain cellular repair mechanisms. However, since APAP-induced stress targets the mitochondria, ATP production is likely compromised resulting in mitochondrial dysfunction via modification of critical mitochondrial proteins including those involved in electron transport. Researchers have already identified adducts to Complex V following APAP treatment,44 as well as nitrated residues on Complex I in response to mitochondrial oxidative stress.78 Therefore, any effect ETC protein upregulation would have on generating ATP is likely negated by the fact that mechanisms leading to mitochondrial toxicity have already been activated. Another possible scenario specifically relating to the in vivo situation might be the fact that upregulation of ETC proteins is occurring in adjacent, non-injured hepatocytes (Zones 1 and 2) in the liver as an adaptation that precedes replication of these hepatocytes as they respond to the damaged and dying cells in Zone 3. Future studies will need to address these questions and will be aimed at determining the exact mechanisms leading to APAP-induced ETC upregulation.
Supplementary Material
Acknowledgments
Funding Support. This work was supported by the National Institutes of Health [grant numbers GM32165], University of Washington’s Proteomics Resource [grant number UWPR95794], University of Washington’s Center for Ecogenetics and Environmental Health [grant number P30ES07033] and University of Washington’s Environmental Pathology/Toxicology Training Grant [grant number T32ES007032].
We thank Dr. Nelson Fausto from the University of Washington Department of Pathology for generously providing us with TAMH cells for experimentation, and Priska von Haller from the University of Washington’s Proteomic Resource for her expertise and assistance with the ThermoFisher Scientific Orbitrap XL.
Footnotes
Supporting Information Available: Supplemental Table 1, KEGG pathways containing mitochondrial proteins differentially upregulated between APAP and control in vivo. Supplemental Table 2, ETC proteins identified by DAVID to be differentially regulated in vivo following APAP treatment compared to control. Supplemental Table 3, KEGG pathways containing mitochondrial proteins differentially upregulated between APAP and control in vitro. Supplemental Table 4, ETC proteins identified by DAVID to be differentially regulated in vitro following APAP treatment compared to control. Supplemental Table 5, Peptide detection and sequence coverage for P450 isoforms and Mgst1 identified experimentally as differentially regulated in the drug metabolism KEGG pathway following 6 h APAP treatment compared to control in vivo.
References
- 1.Prescott LF. A Critical Bibliographic review. 1. Taylor & Francis; London: 1996. Paracetamol (Acetaminophen) [Google Scholar]
- 2.Lee WM. Acetaminophen and the U.S. Acute Liver Failure Study Group: lowering the risks of hepatic failure. Hepatology. 2004;40(1):6–9. doi: 10.1002/hep.20293. [DOI] [PubMed] [Google Scholar]
- 3.Nourjah P, Ahmad SR, Karwoski C, Willy M. Estimates of acetaminophen (Paracetomal)-associated overdoses in the United States. Pharmacoepidemiol Drug Saf. 2006;15(6):398–405. doi: 10.1002/pds.1191. [DOI] [PubMed] [Google Scholar]
- 4.Watari N, Iwai M, Kaneniwa N. Pharmacokinetic study of the fate of acetaminophen and its conjugates in rats. J Pharmacokinet Biopharm. 1983;11(3):245–72. doi: 10.1007/BF01061867. [DOI] [PubMed] [Google Scholar]
- 5.Nelson SD, Bruschi SA. Mechanisms of acetaminophen-induced liver disease. In: Kaplowitz N, DeLeve LD, editors. Drug-Induced Liver Disease. Informa Healthcare; New York: 2007. pp. 353–388. [Google Scholar]
- 6.Potter WZ, Thorgeirsson SS, Jollow DJ, Mitchell JR. Acetaminophen-induced hepatic necrosis. V. Correlation of hepatic necrosis, covalent binding and glutathione depletion in hamsters. Pharmacology. 1974;12(3):129–43. doi: 10.1159/000136531. [DOI] [PubMed] [Google Scholar]
- 7.Nelson SD, Tirmenstein MA, Rashed MS, Myers TG. Acetaminophen and protein thiol modification. Adv Exp Med Biol. 1991;283:579–88. doi: 10.1007/978-1-4684-5877-0_73. [DOI] [PubMed] [Google Scholar]
- 8.James LP, Mayeux PR, Hinson JA. Acetaminophen-induced hepatotoxicity. Drug Metab Dispos. 2003;31(12):1499–506. doi: 10.1124/dmd.31.12.1499. [DOI] [PubMed] [Google Scholar]
- 9.Jaeschke H, Gores GJ, Cederbaum AI, Hinson JA, Pessayre D, Lemasters JJ. Mechanisms of hepatotoxicity. Toxicol Sci. 2002;65(2):166–76. doi: 10.1093/toxsci/65.2.166. [DOI] [PubMed] [Google Scholar]
- 10.Mitchell JR, Jollow DJ, Potter WZ, Davis DC, Gillette JR, Brodie BB. Acetaminophen-induced hepatic necrosis. I. Role of drug metabolism. J Pharmacol Exp Ther. 1973;187(1):185–94. [PubMed] [Google Scholar]
- 11.Mitchell JR, Jollow DJ, Potter WZ, Gillette JR, Brodie BB. Acetaminophen-induced hepatic necrosis. IV. Protective role of glutathione. J Pharmacol Exp Ther. 1973;187(1):211–7. [PubMed] [Google Scholar]
- 12.Potter WZ, Davis DC, Mitchell JR, Jollow DJ, Gillette JR, Brodie BB. Acetaminophen-induced hepatic necrosis. 3. Cytochrome P-450-mediated covalent binding in vitro. J Pharmacol Exp Ther. 1973;187(1):203–10. [PubMed] [Google Scholar]
- 13.Jollow DJ, Mitchell JR, Potter WZ, Davis DC, Gillette JR, Brodie BB. Acetaminophen-induced hepatic necrosis. II. Role of covalent binding in vivo. J Pharmacol Exp Ther. 1973;187(1):195–202. [PubMed] [Google Scholar]
- 14.Holme JA, Hongslo JK, Bjorge C, Nelson SD. Comparative cytotoxic effects of acetaminophen (N-acetyl-p-aminophenol), a non-hepatotoxic regioisomer acetyl-m-aminophenol and their postulated reactive hydroquinone and quinone metabolites in monolayer cultures of mouse hepatocytes. Biochem Pharmacol. 1991;42(5):1137–42. doi: 10.1016/0006-2952(91)90299-k. [DOI] [PubMed] [Google Scholar]
- 15.Roberts SA, Price VF, Jollow DJ. Acetaminophen structure-toxicity studies: in vivo covalent binding of a nonhepatotoxic analog, 3-hydroxyacetanilide. Toxicol Appl Pharmacol. 1990;105(2):195–208. doi: 10.1016/0041-008x(90)90181-s. [DOI] [PubMed] [Google Scholar]
- 16.Tirmenstein MA, Nelson SD. Subcellular binding and effects on calcium homeostasis produced by acetaminophen and a nonhepatotoxic regioisomer, 3′-hydroxyacetanilide, in mouse liver. J Biol Chem. 1989;264(17):9814–9. [PubMed] [Google Scholar]
- 17.Myers TG, Dietz EC, Anderson NL, Khairallah EA, Cohen SD, Nelson SD. A comparative study of mouse liver proteins arylated by reactive metabolites of acetaminophen and its nonhepatotoxic regioisomer, 3′-hydroxyacetanilide. Chem Res Toxicol. 1995;8(3):403–13. doi: 10.1021/tx00045a012. [DOI] [PubMed] [Google Scholar]
- 18.Qiu Y, Benet LZ, Burlingame AL. Identification of hepatic protein targets of the reactive metabolites of the non-hepatotoxic regioisomer of acetaminophen, 3′-hydroxyacetanilide, in the mouse in vivo using two-dimensional gel electrophoresis and mass spectrometry. Adv Exp Med Biol. 2001;500:663–73. doi: 10.1007/978-1-4615-0667-6_99. [DOI] [PubMed] [Google Scholar]
- 19.Salminen WF, Jr, Roberts SM, Pumford NR, Hinson JA. Immunochemical comparison of 3′-hydroxyacetanilide and acetaminophen binding in mouse liver. Drug Metab Dispos. 1998;26(3):267–71. [PubMed] [Google Scholar]
- 20.Fountoulakis M, Berndt P, Boelsterli UA, Crameri F, Winter M, Albertini S, Suter L. Two-dimensional database of mouse liver proteins: changes in hepatic protein levels following treatment with acetaminophen or its nontoxic regioisomer 3-acetamidophenol. Electrophoresis. 2000;21(11):2148–61. doi: 10.1002/1522-2683(20000601)21:11<2148::AID-ELPS2148>3.0.CO;2-X. [DOI] [PubMed] [Google Scholar]
- 21.Stamper BD, Bammler TK, Beyer RP, Farin FM, Nelson SD. Differential regulation of mitogen-activated protein kinase pathways by acetaminophen and its nonhepatotoxic regioisomer 3′-hydroxyacetanilide in TAMH cells. Toxicol Sci. 2010;116(1):164–73. doi: 10.1093/toxsci/kfq100. [DOI] [PMC free article] [PubMed] [Google Scholar]
- 22.Domon B, Aebersold R. Mass spectrometry and protein analysis. Science. 2006;312(5771):212–7. doi: 10.1126/science.1124619. [DOI] [PubMed] [Google Scholar]
- 23.Ruepp SU, Tonge RP, Shaw J, Wallis N, Pognan F. Genomics and proteomics analysis of acetaminophen toxicity in mouse liver. Toxicol Sci. 2002;65(1):135–50. doi: 10.1093/toxsci/65.1.135. [DOI] [PubMed] [Google Scholar]
- 24.Welch KD, Wen B, Goodlett DR, Yi EC, Lee H, Reilly TP, Nelson SD, Pohl LR. Proteomic identification of potential susceptibility factors in drug-induced liver disease. Chem Res Toxicol. 2005;18(6):924–33. doi: 10.1021/tx050011b. [DOI] [PubMed] [Google Scholar]
- 25.Eng JK, McCormack AL, Yates JR., III An approach to correlate tandem mass spectral data of peptides with amino acid sequences in a protein database. J Am Soc Mass Spectrom. 1994;5(11):976–989. doi: 10.1016/1044-0305(94)80016-2. [DOI] [PubMed] [Google Scholar]
- 26.Liu H, Sadygov RG, Yates JR., 3rd A model for random sampling and estimation of relative protein abundance in shotgun proteomics. Anal Chem. 2004;76(14):4193–201. doi: 10.1021/ac0498563. [DOI] [PubMed] [Google Scholar]
- 27.McConnachie LA, Mohar I, Hudson FN, Ware CB, Ladiges WC, Fernandez C, Chatterton-Kirchmeier S, White CC, Pierce RH, Kavanagh TJ. Glutamate cysteine ligase modifier subunit deficiency and gender as determinants of acetaminophen-induced hepatotoxicity in mice. Toxicol Sci. 2007;99(2):628–36. doi: 10.1093/toxsci/kfm165. [DOI] [PubMed] [Google Scholar]
- 28.Zhao P, Kalhorn TF, Slattery JT. Selective mitochondrial glutathione depletion by ethanol enhances acetaminophen toxicity in rat liver. Hepatology. 2002;36(2):326–35. doi: 10.1053/jhep.2002.34943. [DOI] [PubMed] [Google Scholar]
- 29.Dennis G, Jr, Sherman BT, Hosack DA, Yang J, Gao W, Lane HC, Lempicki RA. DAVID: Database for Annotation, Visualization, and Integrated Discovery. Genome Biol. 2003;4(5):P3. [PubMed] [Google Scholar]
- 30.Huang DW, Sherman BT, Lempicki RA. Systematic and integrative analysis of large gene lists using DAVID Bioinformatics Resources. Nature Protoc. 2009;4(1):44–57. doi: 10.1038/nprot.2008.211. [DOI] [PubMed] [Google Scholar]
- 31.Bond GR. Acetaminophen protein adducts: a review. Clin Toxicol (Phila) 2009;47(1):2–7. doi: 10.1080/15563650801941831. [DOI] [PubMed] [Google Scholar]
- 32.Pumford NR, Roberts DW, Benson RW, Hinson JA. Immunochemical quantitation of 3-(cystein-S-yl)acetaminophen protein adducts in subcellular liver fractions following a hepatotoxic dose of acetaminophen. Biochem Pharmacol. 1990;40(3):573–9. doi: 10.1016/0006-2952(90)90558-3. [DOI] [PubMed] [Google Scholar]
- 33.Bartolone JB, Birge RB, Bulera SJ, Bruno MK, Nishanian EV, Cohen SD, Khairallah EA. Purification, antibody production, and partial amino acid sequence of the 58-kDa acetaminophen-binding liver proteins. Toxicol Appl Pharmacol. 1992;113(1):19–29. doi: 10.1016/0041-008x(92)90004-c. [DOI] [PubMed] [Google Scholar]
- 34.Bulera SJ, Birge RB, Cohen SD, Khairallah EA. Identification of the mouse liver 44-kDa acetaminophen-binding protein as a subunit of glutamine synthetase. Toxicol Appl Pharmacol. 1995;134(2):313–20. doi: 10.1006/taap.1995.1197. [DOI] [PubMed] [Google Scholar]
- 35.Cohen SD, Khairallah EA. Selective protein arylation and acetaminophen-induced hepatotoxicity. Drug Metab Rev. 1997;29(1–2):59–77. doi: 10.3109/03602539709037573. [DOI] [PubMed] [Google Scholar]
- 36.Dietze EC, Schafer A, Omichinski JG, Nelson SD. Inactivation of glyceraldehyde-3-phosphate dehydrogenase by a reactive metabolite of acetaminophen and mass spectral characterization of an arylated active site peptide. Chem Res Toxicol. 1997;10(10):1097–103. doi: 10.1021/tx970090u. [DOI] [PubMed] [Google Scholar]
- 37.Gupta S, Rogers LK, Taylor SK, Smith CV. Inhibition of carbamyl phosphate synthetase-I and glutamine synthetase by hepatotoxic doses of acetaminophen in mice. Toxicol Appl Pharmacol. 1997;146(2):317–27. doi: 10.1006/taap.1997.8228. [DOI] [PMC free article] [PubMed] [Google Scholar]
- 38.Halmes NC, Hinson JA, Martin BM, Pumford NR. Glutamate dehydrogenase covalently binds to a reactive metabolite of acetaminophen. Chem Res Toxicol. 1996;9(2):541–6. doi: 10.1021/tx950158a. [DOI] [PubMed] [Google Scholar]
- 39.Landin JS, Cohen SD, Khairallah EA. Identification of a 54-kDa mitochondrial acetaminophen-binding protein as aldehyde dehydrogenase. Toxicol Appl Pharmacol. 1996;141(1):299–307. doi: 10.1006/taap.1996.0287. [DOI] [PubMed] [Google Scholar]
- 40.Lores Arnaiz S, Llesuy S, Cutrin JC, Boveris A. Oxidative stress by acute acetaminophen administration in mouse liver. Free Radic Biol Med. 1995;19(3):303–10. doi: 10.1016/0891-5849(95)00023-q. [DOI] [PubMed] [Google Scholar]
- 41.Pumford NR, Halmes NC, Martin BM, Cook RJ, Wagner C, Hinson JA. Covalent binding of acetaminophen to N-10-formyltetrahydrofolate dehydrogenase in mice. J Pharmacol Exp Ther. 1997;280(1):501–5. [PubMed] [Google Scholar]
- 42.Pumford NR, Martin BM, Hinson JA. A metabolite of acetaminophen covalently binds to the 56 kDa selenium binding protein. Biochem Biophys Res Commun. 1992;182(3):1348–55. doi: 10.1016/0006-291x(92)91881-p. [DOI] [PubMed] [Google Scholar]
- 43.Zhou L, McKenzie BA, Eccleston ED, Jr, Srivastava SP, Chen N, Erickson RR, Holtzman JL. The covalent binding of [14C]acetaminophen to mouse hepatic microsomal proteins: the specific binding to calreticulin and the two forms of the thiol:protein disulfide oxidoreductases. Chem Res Toxicol. 1996;9(7):1176–82. doi: 10.1021/tx960069d. [DOI] [PubMed] [Google Scholar]
- 44.Qiu Y, Benet LZ, Burlingame AL. Identification of the hepatic protein targets of reactive metabolites of acetaminophen in vivo in mice using two-dimensional gel electrophoresis and mass spectrometry. J Biol Chem. 1998;273(28):17940–53. doi: 10.1074/jbc.273.28.17940. [DOI] [PubMed] [Google Scholar]
- 45.Streeter AJ, Dahlin DC, Nelson SD, Baillie TA. The covalent binding of acetaminophen to protein. Evidence for cysteine residues as major sites of arylation in vitro. Chem Biol Interact. 1984;48(3):349–66. doi: 10.1016/0009-2797(84)90145-5. [DOI] [PubMed] [Google Scholar]
- 46.Hoffmann KJ, Streeter AJ, Axworthy DB, Baillie TA. Identification of the major covalent adduct formed in vitro and in vivo between acetaminophen and mouse liver proteins. Mol Pharmacol. 1985;27(5):566–73. [PubMed] [Google Scholar]
- 47.Tirmenstein MA, Nelson SD. Acetaminophen-induced oxidation of protein thiols. Contribution of impaired thiol-metabolizing enzymes and the breakdown of adenine nucleotides. J Biol Chem. 1990;265(6):3059–65. [PubMed] [Google Scholar]
- 48.Rashed MS, Myers TG, Nelson SD. Hepatic protein arylation, glutathione depletion, and metabolite profiles of acetaminophen and a non-hepatotoxic regioisomer, 3′-hydroxyacetanilide, in the mouse. Drug Metab Dispos. 1990;18(5):765–70. [PubMed] [Google Scholar]
- 49.Hinson JA, Reid AB, McCullough SS, James LP. Acetaminophen-induced hepatotoxicity: role of metabolic activation, reactive oxygen/nitrogen species, and mitochondrial permeability transition. Drug Metab Rev. 2004;36(3–4):805–22. doi: 10.1081/dmr-200033494. [DOI] [PubMed] [Google Scholar]
- 50.Knight TR, Jaeschke H. Acetaminophen-induced inhibition of Fas receptor-mediated liver cell apoptosis: mitochondrial dysfunction versus glutathione depletion. Toxicol Appl Pharmacol. 2002;181(2):133–41. doi: 10.1006/taap.2002.9407. [DOI] [PubMed] [Google Scholar]
- 51.Knight TR, Kurtz A, Bajt ML, Hinson JA, Jaeschke H. Vascular and hepatocellular peroxynitrite formation during acetaminophen toxicity: role of mitochondrial oxidant stress. Toxicol Sci. 2001;62(2):212–20. doi: 10.1093/toxsci/62.2.212. [DOI] [PubMed] [Google Scholar]
- 52.Kon K, Kim JS, Jaeschke H, Lemasters JJ. Mitochondrial permeability transition in acetaminophen-induced necrosis and apoptosis of cultured mouse hepatocytes. Hepatology. 2004;40(5):1170–9. doi: 10.1002/hep.20437. [DOI] [PubMed] [Google Scholar]
- 53.Kon K, Kim JS, Uchiyama A, Jaeschke H, Lemasters JJ. Lysosomal Iron Mobilization and Induction of the Mitochondrial Permeability Transition in Acetaminophen-Induced Toxicity to Mouse Hepatocytes. Toxicol Sci. 2010 doi: 10.1093/toxsci/kfq175. [DOI] [PMC free article] [PubMed] [Google Scholar]
- 54.Chen W, Shockcor JP, Tonge R, Hunter A, Gartner C, Nelson SD. Protein and nonprotein cysteinyl thiol modification by N-acetyl-p-benzoquinone imine via a novel ipso adduct. Biochemistry. 1999;38(25):8159–66. doi: 10.1021/bi990125k. [DOI] [PubMed] [Google Scholar]
- 55.Old WM, Meyer-Arendt K, Aveline-Wolf L, Pierce KG, Mendoza A, Sevinsky JR, Resing KA, Ahn NG. Comparison of label-free methods for quantifying human proteins by shotgun proteomics. Mol Cell Proteomics. 2005;4(10):1487–502. doi: 10.1074/mcp.M500084-MCP200. [DOI] [PubMed] [Google Scholar]
- 56.Ryu S, Gallis B, Goo YA, Shaffer SA, Radulovic D, Goodlett DR. Comparison of a label-free quantitative proteomic method based on peptide ion current area to the isotope coded affinity tag method. Cancer Inform. 2008;6:243–55. doi: 10.4137/cin.s385. [DOI] [PMC free article] [PubMed] [Google Scholar]
- 57.Zhu W, Smith JW, Huang CM. Mass spectrometry-based label-free quantitative proteomics. J Biomed Biotechnol. 2010;2010:840518. doi: 10.1155/2010/840518. [DOI] [PMC free article] [PubMed] [Google Scholar]
- 58.Burcham PC, Harman AW. Acetaminophen toxicity results in site-specific mitochondrial damage in isolated mouse hepatocytes. J Biol Chem. 1991;266(8):5049–54. [PubMed] [Google Scholar]
- 59.Burke AS, Macmillan-Crow LA, Hinson JA. Reactive nitrogen species in acetaminophen-induced mitochondrial damage and toxicity in mouse hepatocytes. Chem Res Toxicol. 2010;23(7):1286–92. doi: 10.1021/tx1001755. [DOI] [PMC free article] [PubMed] [Google Scholar]
- 60.Latchoumycandane C, Seah QM, Tan RC, Sattabongkot J, Beerheide W, Boelsterli UA. Leflunomide or A77 1726 protect from acetaminophen-induced cell injury through inhibition of JNK-mediated mitochondrial permeability transition in immortalized human hepatocytes. Toxicol Appl Pharmacol. 2006;217(1):125–33. doi: 10.1016/j.taap.2006.08.001. [DOI] [PubMed] [Google Scholar]
- 61.Masubuchi Y, Suda C, Horie T. Involvement of mitochondrial permeability transition in acetaminophen-induced liver injury in mice. J Hepatol. 2005;42(1):110–6. doi: 10.1016/j.jhep.2004.09.015. [DOI] [PubMed] [Google Scholar]
- 62.Anandatheerthavarada HK, Addya S, Dwivedi RS, Biswas G, Mullick J, Avadhani NG. Localization of multiple forms of inducible cytochromes P450 in rat liver mitochondria: immunological characteristics and patterns of xenobiotic substrate metabolism. Arch Biochem Biophys. 1997;339(1):136–50. doi: 10.1006/abbi.1996.9855. [DOI] [PubMed] [Google Scholar]
- 63.Bansal S, Liu CP, Sepuri NB, Anandatheerthavarada HK, Selvaraj V, Hoek J, Milne GL, Guengerich FP, Avadhani NG. Mitochondria-targeted cytochrome P450 2E1 induces oxidative damage and augments alcohol-mediated oxidative stress. J Biol Chem. 2010;285(32):24609–19. doi: 10.1074/jbc.M110.121822. [DOI] [PMC free article] [PubMed] [Google Scholar]
- 64.Lee KK, Shimoji M, Hossain QS, Sunakawa H, Aniya Y. Novel function of glutathione transferase in rat liver mitochondrial membrane: role for cytochrome c release from mitochondria. Toxicol Appl Pharmacol. 2008;232(1):109–18. doi: 10.1016/j.taap.2008.06.005. [DOI] [PubMed] [Google Scholar]
- 65.Zhang J, Huang W, Chua SS, Wei P, Moore DD. Modulation of acetaminophen-induced hepatotoxicity by the xenobiotic receptor CAR. Science. 2002;298(5592):422–4. doi: 10.1126/science.1073502. [DOI] [PubMed] [Google Scholar]
- 66.Ren H, Aleksunes LM, Wood C, Vallanat B, George MH, Klaassen CD, Corton JC. Characterization of peroxisome proliferator-activated receptor alpha--independent effects of PPARalpha activators in the rodent liver: di-(2-ethylhexyl) phthalate also activates the constitutive-activated receptor. Toxicol Sci. 2010;113(1):45–59. doi: 10.1093/toxsci/kfp251. [DOI] [PMC free article] [PubMed] [Google Scholar]
- 67.Chen C, Krausz KW, Shah YM, Idle JR, Gonzalez FJ. Serum metabolomics reveals irreversible inhibition of fatty acid beta-oxidation through the suppression of PPARalpha activation as a contributing mechanism of acetaminophen-induced hepatotoxicity. Chem Res Toxicol. 2009;22(4):699–707. doi: 10.1021/tx800464q. [DOI] [PMC free article] [PubMed] [Google Scholar]
- 68.Aitken AE, Richardson TA, Morgan ET. Regulation of drug-metabolizing enzymes and transporters in inflammation. Annu Rev Pharmacol Toxicol. 2006;46:123–49. doi: 10.1146/annurev.pharmtox.46.120604.141059. [DOI] [PubMed] [Google Scholar]
- 69.Adams ML, Pierce RH, Vail ME, White CC, Tonge RP, Kavanagh TJ, Fausto N, Nelson SD, Bruschi SA. Enhanced acetaminophen hepatotoxicity in transgenic mice overexpressing BCL-2. Mol Pharmacol. 2001;60(5):907–15. doi: 10.1124/mol.60.5.907. [DOI] [PubMed] [Google Scholar]
- 70.Pierce RH, Franklin CC, Campbell JS, Tonge RP, Chen W, Fausto N, Nelson SD, Bruschi SA. Cell culture model for acetaminophen-induced hepatocyte death in vivo. Biochem Pharmacol. 2002;64(3):413–24. doi: 10.1016/s0006-2952(02)01180-2. [DOI] [PubMed] [Google Scholar]
- 71.Donnelly PJ, Walker RM, Racz WJ. Inhibition of mitochondrial respiration in vivo is an early event in acetaminophen-induced hepatotoxicity. Arch Toxicol. 1994;68(2):110–8. doi: 10.1007/s002040050043. [DOI] [PubMed] [Google Scholar]
- 72.Ramsay RR, Rashed MS, Nelson SD. In vitro effects of acetaminophen metabolites and analogs on the respiration of mouse liver mitochondria. Arch Biochem Biophys. 1989;273(2):449–57. doi: 10.1016/0003-9861(89)90504-3. [DOI] [PubMed] [Google Scholar]
- 73.Autret A, Martin SJ. Bcl-2 family proteins and mitochondrial fission/fusion dynamics. Cell Mol Life Sci. 2010;67(10):1599–606. doi: 10.1007/s00018-010-0286-x. [DOI] [PMC free article] [PubMed] [Google Scholar]
- 74.Frank S, Gaume B, Bergmann-Leitner ES, Leitner WW, Robert EG, Catez F, Smith CL, Youle RJ. The role of dynamin-related protein 1 a mediator of mitochondrial fission, in apoptosis. Dev Cell. 2001;1(4):515–25. doi: 10.1016/s1534-5807(01)00055-7. [DOI] [PubMed] [Google Scholar]
- 75.Mancini M, Anderson BO, Caldwell E, Sedghinasab M, Paty PB, Hockenbery DM. Mitochondrial proliferation and paradoxical membrane depolarization during terminal differentiation and apoptosis in a human colon carcinoma cell line. J Cell Biol. 1997;138(2):449–69. doi: 10.1083/jcb.138.2.449. [DOI] [PMC free article] [PubMed] [Google Scholar]
- 76.Agarwal R, MacMillon-Crow LA, Rafferty TM, Saba H, Roberts DW, Fifer EK, James LP, Hinson JA. Acetaminophen-induced hepatotoxicity in mice occurs with inhibition of activity and nitration of mitochondrial manganese superoxide dismutase. J Pharmacol Exp Ther. 2010 Dec 30; doi: 10.1124/jpet.110.176321. [Epub ahead of print] [DOI] [PMC free article] [PubMed] [Google Scholar]
- 77.Jaeschke H. Glutathione disulfide formation and oxidant stress during acetaminophen-induced hepatotoxicity in mice in vivo: the protective effect of allopurinol. J Pharmacol Exp Ther. 1990;255(3):935–41. [PubMed] [Google Scholar]
- 78.Liu B, Tewari AK, Zhang L, Green-Church KB, Zweier JL, Chen YR, He G. Proteomic analysis of protein tyrosine nitration after ischemia reperfusion injury: mitochondria as the major target. Biochim Biophys Acta. 2009;1794(3):476–85. doi: 10.1016/j.bbapap.2008.12.008. [DOI] [PMC free article] [PubMed] [Google Scholar]
Associated Data
This section collects any data citations, data availability statements, or supplementary materials included in this article.