Abstract
Despite significant infiltration into tumors, the effector function of macrophages (MPs) and microglia (MG) appears to be suppressed in gliomas. Although STAT3 pathway is thought to play a role in this process, the exact mechanism by which gliomas induce STAT3 activation in MPs and MG is not known. Because activation of receptor for advanced glycation end products (RAGE) can induce STAT3, and because gliomas express high levels of S100B, a RAGE ligand, we hypothesized that MP/MG STAT3 activity may be modulated through S100B-RAGE interaction. Exposure of N9 MG and bone marrow-derived monocytes (BMM) to GL261 glioma condition medium (GCM) and low (nM) levels of S100B increased RAGE expression, induced STAT3 and suppressed MG function in vitro. Furthermore, neutralization of S100B in GCM, partially reversed IL-1β suppression in BMM, suggesting that the inhibitory effect of GCM to be in part due to S100B. Finally, blockage of S100B-RAGE interaction inhibited STAT3 activation in N9 MG and in glioma MG/MP in vivo. These findings suggest that the RAGE pathway may play an important role in STAT3 induction in glioma-associated MG/MPs, and that this process may be mediated through S100B.
Keywords: Brain neoplasm, Macrophage, Mice, RAGE
Introduction
The prognosis of patients with malignant gliomas, the most common type of primary brain neoplasm, remains dismal despite aggressive treatment. Rapid tumor growth, invasive nature, and presence of the blood-brain barrier, which limits the penetration of large molecules into the central nervous system (CNS), all contribute to poor glioma response to conventional therapies (Muldoon et al. 2007). Furthermore, brain has been considered to be an immune-privileged site, in part due to lack of lymphatic system and poor penetration of inflammatory cells across an intact blood-brain barrier. Although, recent work has demonstrated the presence CNS-immune surveillance in healthy and inflammatory conditions (Galea et al. 2007), glioma microenvironment may provide yet another barrier that attenuates the host anti-tumor response through secretion of inhibitory factors and attraction of immunosuppressive leukocytes such as regulatory T cells and myeloid-derived suppressor cells (MDSCs) (Okada et al. 2009); (Skog et al. 2008).
Myeloid-derived suppressor cells are a heterogeneous population of cells of myeloid origin that have been reported to suppress the immune system and promote tumor growth (Gabrilovich and Nagaraj 2009). Although these cells have not been well-characterized in gliomas, they may have differentiated into infiltrating microglia (MG) during brain development and macrophages (MPs) during tumor growth. Although as active mediators of the innate immune response MG and MPs constitute the first line of cellular defense against pathogens, their inflammatory function may be suppressed in gliomas and they may even promote tumor invasion (Du et al. 2008; Markovic et al. 2005; Watters et al. 2005). The exact mechanism by which MG/MP immune function is suppressed in gliomas, however, is unclear but most likely involves secretion of immunosuppressive factors.
S100B, a member of a multigenic family of Ca2+-binding protein of the EF-hand type, has been implicated in the regulation of both intracellular and extracellular activities such as microtubule and type III intermediate filament assembly and cell proliferation. In the nervous system, S100B can be detected in the extracellular space (ECS), astrocytes, and several neuronal populations (Donato et al. 2009). Astrocytes release S100B constitutively, but its secretion into the ECS can also be augmented by various stimuli (Edwards and Robinson 2006; Pinto et al. 2000; Whitaker-Azmitia et al. 1990). Once released, S100B can differentially affect neurons, astrocytes, and MG mostly through engagement of RAGE (Receptor for Advanced glycation end products), its primary receptor (Donato 2007). Concentration of S100B within the ECS appears to be important in determining its overall effect on cellular homeostasis. At low nM concentrations, S100B acts as a neurotrophic factor protecting neurons against noxious stimuli and stimulating neurite outgrowth, while at high concentrations it can mediate more deleterious events such as brain inflammation (Donato et al. 2009).
S100B levels can increase in a number of CNS pathologies including, trauma, stroke, degenerative processes, epilepsy, and infectious/inflammatory diseases (Mrak and Griffin 2004). Acting in an autocrine fashion, at high concentrations (above 10μg/ml), S100B increases inducible nitric oxide (iNOS) synthase activity and mRNA levels in rat cortical astrocytes via activation of NF-κB and causes apoptosis of astrocytes and cocultured neurons (Hu and Van Eldik 1996; Lam et al. 2001). In addition, S100B upregulates IL-1β expression in astrocytes (Hu and Van Eldik 1999) and stimulates the release of IL-6 and TNF-α from primary astrocytes at doses above 2 μg/ml (Ponath et al. 2007). S100B is also elevated in certain cancers like melanomas and gliomas (Davey et al. 2001; Hauschild et al. 1999; Joseph et al. 2007; Torabian and Kashani-Sabet 2005). S100B has been proposed to contribute to tumorigenesis by inhibiting the function of the tumor suppressor protein p53 (Lin et al. 2004; Rustandi et al. 2000) and to regulate cell proliferation and differentiation by stimulating the activity of the mitogenic kinases Ndr (Millward et al. 1998) and Akt (protein kinase B) (Arcuri et al. 2005). Furthermore, S100B has been shown to stimulate C6 glioma proliferation, and to participate in astrocyte differentiation and activation through interaction with Src kinase (Brozzi et al. 2009); (Selinfreund et al. 1991). These reports suggest that S100B might contribute to the differentiation of astrocytes and potentially promote their activation and invasiveness.
Because oxidative stress and necrosis are hallmarks of high-grade gliomas, and because astrocytomas (the most common type of glioma) express high levels of S100B by immunostaining, we evaluated the role of S100B-RAGE interaction on MG/MP function in a murine glioma model. Here, we demonstrate that GL261 glioma conditioned medium (GCM) upregulated RAGE and inhibited IL-1β expression by N9 and primary monocytes in vitro. Similarly, low levels of S100B inhibited MG function and induced STAT3 expression. Inhibition RAGE (S100B receptor) with blocking antibody (Ab), abolished STAT3 activation in N9 MG in vitro and MG/MPs in vivo. These findings suggest that S100B-RAGE interaction may play an important role in STAT3 activation and MG/MP suppression in gliomas. A better understanding of this interaction may be beneficial in optimizing immunotherapy approaches against malignant brain tumors.
Materials and Methods
Reagents
Lipopolysaccharide (LPS) was purchased from Sigma (St Louis, MO), S100B from Calbiochem (San Diego, CA), and full-length RAGE and the RAGE blocking Abs from Abcam (Middlesex, NJ) and Santa Cruz (Santa Cruz, CA), respectively. All Abs for Western blotting (i.e. phospho-STAT3, phospho-p38, phospho-p42, STAT3, p38, and p42) were purchased from Cell Signaling Company (Boston, MA).
Cell Culture and transfection
N9 MG and GL261 glioma cell lines were cultured in DMEM medium supplemented with 10% heat-inactivated FBS (BioWhittaker, Walkersville, MD), 100 U/mL penicillin-G, 100 μg/ml streptomycin, and 0.01 M Hepes (Life Technologies, Gaithersburg, MD). GL261 glioma-conditioned Medium (GCM) was collected when newly plated GL261 cultures were 50% confluent. GCM was prepared fresh for each experiment and was filtered through a 0.45 μm filter (Fischer Scientific, Tustin, CA). Primary bone marrow-derived monocytes (BMM) were harvested from bone marrow of normal or STAT3 deficient mice. After washing the bone marrow with cold PBS, cells were isolated and collected with Cell Strainer (BD Biosciences, San Jose, CA). The isolated primary monocytes were then cultured in L929-conditioned DMEM medium. Red blood cells and other non-adherent cells were removed by changing the culture medium in 24 h. Cultures with more than 90% CD11b+ purity were used for experiments.
Tumor implantation
Mice were housed and handled in accordance to the guidelines of City of Hope Institutional Animal Care and Use Committee under pathogen-free conditions. All mice were on C57BL/6J background. CX3CR1GFP mice that express EGFP under control of the endogenous Cx3cr1 locus were purchased from Jackson Laboratory (Sacramento, CA). Stat3−/− mice were a generous gift from Dr. Hua Yu at City of Hope. Generation of these mice with Stat3−/− hematopoietic cells by inducible Mx1-Cre recombinase system transgene has been reported before (Kortylewski et al. 2005). Intracranial tumor implantation was performed as described previously (Zhang et al. 2009).
For in vivo RAGE blocking experiments, tumor-bearing mice received two intravenous injections of anti-RAGE Ab (αRAGE, 100μg, Santa Cruz, CA) (Beauchamp et al. 2004), control IgG (100μg), or PBS on days 14 and 16 after tumor implantation. Twenty four h after the last injection brain and blood samples were harvested and processed for STAT3 analysis by flow cytometry and immunohistochemistry (4 mice/group).
Isolation of tumor MG/MPs
Tumor MG/MPs were isolated as previously described (Zhang et al. 2009). Briefly, tumor tissue was minced and digestion with trypsin for 20 min at 37°C. Tissue homogenate was filtered through a 40μM filter and MG/MP cell population was separated by Percoll gradient (GE Healthcare) at 350g–400g for 45 min with no brake.
Flow cytometry analysis
The allophycocyanin-conjugated Abs to mouse CD11b (Cat: 553312), STAT3 (Cat: 557815), and S100B were purchased from BD Pharmingen (San Diego, CA). Allophycocyanin-conjugated Ab to mouse TNF-α (Cat: 1707321-81) was purchased from eBioscience (San Diego, CA). The primary rabbit-mouse RAGE (Cat: ab3611-100) and secondary goat anti-rabbit-FITC (Cat: sc-2012) were purchased from Abcam (Middlesex, NJ) and Santa Cruz Biotechnology (Santa Cruz, CA), respectively. Intracellular TNF-α cytokine staining was performed following the vendor’s instruction(Intracellular cytokine staining kits; BD Biosciences, San Jose, CA), as previously described (Kortylewski et al. 2009). Briefly, cells were stimulated with 1 μg/ml inomycin plus 0.1μg/mL PMA in the presence of Golgi-Stop for 4 h. Cells were harvested, washed, and stained with anti-CD11b in the presence of FcR-Block, anti-CD16/32. After wash, cells were then fixed using CytoFix/CytoPermbuffer and stained with anti-TNF-α or isotype control on ice for 30 min. Intracellular pSTAT3 staining was performed as previously described (Kortylewski et al. 2009). In vivo RAGE and S100B staining was carried out by using Fixation/Permeabilization solution according to the manufacturer’s instructions (BD Pharmingen. San Diego, CA). Multiple-color FACS analyses was performed at City of Hope FACS facility using a 3-laser CyAn immunocytometry system (Dako Cytomation, Fort Collins, CO), and data was analyzed using FlowJo software (TreeStar, San Carlos, CA).
Immunofluorescence staining
Frozen brain sections were prepared from normal and tumor-bearing CX3CR1GFP mice. Brains were embedded in O.C.T. (Tissue-Tek) and 10 μm sections were cut using cryostat (Leica Microsystem Inc., Bannockburn, IL). Prior to immunofluorescence staining, slides were baked in 37°C and permeabilized in methanol for 15 min. After one h blocking, the slides were incubated with S100B (1:200 dilution of mouse anti-S100B Ab; BDbiosciences, San Jose, CA), pSTAT3 (1:100 dilution of rabbit anti-mouse pSTAT3 mAb; Cell Signaling Technology, Danvers, MA), or RAGE (1:100 dilution of Rabbit anti-mouse RAGE Ab; Abcam, Middlesex, NJ) primary Abs for 1 h. Slides were washed with PBS containing 0.1% Triton X-100 (PBS-T) 3 times for 5 min and incubated with secondary antibody (Anti-mouse or anti-rabbit Texas Red 1:1000 dilution; Santa Cruz Biotechnology, Inc. Santa Cruz, CA) for another h. Sections were mounted in Vectashield mounting medium containing 4060-diamidino-2- phenylindole (DAPI) (Vector, Burlingame, CA). Images were obtained by AX-70 fluorescent microscopy (Leica Microsystems Inc., Bannockburn, IL) and were prepared by Zeiss LSM Image Browser software. pSTAT3 staining intensity was calculated by measuring the frequency of pSTAT3+ EGFP+ cells (mostly MG/MP), and by counting the number of pSTAT3 particles per MG/MP (EGFP+ cell) in 50 randomly-selected 20X peritumoral fields for each slide (3 slides per mouse with observers blinded to treatment groups).
RT-PCR
Real-time PCR was performed in a TaqMan 5700 Sequence Detection System (Applied Biosystems, Foster City, CA) as described previously (Zhang et al. 2007). The amplified transcripts were quantified using the comparative CT method (Song et al. 2001). PCR conditions were optimized such that a minimum of 10,000 fold range could be detected for each primer. GAPDH: 5′-GTTAGTGGGGTCTCGCTCTG-3′, 5′-GGCAAATTCAACGGCACA-3′; I L-1β:5′-AGGGCTGTCTGGAGTCCTC-3′,5′-GACCAGCCGCCGCCGCAGG-3′; IL-10: 5′-ACCTGCTCCACTGCCTTGCT-3′; 5′-GGTTGCCAAGCCTTATCGGA-3′. STAT3: 5′-GAAACAACCAGTCTGTGACCAG-3′; 5′-CACGTACTCCATTGCTGACAAG-3′ RAGE: 5′-GTGGCTCAAATCCTCCCCAAT-3′; 5′-CCTTCCCTCGCCTGTTAGTTG-3′
ELISA
The ELISA for S100B (Biovendor Candler, NC) and soluble RAGE (R&D System Minneapolis, MN) were performed according to the manufacturer’s instructions.
EMSA
STAT3 EMSA was performed as described previously (Zhang et al. 2009). A double-stranded mutated SIE-oligonucleotide from the c-fos promoter (m67SIE: 5′-GATCCGGGAGGGATTTACGGGAAATGCTG-3′) was labeled using [γ-32P] ATP (3,000 Ci/mmol, PerkinElmer Life Sciences) and T4 polynucleotide kinase (Promega, WI). 32P-Labeled probes were purified using MicroSpin™ G-25 columns (GE Healthcare Piscataway, NJ). Nuclear extracts containing 5 μg of protein were incubated with 10 fmol (10000 c.p.m.) of probe in gel-shift incubation buffer (10 mM HEPES pH 7.8, 1 mM EDTA, 5 mM MgCl2, 10% glycerol, 5 μM dithiothreitol, 0.7 μM phenylmethylsulfonyl fluoride, 0.1 mg/mL of poly(dI-C) and 1 mg/ml bovine serum albumin) for 10 min at RT. The protein-DNA complexes were separated on a 4.5% polyacrylamide gel containing 7.5% glycerol in 0.25-fold TBE at 20 V/cm for 4 h. Gels were fixed in an aqueous solution of 10% methanol and 10% acetic acid for 30 min, dried and autoradiographed. Data were further analyzed with a Storm 840 PhosphorImager (Molecular Dynamics, Sunnyvale, CA).
Western blot
Cells were lysed on the plate (6 well plate) with 200 μl lysis buffer (1% Triton X-100, 10% glycerol, 50 mM HEPES pH 7.5, 1 mM EGTA, 150 mM NaCl, 1.5 mM MgCl2, 50 mM sodium fluoride, 1 mM sodium vanadate, 1 mM PMSF, 200 μg/ml aprotinin, and 50 μg/ml leupeptin). Lysates were cleared by centrifugation at 12,000g and protein concentration was determined with the BioRad protein assay using BSA as standard. Equal amounts of protein were separated on 12.5% SDS-PAGE gels, transferred to PVDF membrane (Millipore Bedford, MA) and probed with primary Abs specific for Phospho-Tyr 705 STAT3, p-p38, p-p42, p38, and p42 (Cell Signaling Company Boston, MA) followed by detection using the ECL system (Millipore Bedford, MA). AlphaImager software (Cell Biosciences) was used to quantify band intensity relative to β-actin.
Coimmunoprecipitation Depletion Assay
Antibody against S100B (Abcam, 2 μg/ml) was added to GL261 GCM. IgG was used as a control. After over-night incubation at 4°C, Protein A Agarose (InvitroGen, 30 μl/ml) was added and incubated for 1 h at RT. S100B-Ab-Protein A complex was then removed by centrifugation.
Statistical analysis
Statistical comparison in all different experimental conditions was performed with the prism software using two-way analysis of variance (ANOVA) or Student’s T test.
Results
GCM modulates MG RAGE expression
To test if secreted glioma factors influenced MG RAGE expression, N9 cells were incubated with DMEM or GCM, and membrane-bound full-length RAGE (FL-RAGE) and secreted RAGE (sRAGE) were examined (Fig. 1). RAGE protein, which was constitutively expressed by N9 cells was up-regulated by GCM within a few h of exposure to GCM, possibly as a result of rapid translocation onto cell membrane from intracellular sources (Fig. 1A). At later time points (24–48 h), RAGE levels decreased while sRAGE transiently increased in culture supernatant, most likely due to proteolytic cleavage of FL-RAGE from N9 cell membrane (Fig. 1B). Finally, RAGE mRNA expression increased after 48h of exposure to GCM, perhaps to replenish the released sRAGE (Fig. 1C). These findings confirm that gliomas, through secretion of soluble factors, can activate (engage) RAGE in MG. To confirm these observations in vivo, RAGE expression was examined in intracranial gliomas.
Figure 1.
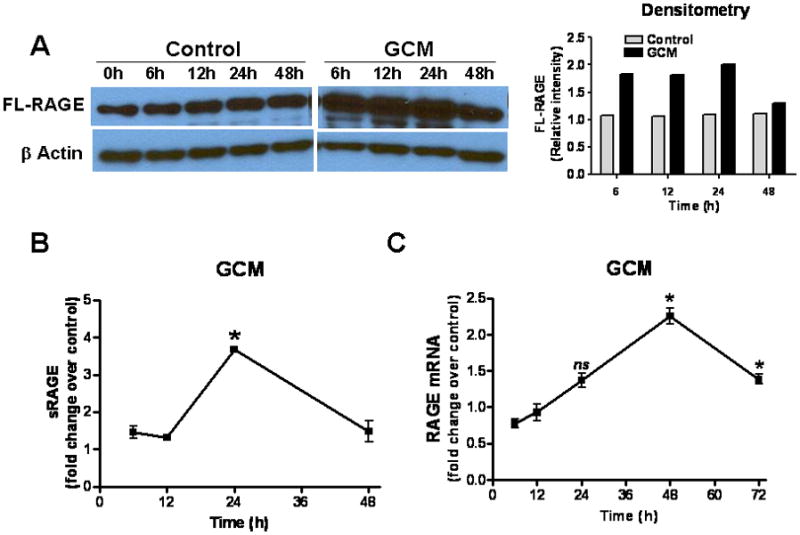
Glioma factors upregulate RAGE in microglia (MG). N9 MG (2 × 10⁵ cells/well) were cultured in regular medium (control) or GL261 glioma-conditioned medium (GCM) in six-well plates. At various time points, cells or culture supernatant were harvested for (A) Western blotting to measure full-length (FL) RAGE, (B) ELISA to quantify secreted RAGE (sRAGE), and (C) RT-PCR to evaluate RAGE mRNA. Experimental results are representative of at least two separate experiments (n=3, ±SEM). * : p < 0.05, ns: not significant
RAGE expression in intracranial gliomas
To evaluate RAGE expression in vivo, GL261 cells were implanted into brains of CX3CR1GFP mice that express EGFP under control of the endogenous Cx3cr1 locus. Although in these transgenic mice EGFP is expressed in MG, MPs, and other myeloid-derived cells, our flow cytometry studies have shown that the majority (more than 70%) of EGFP-expressing cells in intracranial gliomas are MPs (CD11b+, CD45high) and MG (CD11b+, CD45low) (data not shown) based on previously described phenotype characterization (Badie and Schartner 2000). Two weeks after tumor implantation, brain slices were examined for RAGE expression. Although brains from normal mice had little RAGE activity (not shown), a marked increase in RAGE staining was noted in the peritumoral tissue in glioma-bearing mice (Fig. 2A). To further characterize cellular expression of RAGE in inflammatory cells, blood and brain tissue of normal and GL261-bearing wt mice were Percoll-separated and examined for total (intracellular and membrane-bound) RAGE by flow. Interestingly, RAGE+ CD11b+ cells were more frequent in brains (MG, MP) and blood (monocytes) of tumor-bearing mice as compared to normal mice, and in tumor environment of glioma-bearing mice (Fig. 2B and C). In fact, in intracranial gliomas, most of CD11b+ cells expressed RAGE (Fig. 2D), and these cells accounted for most of RAGE+ inflammatory cells (Fig. 2E). Although we did not evaluate RAGE expression by other stromal cells (i.e. endothelial cells and reactive astrocytes), these findings are consistent with our in vitro data and suggest that glioma factors may be responsible for upregulating RAGE in tumor-associated MG/MP. To check for potential RAGE ligands, we next evaluated the expression of S100B in this model.
Figure 2.
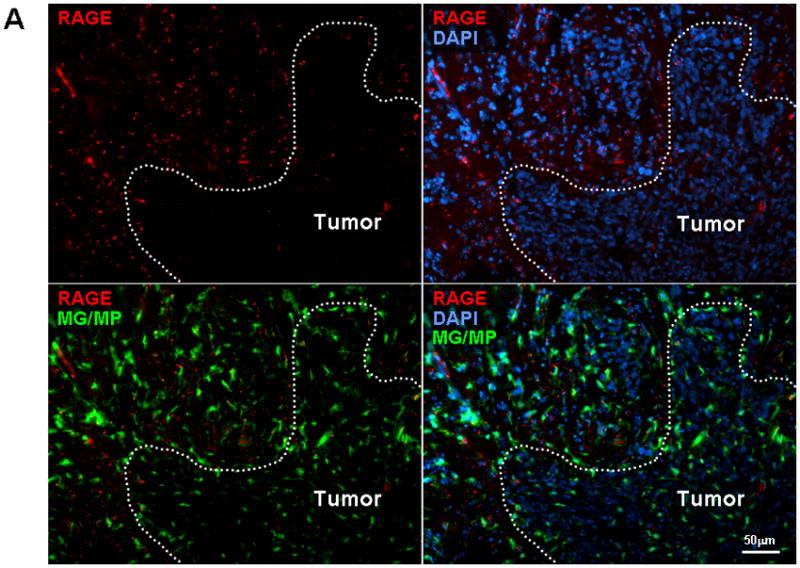
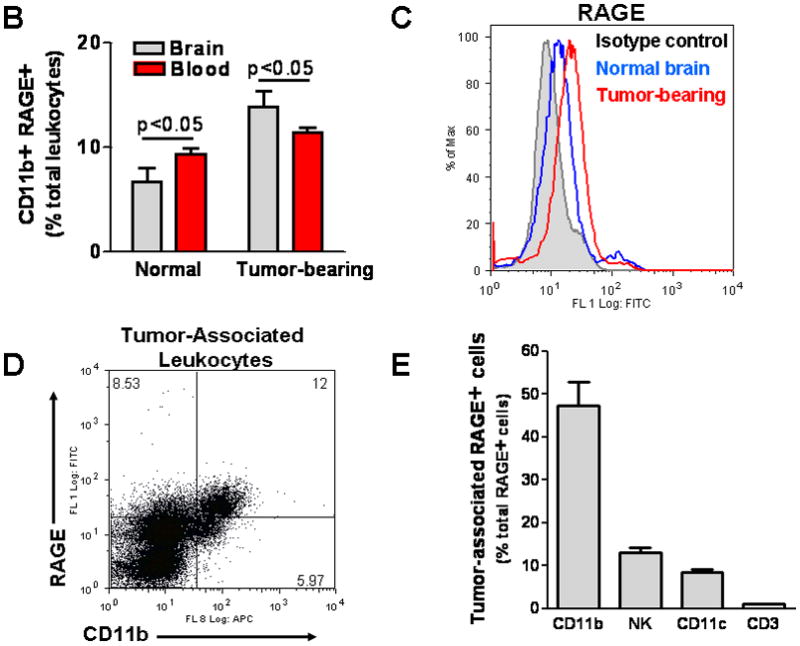
RAGE expression in intracranial gliomas. (A) Two weeks after GL261 implantation into CX3CR1GFP mice, brains were examined for RAGE expression by immunostaining. Most of the RAGE (red) was detected at the tumor periphery where microglia (MG) and macrophages (MP) were localized. (B) Flow cytometry analysis of leukocytes from blood and brains of normal and GL261-bearing mice demonstrating higher frequency of RAGE-expressing CD11b cells in tumor-bearing mice. (C) Histogram of brain tissue demonstrating upregulation of RAGE in Percoll-purified inflammatory cells associated with GL261 tumors. (D) Most of the tumor-associated CD11b+ cells expressed RAGE, and (E) MG/MPs (CD11b+) accounted for nearly half of RAGE+ cells in intracranial tumors. Experimental results are representative of two separate experiments. (n=3 mice/group, ±SEM)
S100B production by gliomas
Because S100B, a RAGE ligand, is highly expressed in gliomas, we measured the secretion of this protein by GL261 gliomas (Fig. 3A and B). S100B concentration in GCM was 0.22 ng/ml (~0.02 nM) while in N9 CM was negligible and similar to culture medium (0.02–0.05 ng/ml). Interestingly, when N9 cells were incubated with GCM, S100B production significantly increased within 48 h (Fig. 3B). To test if S100B production was also present in vivo, two week-old GL261 tumors in CX3CR1GFP mice were examined for S100B (Fig. 3C). Compared to normal brains where very little S100B staining was detected, S100B appeared both intracellularly and in the ECS of gliomas (Fig. 3C top vs. bottom panel). Interestingly, a significant number of MG/MPs were also S100B+ (Fig. 3C inset). Since S100B expression by MG/MP in brain tumors has not been described previously, we confirmed these findings with flow cytometry (Fig. 3D). While only a small fraction of circulating blood CD11b+ cells expressed S100B, nearly 90% of CD11b+ cells in GL261 tumors were S100B+, confirming the in vitro findings that MG/MP S100B expression is upregulated by gliomas.
Figure 3.
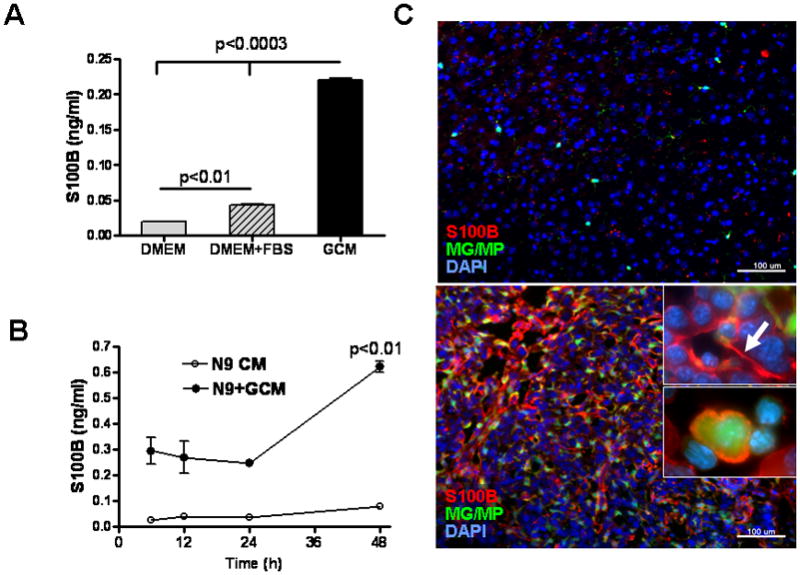
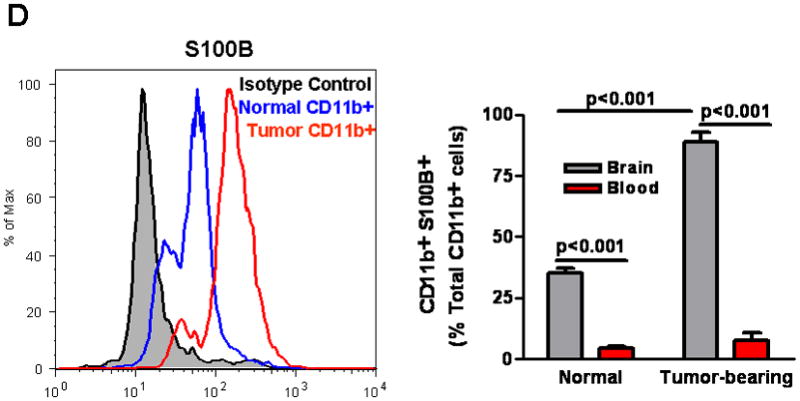
S100B production by GL261 gliomas. (A) S100B levels were measured in glioma-conditioned medium (GCM), DMEM and DMEM+FBS by ELISA. (B) S100B secretion by N9 cells (N9 CM) significantly increased at 48 hr when these cells were incubated with GCM (N9+GCM). (C) Immunostaining demonstrating S100B expression in intracranial GL261 gliomas. Two weeks after intracranial tumor implantation into CX3CR1GFP mice, brains were examined for S100B. Although little S100B was detected in normal brains (top panel), S100B staining (red, bottom panel) appeared both intracellularly and in the extracellular space (top inset, arrow) of tumors. A significant number of tumor-infiltrating microglia and macrophages (MG/MP, green cells) were also S100B-positive (bottom inset). (D) Flow cytometry analysis of S100B+ cells in normal and GL261-bearing mice. Left: Histogram of Percoll-purified brain tissue demonstrating upregulation of S100B by CD11b+ cells in tumors. Right: While only a small fraction of circulating blood CD11b+ cells in normal and glioma-bearing mice expressed S100B, nearly 90% of CD11b+ cells were S100B in GL261 tumors that were propagated in wt mice. Experimental results are representative of two separate experiments. (n=3 samples or mice/group, ±SEM)
Low levels of S100B stimulate RAGE expression
To confirm RAGE engagement by S100B in our model, N9 MG and BMM were exposed to S100B, and RAGE expression examined using the methods described above. Similar to GCM, S100B upregulated FL-RAGE protein and mRNA expression even at very low concentrations (Fig. 4A, B, and C). But at higher concentrations, S100B also increased sRAGE release by N9 cells (Fig. 4D).
Figure 4.
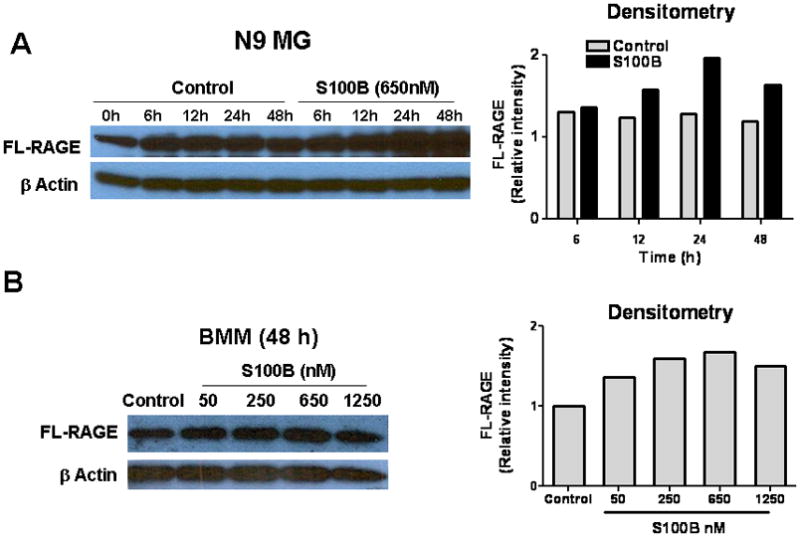
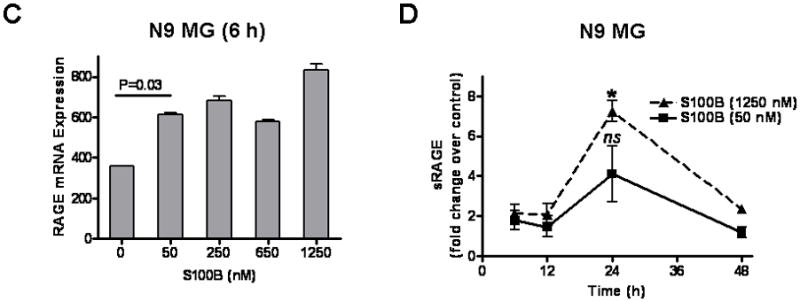
S100B stimulates RAGE expression in N9 microglia (MG) and bone marrow-derived monocytes (BMM). Cells (2 × 10⁵ cells/well) were cultured in regular medium (control) or S100B in six-well plates. At various time points, cells and culture supernatant were harvested for (A, B) Western blotting to measure full-length (FL) RAGE, (C) RT-PCR to evaluate RAGE mRNA, and (D) ELISA to quantify secreted RAGE (sRAGE). Experimental results are representative of at least two separate experiments. (n=3 to 4 samples/group, ±SEM) * : p < 0.05.
GCM and S100B inhibit MAPK activation and suppress MG cytokine expression
Because S100B has been shown to activate MAPK pathway through RAGE engagement (Bianchi et al. 2010) we next measured levels of p38 and p42 phosphorylation activity in N9 cells. Interestingly, both GCM and low levels of S100B decreased p38, phosph-p38, p42, and phosph-p42, suggesting suppression of N9 cells (Fig. 5A). To confirm this unexpected finding, we next measured the expression of TNF-α and IL-1β, pro-inflammatory cytokines that are regulated by S100B-RAGE interaction and MAPK pathway (Bianchi et al. 2010; Kim et al. 2004). GCM and low doses of S100B inhibited N9 baseline TNF-α (Fig. 5B), and IL-1β expression both at baseline and following stimulation with LPS (Fig. 5C). Similar observations were made in BMM where both GCM and low-dose S100B (50 nM) inhibited IL-1β expression (Fig. 5D). Furthermore, when S100B was separated from GCM, IL-1β inhibition was partially reversed, confirming that GCM-mediated MG/MP suppression may be in part due to S100B (Fig. 5D).
Figure 5.
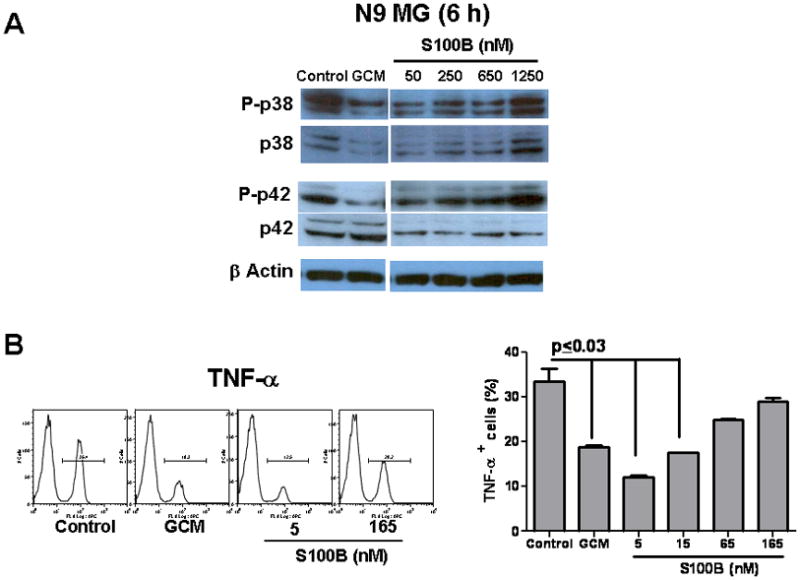
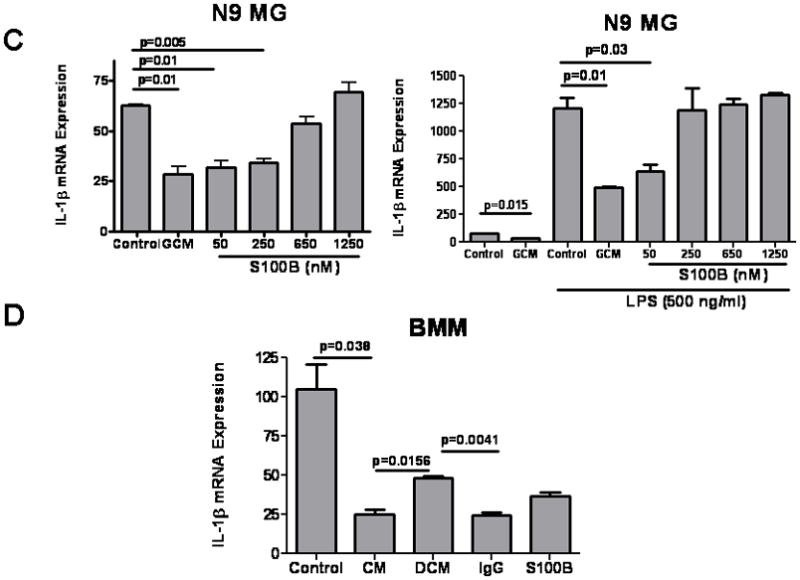
Glioma-conditioned medium (GCM) and S100B suppressed microglia (MG) and bone marrow-derived monocytes (BMM). N9 MG or BMM (0.2 × 10⁶ cells/well) were incubated in regular medium (control), GCM, or different doses of S100B for 6–48 h. (A) Western blots demonstrating inhibition of p38 and p42 by GCM and low levels of S100B. (B) FACS analysis demonstrating inhibition of TNF-α expression by N9 cells after a 24-h incubation with GCM or S100B. (C) RT-PCR demonstrating inhibition of IL-1β expression by GCM and low levels of S100B at baseline (left) and following stimulation with LPS for 12 h (right). (D) GCM and low-dose S100B (50 nM) inhibited IL-1β expression by BMM. IL-1β inhibition was partially reversed when S100B was depleted from GCM (DCM) by S100B Abs but not control IgG. Experimental results are representative of at least two separate experiments. (n=3 to 4 samples/group, ±SEM)
Low levels of S100B induces STAT3 in MG
We recently showed that gliomas can activate STAT3 in MG and induce upregulation of downstream anti-inflammatory cytokines such L-10 and IL-6 while inhibiting IL-1β (Zhang et al. 2009). Because high doses of S100B can activate STAT3 through the Src kinase (Reddy et al. 2006), we evaluated the expression of STAT3 in N9 MG in response to S100B. Similar to GCM, both STAT3 expression (Fig. 6A) and STAT3 phosphorylation (Fig. 6B and C) increased after exposure of N9 cells to low concentrations of S100B. Although higher doses of S100B (i.e. >1μM) also increased STAT3 transcription, it did not raise STAT3 protein levels, and its induction of pSTAT3 was more modest (Fig. 6A and B). This suggested that low levels of S100B present in glioma microenvironment may modulate MG/MP inflammatory response through activation of STAT3 pathway. To confirm this, BMM from Stat3−/− and corresponding control mice were incubated with S100B. As predicted, S100B-mediated IL-1β suppression was not seen in Stat3−/− cells, confirming that the suppressive activity of low-dose S100B may be mediated through STAT3 pathway (Fig. 6D).
Figure 6.
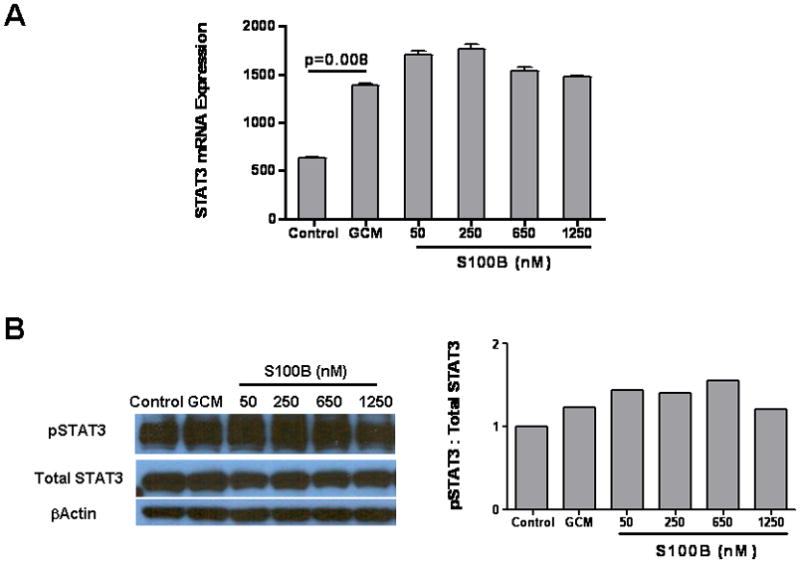
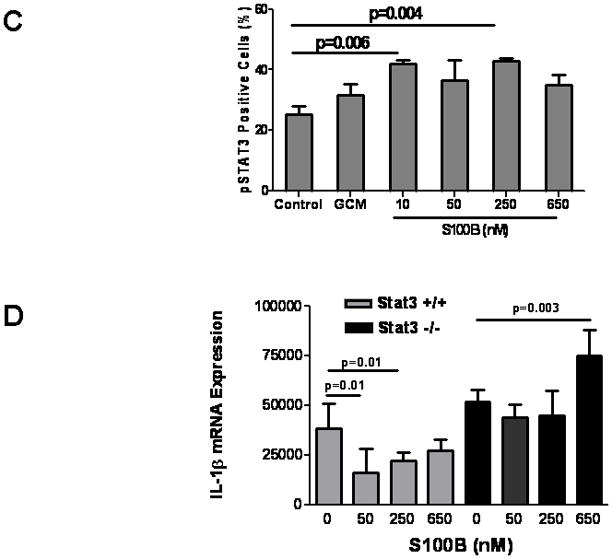
S100B suppression is mediated through STAT3. (A–C) Glioma-conditioned medium (GCM) and low levels of S100B induce STAT3 expression and phosphorylation in microglia. N9 cells were treated with GCM and different doses of S100B as indicated. Samples were collected at 6 h and analyzed for STAT3 activity by RT-PCR (A), Western blotting (B), and FACS (C). (D) S100B suppression was not seen in STAT3-deficient cells. Bone marrow-derived monocytes from Stat3−/− and corresponding control mice were incubated with S100B for 24 h prior to IL-1β RT-PCR. Experimental results are representative of two to three separate experiments. (n=3 samples/group, ±SEM)
Blockage of RAGE inhibits STAT3 activity
To confirm the role of STAT3 pathway in S100B-mediated MG/MP immune modulation, we inhibited S100B-RAGE engagement with blocking Ab (αRAGE). RAGE blockage partially suppressed STAT3 (Fig. 7A) and inhibited its transcriptional activity as evident by DNA binding assay (Fig. 7B) and inhibition of IL-10 expression (Fig. 7C). In contrast, pSTAT3 suppression by control IgG, which has been shown to occur through engagement of Fc receptors on MPs (Ji et al. 2003), was not as pronounced as αRAGE (Fig. 7A) suggesting that glioma-mediated STAT3 activation in MG/MP may be in part regulated through the RAGE pathway. Similar observations were made in vivo. Mice bearing two-week old GL261 gliomas in wt or CX3CR1GFP mice were treated with αRAGE and levels of pSTAT3 in tumor MG/MPs were examined by flow cytometry and immunostaining (Fig. 8A, B, and C). Consistent with the in vitro data, these experiments confirmed partial inhibition of pSTAT3 expression by αRAGE.
Figure 7.
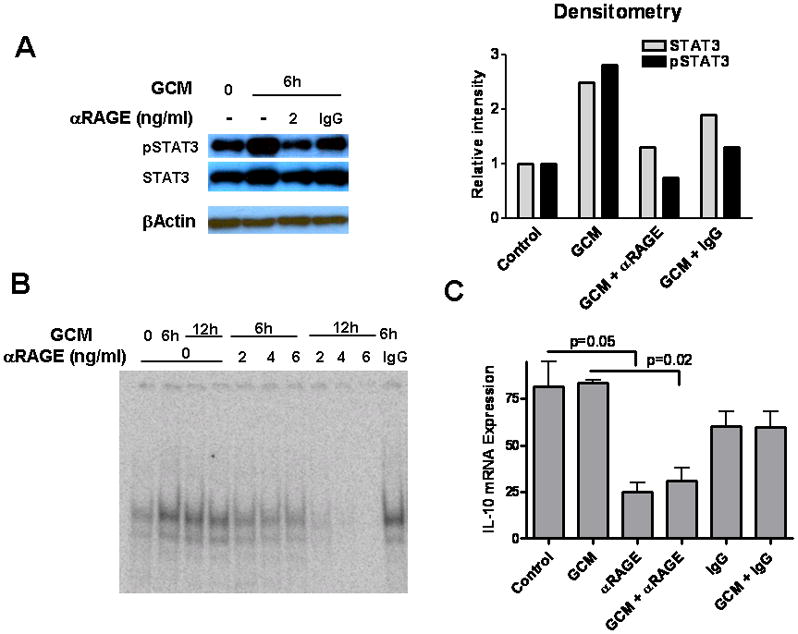
Blockage of RAGE inhibits glioma-induced STAT3 activation in N9 microglia (MG). (A) Western blot demonstrating an increase in STAT3 phosphorylation and expression in N9 MG 6 h after incubation with GL261 glioma-conditioned medium (GCM). Anti-RAGE blocking antibody (αRAGE) reversed STAT3 activation. (B) EMSA demonstrating an increase in STAT3 DNA binding following incubation of N9 cells with GCM. αRAGE inhibited glioma-induced STAT3 activation in N9 MG. (C) STAT3 transcription activity was examined by IL-10 RT-PCR 6 h after incubation of N9 cells with GCM. IL-10 expression was inhibited by αRAGE but not IgG. Experimental results are representative of two separate experiments. (n=3 samples/group, ±SEM)
Figure 8.
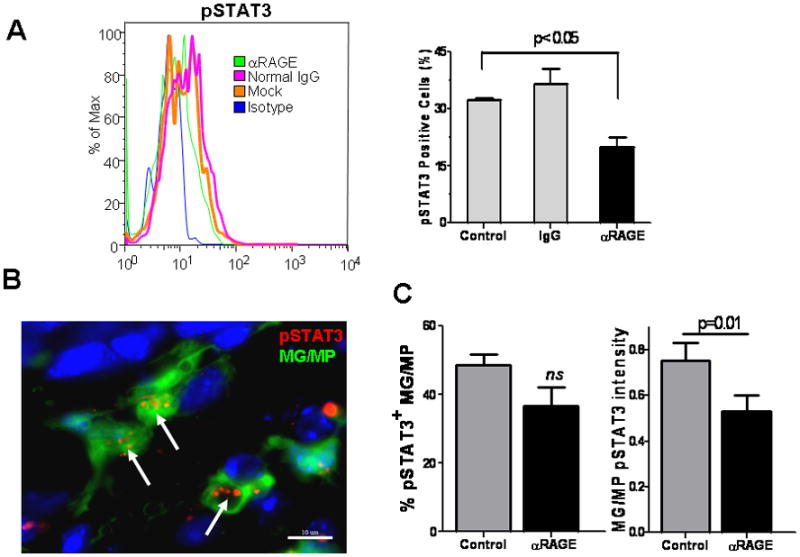
RAGE blockage inhibits STAT3 activation in glioma-associated microglia (MG) and macrophages (MPs). Mice bearing GL261 intracranial tumors were given two intravenous injections of phosphate-buffered saline (control), anti-RAGE blocking antibody (αRAGE; 100μg), or control IgG (100μg) on days 14 and 16 after tumor implantation. Twenty four h after the last injection, brain samples were harvested, MG/MP cell populations (CD11b+) separated by Percoll, and examined for pSTAT3 by FACS analysis (A). Representative histogram (left) and mean ±SE (right) of two separate experiments is shown (n=4 mice/group). In a similar experiment, brains of GL261-bearing CX3CR1GFP mice were sectioned for pSTAT3 immunostaining (B, C). pSTAT3 activity (arrows) was measured by calculating the frequency (number of pSTAT3+ MG./MP, green cells), or the intensity (number of red particles per MG/MP, arrows) in 50 randomly-selected peritumoral fields (n=2 mice/group).
Discussion
MG and MP accumulation occurs in a number of CNS disease processes such as infection, trauma, and neoplasia (Hanisch and Kettenmann 2007). Our group and others have shown that soluble factors released by glioma cells can induce tolerance of MG through immunosuppressive signaling pathways including STAT3 activation (Hussain et al. 2007; Kostianovsky et al. 2008; Zhang et al. 2009). Here, we demonstrate that S100B, which is constitutively expressed by most astrocytomas, may yet be another factor that activates STAT3. These findings imply that S100B-RAGE interaction could contribute to local tumor immunosuppression through MG/MP inactivation. This observation was unexpected as S100B has been shown to be a MG/MP stimulant (Bianchi et al. 2010; Shanmugam et al. 2003).
At high μM doses, S100B upregulates the expression of inflammatory mediators such as iNOS and cyclo-oxygenase (COX)-2 (Adami et al. 2001; Bianchi et al. 2007) and stimulates the production of IL-1β and TNF-α in MG cultures (Bianchi et al. 2010). In contrast, low doses of S100B (nM range) has been shown to block the activating effects of the neurotoxin, trimethyltin, on MG and astrocytes (Reali et al. 2005). Consistent with this report, we observed that physiologic levels of S100B suppressed MG in vitro as reflected by inhibition of TNF-α, IL-1β, p38 MAPK and ERK1/2 expression. Although extracellular fluid levels of S100B have not been measured in brain tumors, clinical studies have reported brain S100B levels to reach 20–40 ng/ml (~ 2–4 nM) in patients with CNS trauma (Sen et al. 2005). Thus, S100B levels studied here may be very close to concentrations expected in the tumor microenvironment and much lower than μM levels associated with MG activation. How S100B inhibited MG/MP at these low concentrations is unclear, but our data suggests involvement of the STAT3 pathway.
Recent studies have suggested a critical role for STAT3 signaling in immune activation and tolerance (Kortylewski et al. 2005; Wang et al. 2004; Yu et al. 2007). Inhibition of STAT3 in tumor cells increases expression of pro-inflammatory cytokines that activate innate immune responses in dendritic cells and result in antitumor T-cell responses (Wang et al. 2004). Furthermore, tumor-secreted factors, such as vascular endothelial growth factor, IL-6, and IL-10, can activate STAT3 in dendritic cells, resulting in their impaired maturation, suppressed antigen-specific T-cell responses, and tumor immune evasion (Cheng et al. 2003). Although STAT3 signaling in oncogenesis is well studied, the exact mechanism by which gliomas induce STAT3 activation in MG and MPs is not yet known. Here, we demonstrated that low-dose S100B activated STAT3 and suppressed MG and BMM in vitro. While higher concentrations of S100B (i.e. >1μM) also increased STAT3 expression, its induction of pSTAT3 was more modest, and it had no inhibitory effect on MG. The dose-dependency mechanism of S100B suppression of MG is unclear but may be due to differential activation of STAT3 feedback regulatory pathways. It’s possible that higher concentrations of S100B may have resulted in more robust activation of SOCS3, which has been shown to inhibit STAT3 function (Alexander and Hilton 2004; Fasshauer et al. 2004). Nevertheless, the findings that S100B-mediated IL-1β inhibition was not seen in STAT3-deficient BMM, and blockage of RAGE (the primary S100B receptor) suppressed STAT3 in MG in vitro and tumor MG/MPs in vivo, emphasize the role of S100B-RAGE interaction as a potential STAT3-dependent suppressive pathway in glioma MG/MP.
Whereas RAGE is constitutively expressed during embryonic development, its expression is downregulated in adult life, except in skin and lung where high levels are expressed. Most other cells, including monocytes/MPs, endothelial cells, fibroblasts and neurons do not express significant RAGE levels under physiological conditions but can be induced to express RAGE either when ligands accumulate or when transcription factors regulating RAGE are activated (Bierhaus et al. 2005). In conditions such as diabetes mellitus and arthritis, expression of RAGE on MPs is important in their trafficking and in mediating chronic inflammation (Rouhiainen et al. 2004). In our glioma model, RAGE was expressed by most tumor-infiltrating MG/MPs indicating presence of RAGE ligands in tumor environment. Although our results suggest S100B to be responsible for RAGE upregulation, we did not evaluate the presence of other ligands in this tumor model.
In addition to S100B, RAGE interacts with other structurally unrelated ligands such as advanced glycation end products (AGEs) and High Mobility Group Box 1 (HMGB1). AGEs are nonenzymatically glycated or oxidated proteins, lipids, and nucleic acids formed in the environment of oxidant stress and hyperglycemia (Bierhaus et al. 2005; Herold et al. 2007). These patterned ligands interact with RAGE and initiate cellular signaling programs leading to chronic inflammation. HMGB1, another RAGE ligand and a nuclear protein that can be released by necrotic cells, has also been shown to be secreted by gliomas in vitro (Bassi et al. 2008; Fages et al. 2000). Although levels of these ligands were not measured in our model, it’s possible that these factors, and not S100B, may have been the principal activators of RAGE in tumor MG/MP. If so, then the inhibitory effects of GCM and low-dose S100B may have been mediated through blockage of RAGE interaction with these stimulatory ligands that share the same receptor with S100B. This could have occurred either through competitive binding of S100B with RAGE, or, by upregulation and release of other RAGE isoforms (such as sRAGE) that could potentially bind and neutralize “stimulatory” RAGE ligands. These potential inhibitory mechanisms are indirectly supported by two observations: 1) Despite an increase in RAGE expression by MG, both GCM and low-dose S100B inhibited p38 and p42 MAPK, suggesting a decrease in baseline RAGE transduction activity, and 2) S100B (at low μM levels) increased sRAGE release in vitro. The role of other RAGE ligands or isoforms in S100B-mediated STAT3 activation will be examined in future studies.
In addition to S100B, other S100 proteins have been shown to modulate MG and MP function in gliomas. For example, proinflammatory S100A8/A9 heterodimers that are released by cells of myeloid origin have been shown to promote the migration and retention of MDSCs in tumors (Sinha et al. 2008). Although not expressed by glial cells, S100A8/A9 can be detected in glioma-infiltrating MG and MPs following therapy (Deininger et al. 2001). To our knowledge, expression of S100B by MG and MP has not been reported yet. Our findings indicate that in glioma microenvironment, S100B expression by tumor MG/MP can increase, and can potentially suppress MG/MP through STAT3 induction in an autocrine fashion. The relative contribution of endogenous S100B (and other S100 proteins) against exogenous factors to tumor MG/MP activation, however, was not examined here and needs further investigation.
In summary, we demonstrated that glioma-mediated activation of STAT3 in MG/MP may partly occur through the RAGE pathway. Furthermore, low levels of S100B, a RAGE ligand that is expressed by gliomas, induced STAT3 and inhibited MG activation. These findings suggest that S100B-RAGE interaction may play an important role in STAT3 activation and MG/MP suppression in gliomas. Future studies will address the role of other RAGE ligands and S100B receptors on MG/MP immune function in gliomas and test if manipulation of this interaction will potentiate immunotherapy approaches against malignant brain tumors.
Acknowledgments
This work was supported by James S. McDonnell Foundation, NIH (R21CA131765-01A2), and ThinkCure Foundation (to BB). The City of Hope Flow Cytometry Core was equipped in part through funding provided by ONR N00014-02-1 0958, DOD 1435-04-03GT-73134, and NSF DBI-9970143.
Abbreviations used in this paper
- AGE
Advanced Glycation end Products
- CNS
Central nervous system
- GCM
Glioma condition medium
- ECS
Extracellular space
- FBS
Fetal bovine serum
- FL-RAGE
Full-length RAGE
- GCM
GL261 condition medium
- HMGB1
High mobility group box 1
- MDSC
myeloid-derived suppressor cell
- MG
Microglia
- MP
Macrophage
- RAGE
Receptor for advanced glycation end products
- sRAGE
soluble RAGE
References
- Adami C, Sorci G, Blasi E, Agneletti AL, Bistoni F, Donato R. S100B expression in and effects on microglia. Glia. 2001;33(2):131–42. [PubMed] [Google Scholar]
- Alexander WS, Hilton DJ. The role of suppressors of cytokine signaling (SOCS) proteins in regulation of the immune response. Annu Rev Immunol. 2004;22:503–29. doi: 10.1146/annurev.immunol.22.091003.090312. [DOI] [PubMed] [Google Scholar]
- Arcuri C, Bianchi R, Brozzi F, Donato R. S100B Increases Proliferation in PC12 Neuronal Cells and Reduces Their Responsiveness to Nerve Growth Factor via Akt Activation. Journal of Biological Chemistry. 2005;280(6):4402–4414. doi: 10.1074/jbc.M406440200. [DOI] [PubMed] [Google Scholar]
- Badie B, Schartner JM. Flow cytometric characterization of tumor-associated macrophages in experimental gliomas. Neurosurgery. 2000;46(4):957–61. doi: 10.1097/00006123-200004000-00035. discussion 961–2. [DOI] [PubMed] [Google Scholar]
- Bassi R, Giussani P, Anelli V, Colleoni T, Pedrazzi M, Patrone M, Viani P, Sparatore B, Melloni E, Riboni L. HMGB1 as an autocrine stimulus in human T98G glioblastoma cells: role in cell growth and migration. J Neurooncol. 2008;87(1):23–33. doi: 10.1007/s11060-007-9488-y. [DOI] [PubMed] [Google Scholar]
- Beauchamp MC, Michaud SE, Li L, Sartippour MR, Renier G. Advanced glycation end products potentiate the stimulatory effect of glucose on macrophage lipoprotein lipase expression. J Lipid Res. 2004;45(9):1749–57. doi: 10.1194/jlr.M400169-JLR200. [DOI] [PubMed] [Google Scholar]
- Bianchi R, Adami C, Giambanco I, Donato R. S100B binding to RAGE in microglia stimulates COX-2 expression. J Leukoc Biol. 2007;81(1):108–18. doi: 10.1189/jlb.0306198. [DOI] [PubMed] [Google Scholar]
- Bianchi R, Giambanco I, Donato R. S100B/RAGE-dependent activation of microglia via NF-kappaB and AP-1 Co-regulation of COX-2 expression by S100B, IL-1beta and TNF-alpha. Neurobiol Aging. 2010;31(4):665–77. doi: 10.1016/j.neurobiolaging.2008.05.017. [DOI] [PubMed] [Google Scholar]
- Bierhaus A, Humpert PM, Morcos M, Wendt T, Chavakis T, Arnold B, Stern DM, Nawroth PP. Understanding RAGE, the receptor for advanced glycation end products. J Mol Med. 2005;83(11):876–86. doi: 10.1007/s00109-005-0688-7. [DOI] [PubMed] [Google Scholar]
- Brozzi F, Arcuri C, Giambanco I, Donato R. S100B Protein Regulates Astrocyte Shape and Migration via Interaction with Src Kinase: IMPLICATIONS FOR ASTROCYTE DEVELOPMENT, ACTIVATION, AND TUMOR GROWTH. J Biol Chem. 2009;284(13):8797–811. doi: 10.1074/jbc.M805897200. [DOI] [PMC free article] [PubMed] [Google Scholar]
- Cheng F, Wang HW, Cuenca A, Huang M, Ghansah T, Brayer J, Kerr WG, Takeda K, Akira S, Schoenberger SP, Yu H, Jove R, Sotomayor EM. A critical role for Stat3 signaling in immune tolerance. Immunity. 2003;19(3):425–36. doi: 10.1016/s1074-7613(03)00232-2. [DOI] [PubMed] [Google Scholar]
- Davey GE, Murmann P, Heizmann CW. Intracellular Ca2+ and Zn2+ levels regulate the alternative cell density-dependent secretion of S100B in human glioblastoma cells. J Biol Chem. 2001;276(33):30819–26. doi: 10.1074/jbc.M103541200. [DOI] [PubMed] [Google Scholar]
- Deininger MH, Pater S, Strik H, Meyermann R. Macrophage/microglial cell subpopulations in glioblastoma multiforme relapses are differentially altered by radiochemotherapy. J Neurooncol. 2001;55(3):141–7. doi: 10.1023/a:1013805915224. [DOI] [PubMed] [Google Scholar]
- Donato R. RAGE: A Single Receptor for Several Ligands and Different Cellular Responses: The Case of Certain S100 Proteins. Current Molecular Medicine. 2007;7:711–724. doi: 10.2174/156652407783220688. [DOI] [PubMed] [Google Scholar]
- Donato R, Sorci G, Riuzzi F, Arcuri C, Bianchi R, Brozzi F, Tubaro C, Giambanco I. S100B’s double life: intracellular regulator and extracellular signal. Biochim Biophys Acta. 2009;1793(6):1008–22. doi: 10.1016/j.bbamcr.2008.11.009. [DOI] [PubMed] [Google Scholar]
- Du R, Lu KV, Petritsch C, Liu P, Ganss R, Passegue E, Song H, Vandenberg S, Johnson RS, Werb Z, Bergers G. HIF1alpha induces the recruitment of bone marrow-derived vascular modulatory cells to regulate tumor angiogenesis and invasion. Cancer Cell. 2008;13(3):206–20. doi: 10.1016/j.ccr.2008.01.034. [DOI] [PMC free article] [PubMed] [Google Scholar]
- Edwards MM, Robinson SR. TNF alpha affects the expression of GFAP and S100B: implications for Alzheimer’s disease. Journal of Neural Transmission. 2006;113(11):1709–1715. doi: 10.1007/s00702-006-0479-5. [DOI] [PubMed] [Google Scholar]
- Fages C, Nolo R, Huttunen HJ, Eskelinen E, Rauvala H. Regulation of cell migration by amphoterin. J Cell Sci. 2000;113 (Pt 4):611–20. doi: 10.1242/jcs.113.4.611. [DOI] [PubMed] [Google Scholar]
- Fasshauer M, Kralisch S, Klier M, Lossner U, Bluher M, Klein J, Paschke R. Insulin resistance-inducing cytokines differentially regulate SOCS mRNA expression via growth factor- and Jak/Stat-signaling pathways in 3T3-L1 adipocytes. J Endocrinol. 2004;181(1):129–38. doi: 10.1677/joe.0.1810129. [DOI] [PubMed] [Google Scholar]
- Gabrilovich DI, Nagaraj S. Myeloid-derived suppressor cells as regulators of the immune system. Nat Rev Immunol. 2009;9(3):162–74. doi: 10.1038/nri2506. [DOI] [PMC free article] [PubMed] [Google Scholar]
- Galea I, Bechmann I, Perry VH. What is immune privilege (not)? Trends Immunol. 2007;28:12–18. doi: 10.1016/j.it.2006.11.004. [DOI] [PubMed] [Google Scholar]
- Hanisch UK, Kettenmann H. Microglia: active sensor and versatile effector cells in the normal and pathologic brain. Nat Neurosci. 2007;10(11):1387–94. doi: 10.1038/nn1997. [DOI] [PubMed] [Google Scholar]
- Hauschild A, Engel G, Brenner W, Glaser R, Monig H, Henze E, Christophers E. S100B protein detection in serum is a significant prognostic factor in metastatic melanoma. Oncology. 1999;56(4):338–44. doi: 10.1159/000011989. [DOI] [PubMed] [Google Scholar]
- Herold K, Moser B, Chen Y, Zeng S, Yan SF, Ramasamy R, Emond J, Clynes R, Schmidt AM. Receptor for advanced glycation end products (RAGE) in a dash to the rescue: inflammatory signals gone awry in the primal response to stress. J Leukoc Biol. 2007;82(2):204–12. doi: 10.1189/jlb.1206751. [DOI] [PubMed] [Google Scholar]
- Hu J, Van Eldik LJ. S100Î2 induces apoptotic cell death in cultured astrocytes via a nitric oxide-dependent pathway. Biochimica et Biophysica Acta - Molecular Cell Research. 1996;1313(3):239–245. doi: 10.1016/0167-4889(96)00095-x. [DOI] [PubMed] [Google Scholar]
- Hu J, Van Eldik LJ. Glial-derived proteins activate cultured astrocytes and enhance beta amyloid-induced glial activation. Brain Res. 1999;842(1):46–54. doi: 10.1016/s0006-8993(99)01804-1. [DOI] [PubMed] [Google Scholar]
- Hussain SF, Kong LY, Jordan J, Conrad C, Madden T, Fokt I, Priebe W, Heimberger AB. A novel small molecule inhibitor of signal transducers and activators of transcription 3 reverses immune tolerance in malignant glioma patients. Cancer Res. 2007;67(20):9630–6. doi: 10.1158/0008-5472.CAN-07-1243. [DOI] [PubMed] [Google Scholar]
- Ji JD, Tassiulas I, Park-Min KH, Aydin A, Mecklenbrauker I, Tarakhovsky A, Pricop L, Salmon JE, Ivashkiv LB. Inhibition of interleukin 10 signaling after Fc receptor ligation and during rheumatoid arthritis. J Exp Med. 2003;197(11):1573–83. doi: 10.1084/jem.20021820. [DOI] [PMC free article] [PubMed] [Google Scholar]
- Joseph M, Alexander DM, David JW. A Search for Inhibitors of S100B, a Member of the S100 Family of Calcium-Binding Proteins. Mini Reviews in Medicinal Chemistry. 2007;7:609–616. doi: 10.2174/138955707780859422. [DOI] [PubMed] [Google Scholar]
- Kim SH, Smith CJ, Van Eldik LJ. Importance of MAPK pathways for microglial pro-inflammatory cytokine IL-1 beta production. Neurobiol Aging. 2004;25(4):431–9. doi: 10.1016/S0197-4580(03)00126-X. [DOI] [PubMed] [Google Scholar]
- Kortylewski M, Kujawski M, Wang T, Wei S, Zhang S, Pilon-Thomas S, Niu G, Kay H, Mule J, Kerr WG, Jove R, Pardoll D, Yu H. Inhibiting Stat3 signaling in the hematopoietic system elicits multicomponent antitumor immunity. Nat Med. 2005;11(12):1314–21. doi: 10.1038/nm1325. [DOI] [PubMed] [Google Scholar]
- Kortylewski M, Xin H, Kujawski M, Lee H, Liu Y, Harris T, Drake C, Pardoll D, Yu H. Regulation of the IL-23 and IL-12 balance by Stat3 signaling in the tumor microenvironment. Cancer Cell. 2009;15(2):114–23. doi: 10.1016/j.ccr.2008.12.018. [DOI] [PMC free article] [PubMed] [Google Scholar]
- Kostianovsky AM, Maier LM, Anderson RC, Bruce JN, Anderson DE. Astrocytic regulation of human monocytic/microglial activation. J Immunol. 2008;181(8):5425–32. doi: 10.4049/jimmunol.181.8.5425. [DOI] [PubMed] [Google Scholar]
- Lam AG, Koppal T, Akama KT, Guo L, Craft JM, Samy B, Schavocky JP, Watterson DM, Van Eldik LJ. Mechanism of glial activation by S100B: involvement of the transcription factor NFkappaB. Neurobiol Aging. 2001;22(5):765–72. doi: 10.1016/s0197-4580(01)00233-0. [DOI] [PubMed] [Google Scholar]
- Lin J, Yang Q, Yan Z, Markowitz J, Wilder PT, Carrier F, Weber DJ. Inhibiting S100B Restores p53 Levels in Primary Malignant Melanoma Cancer Cells. Journal of Biological Chemistry. 2004;279(32):34071–34077. doi: 10.1074/jbc.M405419200. [DOI] [PubMed] [Google Scholar]
- Markovic DS, Glass R, Synowitz M, Rooijen N, Kettenmann H. Microglia stimulate the invasiveness of glioma cells by increasing the activity of metalloprotease-2. J Neuropathol Exp Neurol. 2005;64(9):754–62. doi: 10.1097/01.jnen.0000178445.33972.a9. [DOI] [PubMed] [Google Scholar]
- Millward TA, Heizmann CW, Schafer BW, Hemmings BA. Calcium regulation of Ndr protein kinase mediated by S100 calcium-binding proteins. EMBO J. 1998;17(20):5913–5922. doi: 10.1093/emboj/17.20.5913. [DOI] [PMC free article] [PubMed] [Google Scholar]
- Mrak RE, Griffin WST. Trisomy 21 and the brain. Journal of Neuropathology and Experimental Neurology. 2004;63(7):679–685. doi: 10.1093/jnen/63.7.679. [DOI] [PMC free article] [PubMed] [Google Scholar]
- Muldoon LL, Soussain C, Jahnke K, Johanson C, Siegal T, Smith QR, Hall WA, Hynynen K, Senter PD, Peereboom DM, Neuwelt EA. Chemotherapy delivery issues in central nervous system malignancy: a reality check. J Clin Oncol. 2007;25(16):2295–305. doi: 10.1200/JCO.2006.09.9861. [DOI] [PubMed] [Google Scholar]
- Okada H, Kohanbash G, Zhu X, Kastenhuber ER, Hoji A, Ueda R, Fujita M. Immunotherapeutic approaches for glioma. Crit Rev Immunol. 2009;29(1):1–42. doi: 10.1615/critrevimmunol.v29.i1.10. [DOI] [PMC free article] [PubMed] [Google Scholar]
- Pinto SS, Gottfried C, Mendez A, Goncalves D, Karl J, Goncalves CA, Wofchuk S, Rodnight R. Immunocontent and secretion of S100B in astrocyte cultures from different brain regions in relation to morphology. FEBS Letters. 2000;486(3):203–207. doi: 10.1016/s0014-5793(00)02301-2. [DOI] [PubMed] [Google Scholar]
- Ponath G, Schettler C, Kaestner F, Voigt B, Wentker D, Arolt V, Rothermundt M. Autocrine S100B effects on astrocytes are mediated via RAGE. Journal of Neuroimmunology. 2007;184(1–2):214–222. doi: 10.1016/j.jneuroim.2006.12.011. [DOI] [PubMed] [Google Scholar]
- Reali C, Scintu F, Pillai R, Donato R, Michetti F, Sogos V. S100b counteracts effects of the neurotoxicant trimethyltin on astrocytes and microglia. J Neurosci Res. 2005;81(5):677–86. doi: 10.1002/jnr.20584. [DOI] [PubMed] [Google Scholar]
- Reddy MA, Li S-L, Sahar S, Kim Y-S, Xu Z-G, Lanting L, Natarajan R. Key Role of Src Kinase in S100B-induced Activation of the Receptor for Advanced Glycation End Products in Vascular Smooth Muscle Cells. Journal of Biological Chemistry. 2006;281(19):13685–13693. doi: 10.1074/jbc.M511425200. [DOI] [PubMed] [Google Scholar]
- Rouhiainen A, Kuja-Panula J, Wilkman E, Pakkanen J, Stenfors J, Tuominen RK, Lepantalo M, Carpen O, Parkkinen J, Rauvala H. Regulation of monocyte migration by amphoterin (HMGB1) Blood. 2004;104(4):1174–82. doi: 10.1182/blood-2003-10-3536. [DOI] [PubMed] [Google Scholar]
- Rustandi RR, Baldisseri DM, Weber DJ. Structure of the negative regulatory domain of p53 bound to S100B(betabeta) Nat Struct Biol. 2000;7(7):570–4. doi: 10.1038/76797. [DOI] [PubMed] [Google Scholar]
- Selinfreund RH, Barger SW, Pledger WJ, Van Eldik LJ. Neurotrophic protein S100 beta stimulates glial cell proliferation. Proceedings of the National Academy of Sciences of the United States of America. 1991;88(9):3554–3558. doi: 10.1073/pnas.88.9.3554. [DOI] [PMC free article] [PubMed] [Google Scholar]
- Sen J, Belli A, Petzold A, Russo S, Keir G, Thompson EJ, Smith M, Kitchen N. Extracellular fluid S100B in the injured brain: a future surrogate marker of acute brain injury? Acta Neurochir (Wien) 2005;147(8):897–900. doi: 10.1007/s00701-005-0526-2. [DOI] [PubMed] [Google Scholar]
- Shanmugam N, Kim YS, Lanting L, Natarajan R. Regulation of cyclooxygenase-2 expression in monocytes by ligation of the receptor for advanced glycation end products. J Biol Chem. 2003;278(37):34834–44. doi: 10.1074/jbc.M302828200. [DOI] [PubMed] [Google Scholar]
- Sinha P, Okoro C, Foell D, Freeze HH, Ostrand-Rosenberg S, Srikrishna G. Proinflammatory S100 proteins regulate the accumulation of myeloid-derived suppressor cells. J Immunol. 2008;181(7):4666–75. doi: 10.4049/jimmunol.181.7.4666. [DOI] [PMC free article] [PubMed] [Google Scholar]
- Skog J, Wurdinger T, van Rijn S, Meijer DH, Gainche L, Sena-Esteves M, Curry WT, Jr, Carter BS, Krichevsky AM, Breakefield XO. Glioblastoma microvesicles transport RNA and proteins that promote tumour growth and provide diagnostic biomarkers. Nat Cell Biol. 2008;10(12):1470–6. doi: 10.1038/ncb1800. [DOI] [PMC free article] [PubMed] [Google Scholar]
- Song G, Cechvala C, Resnick DK, Dempsey RJ, Rao VL. GeneChip analysis after acute spinal cord injury in rat. J Neurochem. 2001;79(4):804–15. doi: 10.1046/j.1471-4159.2001.00626.x. [DOI] [PubMed] [Google Scholar]
- Torabian S, Kashani-Sabet M. Biomarkers for melanoma. Curr Opin Oncol. 2005;17(2):167–71. doi: 10.1097/01.cco.0000154039.07466.5d. [DOI] [PubMed] [Google Scholar]
- Wang T, Niu G, Kortylewski M, Burdelya L, Shain K, Zhang S, Bhattacharya R, Gabrilovich D, Heller R, Coppola D, Dalton W, Jove R, Pardoll D, Yu H. Regulation of the innate and adaptive immune responses by Stat-3 signaling in tumor cells. Nat Med. 2004;10(1):48–54. doi: 10.1038/nm976. [DOI] [PubMed] [Google Scholar]
- Watters JJ, Schartner JM, Badie B. Microglia function in brain tumors. J Neurosci Res. 2005;81(3):447–55. doi: 10.1002/jnr.20485. [DOI] [PubMed] [Google Scholar]
- Whitaker-Azmitia PM, Murphy R, Azmitia EC. Stimulation of astroglial 5-HT1A receptors releases the serotonergic growth factor, protein S-100, and alters astroglial morphology. Brain Research. 1990;528(1):155–158. doi: 10.1016/0006-8993(90)90210-3. [DOI] [PubMed] [Google Scholar]
- Yu H, Kortylewski M, Pardoll D. Crosstalk between cancer and immune cells: role of STAT3 in the tumour microenvironment. Nat Rev Immunol. 2007;7(1):41–51. doi: 10.1038/nri1995. [DOI] [PubMed] [Google Scholar]
- Zhang L, Alizadeh D, Van Handel M, Kortylewski M, Yu H, Badie B. Stat3 inhibition activates tumor macrophages and abrogates glioma growth in mice. Glia. 2009;57(13):1458–67. doi: 10.1002/glia.20863. [DOI] [PubMed] [Google Scholar]
- Zhang L, Handel MV, Schartner JM, Hagar A, Allen G, Curet M, Badie B. Regulation of IL-10 expression by upstream stimulating factor (USF-1) in glioma-associated microglia. J Neuroimmunol. 2007;184(1–2):188–97. doi: 10.1016/j.jneuroim.2006.12.006. [DOI] [PubMed] [Google Scholar]


