Abstract
The precipitation and growth of AgCl on silver in physiological NaCl solution were investigated. AgCl was found to form at bottom of scratches on the surface which may be the less effective sites for diffusion or the favorable sites for heterogeneous nucleation. Patches of silver chloride expanded laterally on the substrate until a continuous film formed. The ionic transport path through this newly formed continuous film was via spaces between AgCl patches. As the film grew, the spaces between AgCl patches closed and ion transport was primarily via micro-channels running through AgCl patches. The decrease of AgCl layer conductivity during film growth were attributed to the clogging of micro-channels or decrease in charge carrier concentration inside the micro-channels. Under thin AgCl layer, i.e. on the order of a micrometer, the dissolution of silver substrate was under mixed activation-Ohmic control. Under thick AgCl layer, i.e. on the order of tens of micrometers, the dissolution of silver substrate was mediated by the Ohmic resistance of AgCl layer.
Introduction
Growth of silver chloride on silver substrate in chloride environment has been studied by many researchers due to the widely use of Ag/AgCl electrode in laboratories as secondary reference electrode [1-2], in sea water activated batteries as well as in dry batteries [3-6], and the application of the system for modeling of porous electrode [7-8]. The interesting and useful behavior of Ag/AgCl electrode is partly attributed to the high reversibility of Ag/Ag+ system in chloride environments [3, 9], however this behavior makes this noble metal prone to corrosion in chloride environment.
The oxidation of silver in chloride containing solution resulting in the formation of AgCl film has been reported in a number of studies [6, 10-17]. The reaction can be expressed as:
and the half cell potential follows a Nernstian behavior:
| (1) |
A precursor monolayer of AgCl was reported to be formed at potentials below the thermodynamic Ag/AgCl reversible potential [10, 14-15]. The formation of the monolayer AgCl follows an adsorption-desorption mechanism. At a certain overpotential more positive than the Ag/AgCl reversible potential, multi-layer AgCl grows laterally via nucleation and growth [6]. Gradually a thick AgCl film was observed on silver electrode at longer exposure time [16-17].
Morphology of non-continuous AgCl patches was described having rounded smooth surfaces without manifestation of any crystal orientation [18]. The thickness of the non-continuous layer is fairly constant, and is less than 0.5 μm. The top view of the continuous AgCl film is comprised of dense, fine particles [6, 18]. At longer anodic polarization exposure, the morphology of AgCl top layer changes to a mosaic structures [6]. Several attempts have been made to characterize the inner structure of the continuous AgCl layer with various cross sectioning techniques including mechanical polishing followed by etching [17], sharp scalpel cutting [6] and breaking by liquid N2 [17]. However details of the inner structure of AgCl layer were not available and in many cases were reported with speculations.
The growth of continuous AgCl film under galvanostatic condition results in a shift of the applied potential to the more positive direction. This behavior is attributed to the Ohmic resistance of the AgCl layer [11]. Depending on the magnitude of the applied anodic current density, the growth of AgCl follows either a low field or a high field or a mixed low and high field conduction mechanism. The low field conduction mechanism takes place at low current density range (< 10 mA/cm2) in which AgCl film is thought to be porous and AgCl exhibits extrinsic conductivity, i.e. Ohmic conduction via pores [11]. However, no attempt has been made to characterize the morphology, the size, the density of these pores or to examine the solution concentration inside the pores. The high field conduction mechanism takes place at high current density range (> 100 mA/cm2) in which AgCl exhibited intrinsic conductivity, i.e. exponential relationship between current density and potential [11]. A mixed conduction mechanism can occur at intermediate current densities.
Transport of ions through the corrosion product layer is essential for continuous corrosion [19]. In the case of silver oxidation and formation of AgCl, the dominant charge carrier inside the AgCl layer is still controversial. Some researchers claimed that Ag+ is the main charge carrier inside the micro-channels through AgCl layer [6] while some others suggested both Ag+ and Cl− contribute to the transport process [17]. Beside the charge carrier, the physical properties of the AgCl layer also play an important role on the transport process. As the AgCl layer grows thicker, diffusion and migration through this layer become more difficult due to the lengthening of the transport distance and/or the decrease of the ion concentration inside the micro-channels. The formation of a thick AgCl layer with high Ohmic resistance on the silver surface as the consequence of corrosion is likely to slow the rate of the silver dissolution. However, the inter-relationship between the AgCl structure, the resistivity of AgCl layer, the transport process through this layer and the silver dissolution kinetics in chloride environments was not addressed in the literature.
The objective of this work is to examine the growth of AgCl layers on silver, and its effect on silver dissolution in 9 g/L NaCl solution which is more diluted than the concentration commonly used in the previous studies. The thick AgCl layers were grown by potentiodynamic and galvanostatic polarization in Cl− solution. The morphology and crystal structure of thick AgCl layers were characterized with scanning electron microscope (SEM), X-ray energy dispersive spectroscopy (XEDS) and X-ray diffraction (XRD). The inner structure of the AgCl layers were characterized with focused ion beam (FIB) and SEM. FIB provides the ability to cut the AgCl layer at high accuracy giving a smooth cross section that can not be obtained with conventional mechanical methods. The Ohmic resistance of the AgCl layer was measured by electrochemical impedance spectroscopy (EIS). The effect of AgCl corrosion product layer on the kinetics of silver dissolution was studied in terms of the structure, thickness and conductivity of AgCl layer. A mathematical model is presented in a separated paper. The results are relevant to the dissolution and release of silver in biomedical applications [20-21].
Experiments
Specimens and electrochemical cell
Silver wires of 99.9% purity with 0.5 mm diameter supplied by Alfa Aesar (Ward Hill, MA) were used in this study. Physiological saline solution of 9 g/L NaCl was prepared from experimental graded crystalline NaCl (Fisher Chemical, Fair Lawn, NJ) and de-ionized water. This solution is commonly used in corrosion tests of biomaterials. A saturated calomel electrode (SCE) and pure Pt wire were used for reference and counter electrodes, respectively. The test cell setup followed a 3-electrode configuration.
Specimens for AgCl formation were 0.5 mm-diameter silver wires of 2 cm long. The silver wires were ultrasonically cleaned in methanol prior to each experiment. Further cleaning was done by cathodic polarization at −1.0 VSCE for 10 minutes. To observe the formation and growth process of AgCl on Ag substrate, the Ag wire specimens were polarized from a cathodic potential of −0.50 VSCE to final anodic potentials varied from −0.04 VSCE up to +0.60 VSCE with a scan rate of 0.5 mV/s.
Specimens for AgCl Ohmic resistance measurement were 0.5 mm-diameter silver wires. The wires were wrapped in adhesive-line polytetrafluoroethylene (PTFE) heat shrink tube. The cross section of the silver wire was polished with 600 grit silicone carbide paper and ultrasonically cleaned with methanol. Then, the wire was pulled inside the tube to form a cylindrical cavity of 0.5 mm diameter and 1 mm depth. The purpose of this treatment was to help the formation of a uniform AgCl layer rather than a mushroom cap on top of the Ag wire cross section as observed on flush mounted sample [22]. To obtain AgCl layers with different thicknesses for resistance measurement, the specimens were anodically oxidized to pass different amounts of charges up to 10 C/cm2 at different applied current densities of 0.1, 0.2, 0.5, 1 and 2 mA/cm2.
Characterization of silver chloride layer
The morphology of AgCl formed on the specimens was observed with a Hitachi S4500 field-emission scanning electron microscope (FE-SEM) (Hitachi, Ltd.). The chemistry and structure of the layer were examined with a Noran X-ray energy dispersive spectrometry (XEDS) incorporated with the FE-SEM and a Scintag X-1 advanced X-ray diffractometer (XRD) (Scintag, Inc.) using Cu (Kα) AgCl layer was observed with SEM after cross sectioning the layer with a dual-beam focused ion beam (FIB) Nova Nanolab 200 (FEI Company). A thin Pt layer of 1 μm was deposited on top surface to protect the AgCl layer during cross sectioning. An ion beam of 30 kV and 7 nA was used for cross sectioning, and an electron beam of 5 kV and 0.4 nA was used for SEM imaging. The illumination time was minimized for both cross sectioning and imaging activities to avoid decomposition of AgCl under energized beams.
Ohmic resistance measurement of AgCl layer
The resistances of AgCl layers formed after passing different amounts of coulombs were measured with electrochemical impedance spectroscopy (EIS) using a Gamry FAS2 femtostat (Gamry Instruments). The impedance was measured by applying a 10 mV oscillation perturbation and sweeping frequency from 100 kHz to 1 Hz to minimize the effect of EIS measurement on AgCl thickness. The value of the AgCl layer resistance was taken as approximately the impedance value at 100 Hz when the phase shift angle between the response current and the applied potential was ca. −1 °.
Potential-pulse experiment
The effect of the AgCl layer on silver dissolution kinetics was examined with potential-pulse experiments. A AgCl layer was grown on a heat shrink tube wrapped silver wire specimen as mentioned earlier by galvanostatic polarization at a current density of 1mA/cm2 for 1000s. Potential pulses with the pulse duration of 1s were applied using a Solartron 1280B Electrochemical System (Solartron Analytical). The potentials were increased from an initial value of 100 mVSCE with a step of 100 mV and the response current was recorded.
Results
Precipitation and growth of AgCl
A representative current vs. potential curve during the potentiodynamic polarization experiment is shown in Figure 1. The anodic behavior of silver was characterized by a low anodic current density at the potentials near the corrosion potential followed by an abrupt increase at a potential of ca. +0.05 VSCE. To observe the formation and growth of AgCl on the silver surface, the polarization was terminated at different anodic potentials of −0.04, +0.04, +0.06, +0.08, +0.15 and +0.60 VSCE as indicated in the figure.
Figure 1.
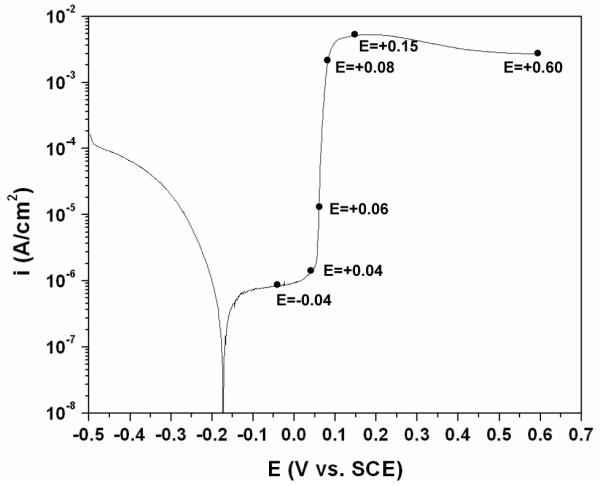
Current vs. potential curve of the silver wire specimens during potentiodynamic polarization in physiological 9 g/L NaCl solution. The terminated potentials for preparation of different AgCl layers are shown in the curve.
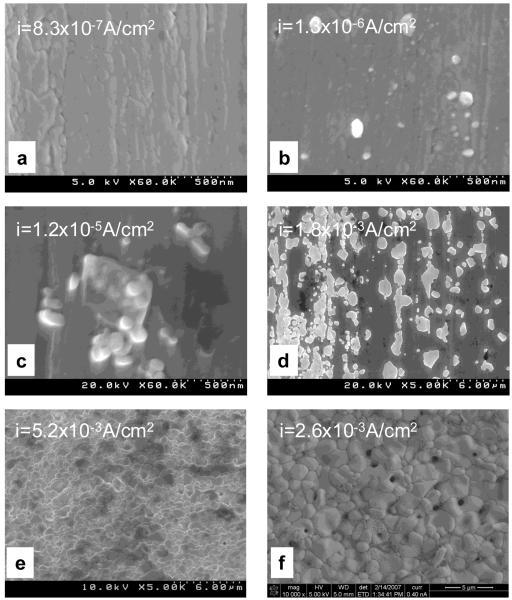
SEM micrographs showing the morphologies of the specimens after polarization are presented in Figure 2. At the terminated anodic potential of −0.04 VSCE the anodic current density was ca. 8×10⁻⁷ A/cm2. The SEM micrograph of the specimen after polarization (Figure 2a) shows a surface free of AgCl. At the anodic potential of +0.04 VSCE, the anodic current density increased to ca. 1.3×10⁻⁶ A/cm2. The morphology of the polarized specimen terminated at +0.04 VSCE (Figure 2b) was featured by particles with size of less than 100 nm scattered over the surface. The anodic current density increased significantly at the potential of +0.06 VSCE to ca. 1.2×10⁻⁵ A/cm2. Clusters of 100 nm size particles were observed on specimen at this terminated potential (Figure 2c). At +0.08 VSCE, the current density was ca. 1.8×10⁻³A/cm2, and the specimen surface after polarization was covered with patches of non-continuous corrosion product film. During growth, the patches expanded laterally to cover the silver substrate more than growing thicker from the surface. A preferential expanding direction was observed that followed the scratch direction on the surface (Figure 2d). At higher anodic overpotentials, the current density did not increase but stayed at the higher magnitude on the order of 10−3 A/cm2. The surface of specimen after polarization was covered with a continuous layer as shown in Figure 2e and Figure 2f.
Figure 2.
SEM micrographs showing the morphology of different AgCl layers during formation on silver surface. The specimens were prepared by potentiodynamic polarization and terminated at different anodic potentials of (a) −0.04, (b) +0.04, (c) +0.06, (d) +0.08, (e) +0.15, and (f) +0.60 VSCE.
Structure of AgCl layer
An XEDS spectrum taken from a patch on the specimen polarized to +0.08 VSCE is shown in Figure 3. Silver and chlorine were detected. In addition, an XRD pattern of the corrosion product formed on the specimen after polarization to +0.60 VSCE is shown in Figure 4. The crystalline peaks in the XRD pattern were identified as AgCl with fcc structure (PCPDFWIN software Version 2.1, International Centre for Diffraction Data).
Figure 3.
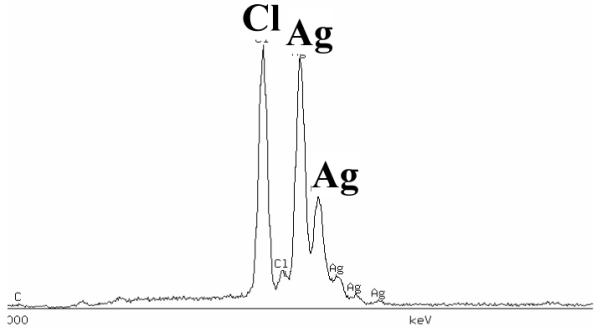
XEDS spectrum of the non-continuous film on the specimen after polarization to +0.08 VSCE in the potentiodynamic polarization experiment. The spectrum shows the existence of Ag and Cl in the corrosion product layer.
Figure 4.
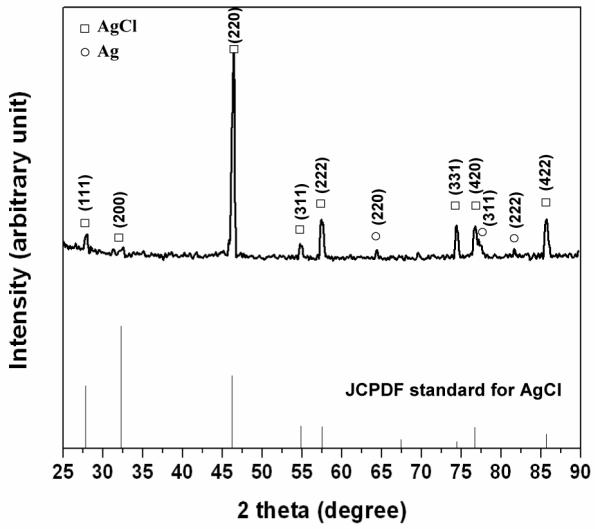
XRD pattern of the continuous film formed on the specimen after polarization to +0.60 VSCE in the potentiodynamic polarization experiment. The pattern confirms fcc crystal structure of AgCl layer.
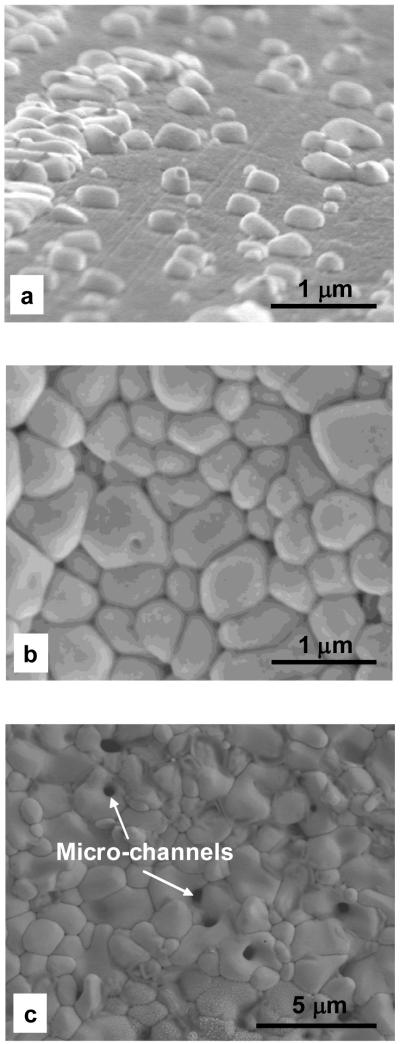
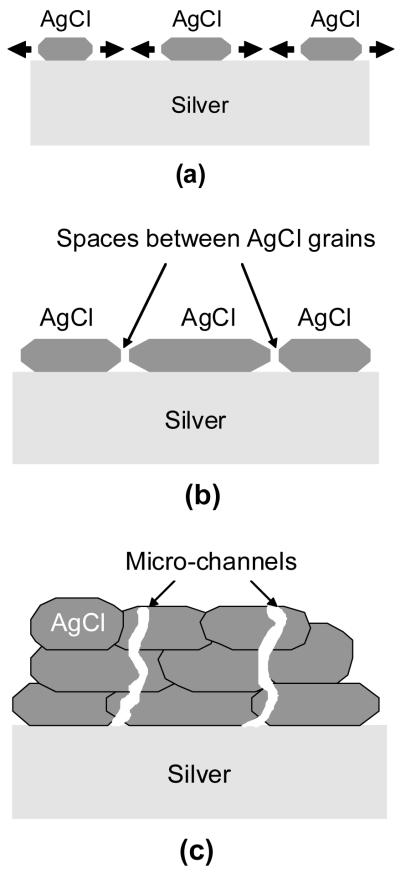
The morphologies of the non-continuous and continuous AgCl layers grown by potentiodynamic polarization are shown in Figure 5. AgCl patches in the non-continuous layer had rounded edges (Figure 5a) and tended to expand laterally rather than thickening. In the continuous AgCl film formed after potentiodynamic polarization to +0.15 VSCE (Figure 5b) the top layer was comprised of rounded particles with size of less than 1 μm. Spaces between AgCl particles can be seen in the SEM micrograph. The top layer of the continuous AgCl film changed to irregular-shaped grains at the terminated polarization potential of +0.60 VSCE (Figure 5c). The spaces between AgCl grains were not observed, and instead micro-channels running through the grains can be seen from the top surface.
Figure 5.
SEM micrographs of the surface morphology of different AgCl layers after potentiodynamic polarization in physiological 9 g/L NaCl solution. The anodic potentials were terminated at different potentials of (a) +0.08, (b) +0.15 and (c) +0.60 VSCE.
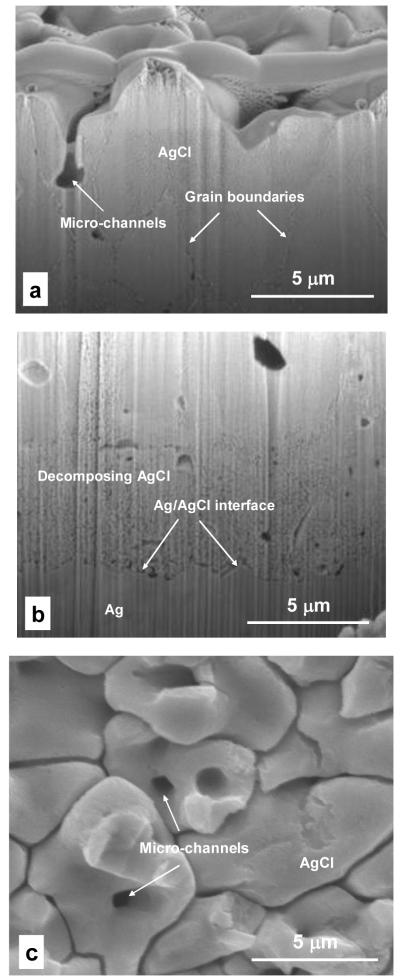
The inner structure of a thick, continuous AgCl layer was examined by cross sectioning in the direction vertical to the substrate surface with FIB followed by SEM observation. The SEM micrographs of the cross sections are shown in Figure 6a and Figure 6b. Figure 6c shows a cross section of the AgCl layer in the direction parallel to the substrate surface after removal part of the layer by ultrasonic cleaning. AgCl grains of several micrometers were observed in Figure 6a. Some micro-channels running from the top surface through the grains into deeper layers were also observed in Figure 6a and Figure 6c. The micro-channel in Figure 6a indeed penetrated deep into the AgCl layer, however due to the tortuosity of the channel, only a portion of it was observed in the present cross section. After ca. 20 s exposure under electron beams, the AgCl grains were quickly decomposed creating a porous nanostructure with the pore size of approximately 100 nm (Figure 6b). The decomposition of AgCl to silver under the illumination of energized beams is well known and is utilized in photography. No significant delamination at the Ag/AgCl interface was observed in Figure 6b. To maintain such adherent interface during continuous dissolution of the silver substrate, AgCl must be formed at the bottom of the AgCl layer.
Figure 6.
SEM micrographs of the cross sections of the AgCl layers grown by galvanostatic polarization in physiological 9 g/L NaCl solution. The layers were grown at 0.5 mA/cm2 to pass a charge amount of 5 mC/cm2; (a) FIB cross sectioning at top layer showing a portion of a micro-channel; (b) FIB cross sectioning at Ag/AgCl interface; and (c) a cross-section of AgCl layer after ultrasonic cleaning to break the top layer.
The Ohmic response behavior of silver dissolution underneath AgCl layers
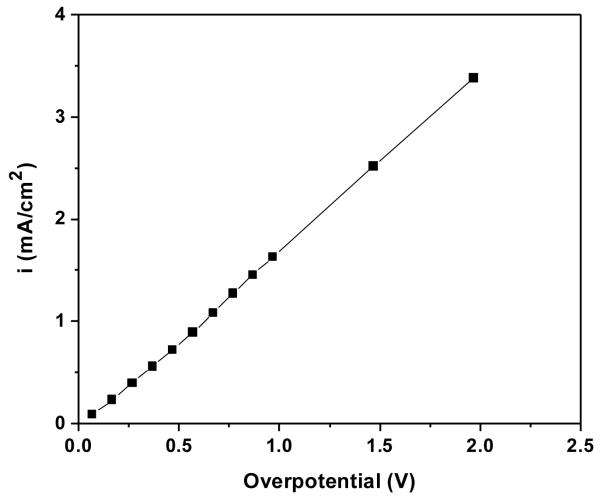
To examine the dependence of silver dissolution currents on applied potentials with the existence of a continuous AgCl layer, potentiostatic step experiments were performed. The thickness of the AgCl layer after passing 1 C/cm2 was approximately 20 μm. Figure 7 shows the relationship between the anodic current density and the overpotential during the potentiostatic step experiment. The overpotential was calculated with the assumption that the potential of the silver electrode underneath the AgCl layer was equal the Ag/AgCl reversible potential of +0.033 VSCE in 9 g/L NaCl solution as obtained from equation 1. For a large range of applied potential from +0.1 to +2.0 VSCE, the response current density followed a linear relationship with overpotential indicating the dissolution of silver underneath a thick AgCl layer was under Ohmic control as discussed below.
Figure 7.
Silver dissolution current density vs. overpotential in potentiostatic step experiments. The duration of each applied potential was 1 second to minimize the growth of AgCl layer. The overpotential was calculated with the assumption that the electrode potential is equal the Nernstian potential of Ag/AgCl in 9 g/L solution, i.e. Ea = +0.033 VSCE.
Ohmic resistance of AgCl layer
The resistances of the AgCl layers grown by galvanostatic polarization experiments were measured by EIS at different AgCl thickness during the experiments. Figure 8 shows a typical potential vs. time curve during galvanostatic polarization experiments. The potential at the oxidizing electrode increased with time. Potential fluctuations were observed in all experiments; however, the events occurred at different times and lasted for different durations depending on the applied current density. This behavior has been observed by others [17]. One notable behavior is that despite the intermittences of the galvanostatic experiments for EIS measurements, the overall potential vs. time curves was smooth. The arrows in Figure 8 indicate the times of interruption during the galvanostatic experiment. The inset in Figure 8 shows a segment of the potential vs. time curve in which two interruption events for EIS measurement took place. The restoration of the potential to the value before the interruption for EIS measurement, even during oscillation period, indicates the strong dependence of the potential on the physical properties of the AgCl layer itself rather than on time dependence processes such as diffusion, at least in the time scale of the experiments. The smoothness of the overall potential vs. time curves indicated the alternation between galvanostatic and EIS experiments had negligible effect on the galvanostatic experiments.
Figure 8.
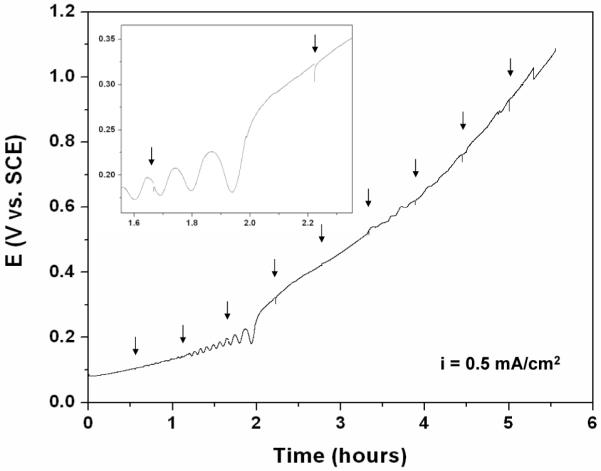
Potential vs. time curve during galvanostatic preparation of AgCl layer with i = 0.5 mA/cm2. The arrows indicate the time when EIS experiments took place. The inset shows a segment of the E-t curve at a higher magnification.
The resistances of the AgCl layers formed during galvanostatic experiments at different current densities were measured by EIS. Figure 9 shows the dependence of the AgCl layer resistance on the amount of coulombs passed per unit area on the silver electrode during the formation of the AgCl layers at different applied anodic current densities of 0.1, 0.2, 0.5, 1 and 2 mA/cm2. The AgCl resistances increased with the coulombs passed per unit area or corresponding as the resistance increased with the thickness of the AgCl layer. However, the resistance of the AgCl layer was not dependent on the magnitude of the applied current density under which it grew. Compared to the resistances of thin AgCl layers, the resistances of thicker AgCl films grown under different current densities were more scattered.
Figure 9.
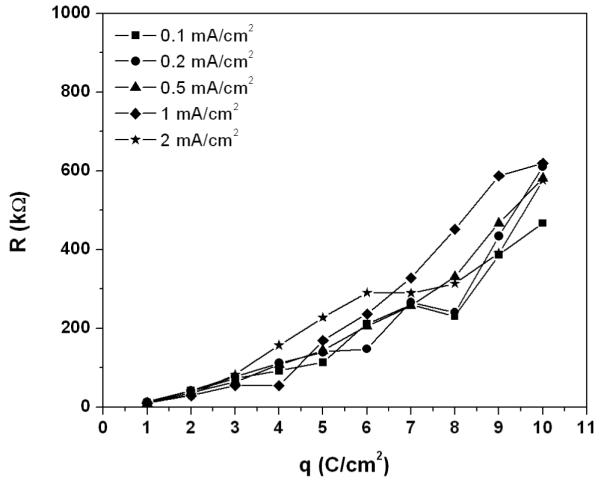
Dependence of AgCl layer resistances on coulomb passed per unit area during galvanostatic experiments at different applied current densities of 0.1, 0.2, 0.5, 1 and 2 mA/cm2. The resistances of AgCl layer were taken as the impedance value at 100 Hz when the phase shift angle was ca. −1°.
Discussion
Formation and growth of AgCl
The formation and growth of AgCl on silver substrate in 9 g/L NaCl solution was studied during potentiodynamic polarization. At small anodic overpotentials, the anodic current density was small, i.e. the concentration of dissolved Ag+ in the solution was small, and no AgCl was observed on the silver substrate (Figure 2a). As the anodic current density increased due to higher anodic overpotential, the solution near the silver surface became more concentrated with Ag+. Precipitation of AgCl occurred when the solution saturated with Ag+. AgCl particles with size of less than 100 nm were observed at the current density of ca. 1.3×10⁻⁶A/cm2 (Figure 2b). AgCl patches expanded laterally at higher anodic overpotentials and current densities with preferential directions along scratches on the surface. This may be due to a higher extent of Ag+ supersaturation at the scratch bottom or a decrease in the free energy for nucleation at these heterogeneous sites. However, no further study was conducted to elucidate this speculation.
When patches impinged and AgCl formed a continuous layer on the silver substrate, the layer started thickening. Spaces between AgCl particles were visible at this period (Figure 5b). The spaces between AgCl particles are likely to be the primary route for the ionic transport between the dissolving silver electrode and the electrolyte during this early stage of film growth. As the AgCl layer thickened, the spaces between the AgCl particles were closed (Figure 6a), and the ionic transport via this route was limited. In addition, the field strength through AgCl layer was estimated on the order of 103 V/cm, thus intrinsic conduction via solid AgCl layer by high field mechanism was ruled out. Therefore micro-channels running through the AgCl particles are likely to be the main conduction path at this later stage. Figure 10 summarizes the growth of AgCl patches and the evolution in the structure of AgCl layer.
Figure 10.
Schematics of AgCl growth and the evolution in the structure of AgCl layer during potentiodynamic polarization in 9 g/L NaCl solution, (a) lateral growth of AgCl patches, (b) impingement of AgCl patches, and (c) thickening of AgCl layer.
The change in the morphology of the AgCl top surface and the adherence of the AgCl layer to the silver substrate indicates that the formation of AgCl occurred at both the top and bottom of the AgCl layer. This observation implies that there must be transport of Ag+ from the silver substrate toward the electrolyte and Cl− from the electrolyte toward the silver electrode to support the continuous formation of AgCl. In the newly formed, continuous AgCl layer, Ag+ and Cl− ions may be transported via pores between the AgCl particles. However, in thick AgCl layers, micro-channels through AgCl are likely to be the main path for ionic transport.
The effect of the AgCl corrosion product layer on limiting the corrosion of the silver substrate has been reported [22]. This effect of the AgCl layer is due to the retardation of the ionic transport through the layer. Transport of ions in an electrolyte can be due to a concentration gradient (diffusion), to an electrostatic field (migration), or to a bulk fluid motion (convection). During silver dissolution and AgCl growth, convection inside the micro-channels is negligible, therefore it does not affect the dissolution current of silver. Nevertheless, the process can be under diffusion control or Ohmic control or mixed diffusion-Ohmic control.
The appearance of a constant current density at the high potential ranges during potentiodynamic polarization experiments (Figure 1) mimics the behavior of a limiting current density in diffusion controlled regime. The limiting current density, iL, is calculated by:
| (2) |
where z is the valence of the charge carrier; D is the diffusivity of the charge carrier (cm2/s); F is the Faraday constant (F=96500 C/mol/equivalent); Cb is the concentration of Cl− and Na+ ions in the bulk or is the concentration Ag+ cation at the silver electrode (mol/cm3); tr is the transport number of the charge carrier; and δ is the diffusion layer thickness (cm). During potentiodynamic polarization experiments, the thickness of the AgCl layer increased and therefore the diffusion layer thickness associated with the micro-channels also increased. Hence, if the process was under diffusion control, the limiting current density calculated by equation 2 would decrease during the course of the potentiodynamic experiment rather than kept a constant value.
The argument that the dissolution of silver after the formation of a continuous AgCl layer is under Ohmic control is needed to be examined. This argument implies that (i) if the resistance of the AgCl layer is constant, the rate of the silver dissolution will increases proportionally with the overpotential and (ii) if the anodic dissolution current is controlled at a constant value, the overpotential at the electrode will increase proportional to the AgCl resistance.
The results of the galvanostatic step experiments are shown in Figure 7. In these experiments, the pulse duration was chosen as 1 s to minimize the change in the AgCl thickness. Thus, the resistance of the AgCl layer is considered constant during the test. Figure 7 shows that the dissolution current of silver indeed increased linearly with the overpotential. Extrapolation of this data crosses the origin in the i vs. overpotential plot. These experiments validate point (i).
Point (ii) is validated by the galvanostatic experiments. During these experiments, the thickness of the AgCl layer increased, and so did the resistance of the layer. An increase in the overpotential was observed in Figure 8 as the result of an increasing AgCl layer resistance. Furthermore, the restoration of the overpotential to the value before the interruption time for EIS measurement indicates the strong dependence of the overpotential on the resistance of the AgCl layer. Quantitative examination of this point will be performed after the conductivity of the AgCl layer is analyzed in the section below.
Ionic conductivity of the electrolyte inside the micro-channels
The resistance vs. coulombs passed per unit area curves in Figure 8 shows that the resistance of the AgCl layer increased approximately linearly with the coulomb passed to a certain thickness from which the resistance increased at a faster rate. Assuming that the micro-channels were the main ionic transport path through the AgCl layer, the dependence of the AgCl layer resistance on the coulombs passed can be explained as the result of the lengthening of the micro-channels and/or the thinning or restriction of some of the channels. The resistance of the AgCl layer, R, is calculated from the film thickness, x, by:
| (3) |
where β is a structural factor representing the increase in the ionic transport distance due to the tortuosity of the micro-channels (β> 1); Amc is the average cross-section area of the micro-channels (cm2); Kmc is the conductivity of the electrolyte inside the micro-channels (S/cm); and N is the number of the micro-channels running through the AgCl layer. As the film thickened, the ionic transport distance in the micro-channels increased proportionally with the film thickness. If the conductivity of the electrolyte inside the micro-channels does not change, and if the structural factor and the number of the micro-channels are constant, the resistance of the AgCl layer will increase linearly with the film thickness. These conditions are more likely to be met during a short time of AgCl growth, i.e. when the thickness of the AgCl layer is thin. Therefore a linear relationship was observed in the R vs. q curves at low q regions (Figure 9).
For longer times, the precipitation of AgCl inside the micro-channels might occur if the saturation condition was met. Precipitation of AgCl was observed at both Ag/AgCl and AgCl/solution interfaces. Therefore it is likely that AgCl also precipitates inside the micro-channels. Thus, the radiuses of the micro-channels are likely to decrease with time which resulted in a reduction of the micro-channel cross-section area, Amc. Eventually some of the channels might be blocked and the number of micro-channels, N, decreased. In addition, the formation of AgCl at the Ag/AgCl interface and inside the channels consumed Cl− and Ag+ and decreased the concentration of Cl− and/or Ag+ ions inside the channels, i.e. a decrease in the conductivity of the electrolyte inside the micro-channels, Kmc. Either the decrease in Amc, N or Kmc leads to a faster increase in the resistance of the AgCl layer, and the R vs. q curve deviates from a linear relationship.
To estimate the concentration of charge carriers inside the micro-channels, the conductivity of the electrolyte inside the micro-channels is calculated from Equation 3. The AgCl layer formed after passing 6 C/cm2 is chosen for this estimation. Assuming that all dissolved Ag+ cations precipitated as AgCl, Faraday’s law gives:
| (4) |
where mAgCl is the mass of AgCl (g); A is the surface area of the electrode (cm2); x is the thickness of the AgCl layer (cm); ρAgCl is the density of the AgCl layer (g/cm3); MAgCl is the molecular weight of AgCl (g/mol); n is the number of electron transferred in the silver dissolution reaction (n = 1); q is the number of coulomb passed per unit area (C/cm2); and F is the Faraday’s constant (F = 96,500 C/mol/equiv). Therefore, the thickness of this layer is calculated by:
| (5) |
Substitution of Equation 5 into Equation 3 and rearranging yields:
| (6) |
From Figure 9, the resistance of the AgCl layer after passing 6 C/cm2 was ca. 200 kΩ. The number of the micro-channels and the average cross-section area of the micro-channels were estimated from the SEM micrographs which gave approximately 14,400 channels and 0.5×10⁻⁸ cm2 cross-section area on the entire sample surface of 2×10⁻³ cm2. Then, the micro-channels accounted for ca. 4% volume fraction of the AgCl layer. The tortuosity of the micro-channels was assumed to increase the transport distance by a factor of two, i.e. β = 2. The molecular weight and the density of AgCl was taken as 143.5 g/mol and 5.56 g/cm3, respectively [23]. Substitution of the numerical values into Equation 6 yielded Kmc = 2.15×10⁻⁴ S/cm.
The concentration of the charge carriers inside the micro-channel was estimated using the relation:
| (7) |
where j represents the charge carrier species of interest; λj is the equivalent ionic conductivity of the species (S.cm2/mol); zj is the charge of the species; and Cj is the concentration of the species (mol/cm3). In micro-channels, it is likely that Na+ and Cl− are the dominant charge carriers. The equivalent ionic conductivity of Na+ and Cl− ions are 50 and 76 S.cm2/mol, respectively [24]. Thus, Equation 7 can be rewritten as:
| (8) |
This expression indicates that the concentrations of Na+ and Cl− inside the micro-channels were on the order of 10−6 mol/cm3. This concentration is approximately 100 times more diluted than the concentration of these ions in the bulk solution which is ca. 10−4 mol/cm3. The concentration of Ag+ in the micro-channels is limited by the solubility product of AgCl, Ksp, which is represented by:
| (9) |
At room temperature, the solubility product of AgCl is 1.8×10⁻¹⁶ (mol2/cm6) [23]. If the concentration of Cl− was on the order of 10−6 mol/cm3 as calculated earlier, the concentration of Ag+ in the micro-channels was on the order of 10−10 mol/cm3 or smaller.
The apparent conductivity of the AgCl layer
In addition to the conductivity of the electrolyte inside the micro-channels, another important parameter is the apparent conductivity of the AgCl layer. Based on the resistance of the AgCl layer measured from EIS, the apparent conductivity of the AgCl layer, K, is calculated by:
| (10) |
where x is the thickness of the AgCl layer (cm); R is the resistance of the AgCl layer (Ω); and A is the surface area of the electrode (cm2). The thickness of the AgCl films was calculated from Equation 5. The resistance of the AgCl layer at different coulombs passed per unit area was taken from EIS measurements.
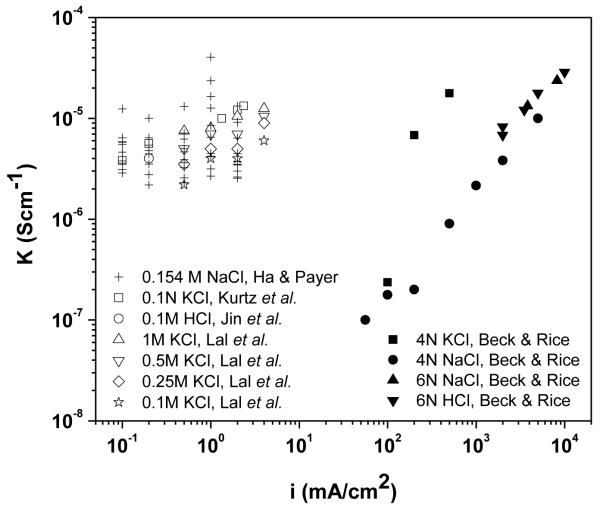
The apparent conductivity of the AgCl layer calculated at different charge passed per unit area is shown in Figure 11. A trend of decrease in the apparent conductivity as the film grew thicker was observed. After passing an amount of 10 C/cm2, the apparent conductivity of the AgCl layer was approximately 2×10⁻⁶ S/cm which was 10 times lower than the conductivity of the film after passing 2 C/cm2. The apparent conductivities obtained in this study are consistent with the values of the AgCl conductivities reported in the literature and as summarized in Figure 12 [6, 11, 25]. The decrease in the AgCl apparent conductivity with the film thickness supports the hypothesis of either decrease in the number of micro-channels, the restriction of some of the channels or the decrease of the charge carrier concentration inside micro-channels as the film grows.
Figure 11.
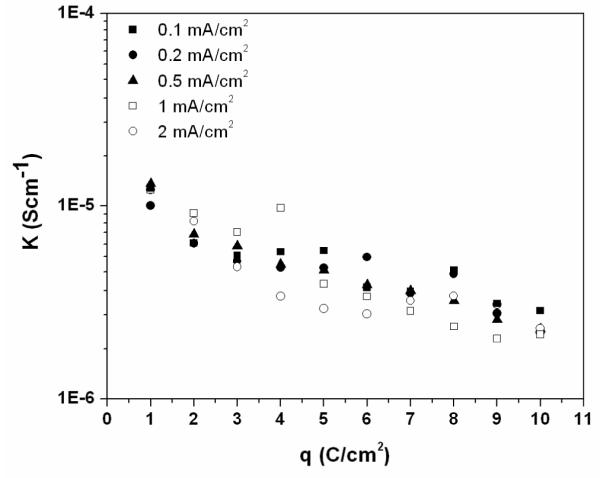
The apparent conductivity of the AgCl layers during galvanostatic experiments in 9 g/L NaCl solution at different current densities of 0.1, 0.2, 0.5, 1 and 2 mA/cm2. The apparent conductivities were calculated from Equation 10.
Figure 12.
Comparison between the conductivities of AgCl layer obtained in this study and literature data. The AgCl layers in this study were formed at different applied current densities in 0.154M NaCl solution. The AgCl layers in the literature were formed at different applied current densities and in different chloride solutions [6, 11, 25].
The effect of the continuous AgCl layer on the silver dissolution mechanism
As the apparent conductivity of the AgCl layer decreases with the thickness, the transport via this layer becomes more difficult. The continuous increase of the applied potential to pass the same amount of current in the galvanostatic experiment is due to this effect. The applied potential, V, is expressed in terms of the electrode potential, Ea, the anodic activation overpotential, ηaa, the anodic concentration overpotential, ηca, and the Ohmic overpotential, ηΩ, by:
| (11) |
The Ohmic overpotential at the silver electrode is mainly due to the Ohmic resistance of the AgCl layer. Thus, during galvanostatic experiments, the Ohmic overpotential is expressed by Ohm’s law:
| (12) |
Combination of Equation 5 and 12 yields:
| (13) |
The galvanostatic polarization experiments were performed at applied current densities of 0.1, 0.2, 0.5, 1 and 2 mA/cm2. The values of the apparent AgCl conductivity after passing different charge per unit area were calculated earlier.
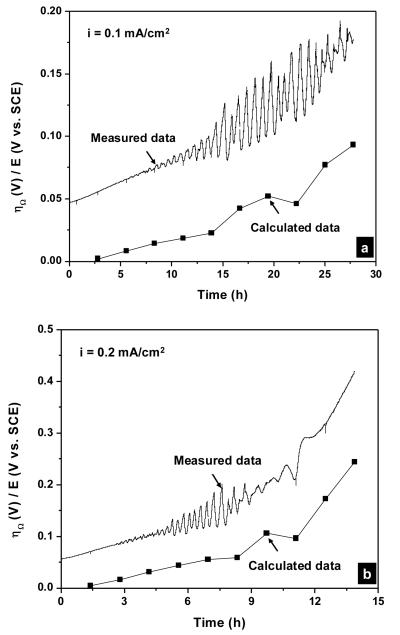
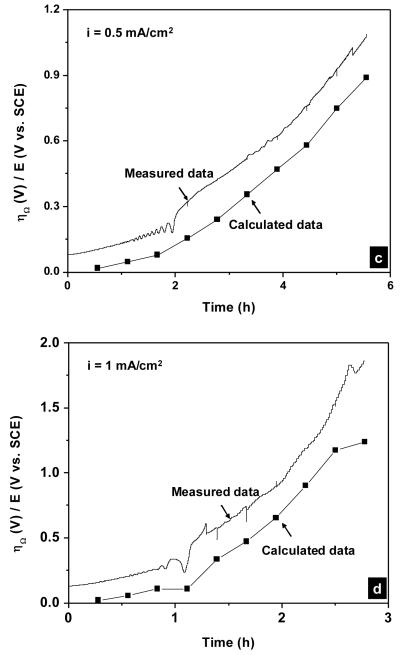
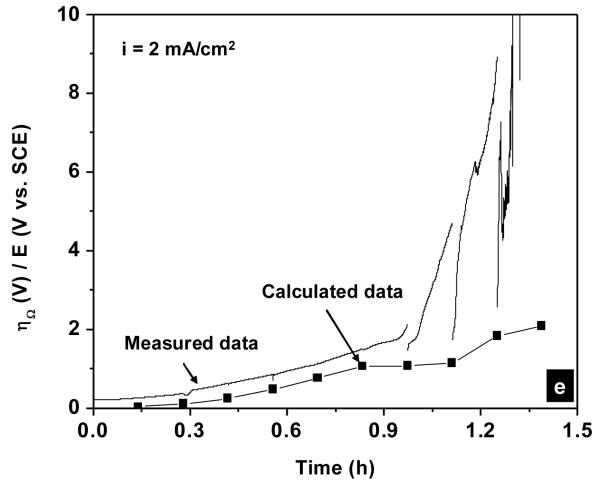
Figure 13 shows the overpotential vs. time curves during galvanostatic polarization experiments calculated from Equation 13 plotted in the same graph with the experimental data. In all cases, the calculated curves resembled the experimental data with some offsets. This indicated the dominance of the Ohmic overpotential through the AgCl layer during the dissolution of the silver electrode beneath thick AgCl layers. For instance, the Ohmic overpotential after 4 hours at the applied current density of 0.5 mA/cm2 (Figure 13c) was accounted for ca. 80% of the measured potential. At the applied current densities of 1 and 2 mA/cm2, some deviation in the slopes of the calculated curves from the experimental curves toward the ends of these experiments was observed and may be due to the change in the ionic conduction mechanism through the AgCl layer from extrinsic to an intrinsic one. At these high applied current densities and therefore high overpotentials, the conduction via micro-channels was complemented by high field conduction in AgCl solid phase as observed by others [25].
Figure 13.
Calculated and measured potential vs. time curves during galvanostatic polarization experiment in physiological 9 g/L NaCl solution. The applied current densities were (a) 0.1; (b) 0.2; (c) 0.5; (d) 1 and (e) 2 mA/cm2. The calculated overpotentials were obtained from Equation 13.
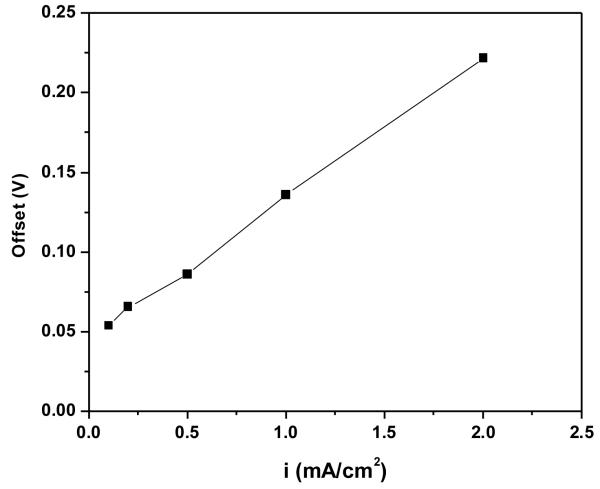
Figure 13 also shows that there are offsets between the calculated overpotentials and the measured potentials. These offsets are the sum of the electrode potential, the anodic activation overpotential and the anodic concentration overpotential as indicated in Equation 11. The offsets between the calculated overpotentials and the measured potentials were measured at the time when 2 C/cm2 has been passed, i.e. at the first EIS measurements. Figure 14 shows the dependence of the offset values on the applied current density in the galvanostatic experiments. A linear relationship between the offset values and the applied current density was observed. This finding indicates that beside the Ohmic drop through the AgCl layer, another current dependence factor contributed to the overall overpotential at the silver electrode at the beginning of the experiments, i.e. when the AgCl layer was thin.
Figure 14.
Dependence of the offsets between the calculated and the measured overpotentials on the applied current densities during galvanostatic experiments.
From Equation 11, the offset values can be expressed as:
| (14) |
The concentration overpotential for the anodic reaction is expressed by:
| (15) |
In the above equations, R is the gas constant (R = 8.314 J/mol.K); T is temperature (K); io is the exchange current density of the silver dissolution reaction (A/cm2); and iL is the limiting current density of the silver dissolution reaction (A/cm2). Equation 15 does not indicate an overpotential limit, unlike the one for the cathodic reaction. At the anode, insufficient diffusion does not cause depletion of the reactant in the solution but may result in precipitation at the electrode when the solution is saturated with cations released from the anodic reaction. If the precipitation forms an insulation layer, the current will be physically limited unless the layer is porous. In the situations considered here, since the AgCl deposit remains porous, the anodic concentration overpotential as indicated in Equation 15 is negligible. Thus, the anodic activation overpotential is calculated by:
| (16) |
The value of the electrode potential, Ea, is taken as the Nernstian potential of a Ag/AgCl electrode in 9 g/L NaCl solution (Ea = +0.033 VSCE). Therefore, the exchange current density, io, can be obtained from the Butler-Volmer equation:
| (17) |
where αa, αc are the charge transfer coefficients of the anodic and cathodic reactions, respectively, at the silver electrode (αa + αc ≈ n). Assuming that αa = αc = 0.5, the value of the exchange current density for the silver dissolution reaction at the temperature of 298 K calculated from Equation 17 is summarized in Table 1.
Table 1.
Summary of the calculated exchange current density
| i (mA/cm2) | ηaa (V) | io (mA/cm2) | io(average) (mA/cm2) | Standard deviation |
|---|---|---|---|---|
| 0.1 | 0.021 | 0.119 | 0.13 | 0.03 |
| 0.2 | 0.033 | 0.145 | ||
| 0.5 | 0.053 | 0.204 | ||
| 1 | 0.103 | 0.137 |
The value of the exchange current density for the Ag/Ag+ redox reaction varied over large ranges depending on the nature of the electrolyte. An extremely high exchange current density on the order of 10−1 A/cm2 for Ag/Ag+ redox reaction in perchlorate solutions has been reported in literature [26-27]. In other cases, the exchange current density in the range of 10−5 to 10−3 A/cm2 for the silver electrodeposition in cyanide electrolyte has been reported [28-30]. However no value was found for the reaction in diluted NaCl solution.
Since the concentration overpotential in the situation considered here is negligible, the measured potential given in Equation 11 can be rewritten as:
| (18) |
This expression indicates the contribution of the Ohmic overpotential and the activation overpotential on the dissolution kinetics of silver. When AgCl is a non-continuous layer, the value of the second term in Equation 18, which represents the Ohmic overpotential, is small in comparison with the third term, which represents the activation overpotential, therefore the activation overpotential is dominant and determines the dissolution current. When the AgCl is a thin, continuous layer, e.g. after 1 hour at i = 0.5 mA/cm2, the second term and the third term in Equation 18 are of the same order, therefore the dissolution of silver is under mixed Ohmic-activation control. After a long time when the thickness of the AgCl layer becomes large, e.g. after 4 hours at i = 0.5 mA/cm2, the second term in Equation 18 dominates the last term. Thus, after a long enough time, the activation overpotential becomes negligible, and the silver dissolution is under Ohmic control.
Conclusion
The precipitation and growth of AgCl on a silver substrate in physiological 9 g/L NaCl solution were investigated. AgCl particles nucleated at the bottom of the scratches on the surface which may be less effective sites for diffusion or favorable sites for heterogeneous nucleation. The particles grew to patches which expanding laterally on the substrate until forming a continuous film. Ionic transport through the newly formed continuous AgCl film was via the spaces between the AgCl grains. As the film thickened, the spaces between the AgCl grains were closed and the ionic transport was mainly via micro-channels running through the AgCl grains. The Ohmic resistance of the continuous AgCl layer restricted the dissolution of the silver substrate. At high current densities and when the AgCl layer is thick, the conduction mechanism transitions from extrinsic, i.e. via electrolyte in the micro-channels, to intrinsic, i.e. via AgCl solid phase.
The micro-channels were accounted for ca. 4% volume fraction of the AgCl layer. The conductivity of the electrolyte inside the micro-channels was estimated to be on the order of 10−4 S/cm. The concentration of Cl− and Ag+ inside the micro-channels was estimated to be on the order of 10−6 mol/cm3 and 10−10 mol/cm3, respectively. The apparent conductivity of the AgCl layer was on the order of 10−6 to 10−5 S/cm and decreased with the film thickness. The exchange current density of the Ag/Ag+ redox reaction in 9 g/L NaCl was ca. 1.3×10⁻⁴ A/cm2.
In the current density range from 0.1 to 2 mA/cm2, the concentration overpotential at the silver electrode was negligible. When the AgCl is a non-continuous layer, the dissolution of silver is under activation control. When the AgCl layer is thin, i.e. on the order of several μm, the dissolution of silver is under mixed control of Ohmic overpotential through the AgCl layer and activation overpotential at the silver electrode. When the AgCl layer is thick, i.e. on the order of tens of μm or thicker, the dissolution of silver is controlled only by the Ohmic overpotential through the AgCl layer.
Acknowledgements
This research is supported by NIH-NINDS Grant No. NS-041809 and NIH-NIBIB Gran No. EB-001740, Development of Implantable Networked Neuroprosthesis System (NPPS), Principal Investigator Hunter Peckham. We are grateful to Dr. Brian Smith for his discussions and support along with others in the Cleveland Functional Electrical Stimulation (FES) Center at CWRU. This group provided technical support and assistance during this work. Useful discussions with Professor John Lewandowski and Professor Uziel Landau at CWRU are highly appreciated. The financial support of the Vietnam Education Foundation to one of the authors (HH) during the study is acknowledged.
Footnotes
Publisher's Disclaimer: This is a PDF file of an unedited manuscript that has been accepted for publication. As a service to our customers we are providing this early version of the manuscript. The manuscript will undergo copyediting, typesetting, and review of the resulting proof before it is published in its final citable form. Please note that during the production process errors may be discovered which could affect the content, and all legal disclaimers that apply to the journal pertain.
References
- 1.Sieckmann EF, Grunwald E. The Standard E.m.f. of the Silver-Silver Chloride Electrode and the Degenerate Activity Coefficient of Chloride Ion in the System Ethanol-Water1a. Journal of the American Chemical Society. 1954;76(14):3855–3856. [Google Scholar]
- 2.Carmody WR. A STUDY OF THE SILVER CHLORIDE ELECTRODE. Journal of the American Chemical Society. 1929;51(10):2901–2904. [Google Scholar]
- 3.Bro P, Marincic N. The High Rate Oxidation of Silver Electrodes in Chloride Solutions. Journal of The Electrochemical Society. 1969;116(10):1338–1341. [Google Scholar]
- 4.Katan T, Szpak S, Douglas NB. Silver/Silver Chloride Electrode: Reaction Paths on Discharge. Journal of The Electrochemical Society. 1973;120(7):883–888. [Google Scholar]
- 5.Szpak S, Nedoluha A, Katan T. Silver/Silver Chloride Electrode: Charging of a Porous Structure. Journal of The Electrochemical Society. 1975;122(8):1054–1063. [Google Scholar]
- 6.Jin X, et al. The electrochemical formation and reduction of a thick AgCl deposition layer on a silver substrate. Journal of Electroanalytical Chemistry. 2003;542:85–96. [Google Scholar]
- 7.Dunning J, Bennion D, Newman J. Analysis of Porous Electrodes with Sparingly Soluble Reactants. Journal of The Electrochemical Society. 1973;120(7):906–913. [Google Scholar]
- 8.Szpak S, Katan T. An Experimental Study of Reaction Profiles in Porous Electrodes. Journal of The Electrochemical Society. 1975;122(8):1063–1071. [Google Scholar]
- 9.Cachet C, et al. The Ag/Ag+ system: an impedance model for nucleation and growth. Journal of Electroanalytical Chemistry. 1979;100:745–757. [Google Scholar]
- 10.Birss VI, Smith CK. The anodic behavior of silver in chloride solution-I The formation and reduction of thin silver chloride films. Electrochemica Acta. 1987;32(2):259–268. [Google Scholar]
- 11.Lal H, Thirsk HR, Jones WFKW. A study of the behavior of polarized electrodes. Part I-The silver/silver halide system. Trans. Faraday Soc. 1951;47:70–77. [Google Scholar]
- 12.Giles RD. The anodic behaviour of silver single crystal electrodes in concentrated chloride solutions. Electroanalytical Chemistry and Interfacial Electrochemistry. 1970;27:11–19. [Google Scholar]
- 13.Burstein GT, Misra RDK. Growth of oxidized monolayers on scratched silver electrodes in chloride solutions. Electrochimica Acta. 1983;28(3):371–377. [Google Scholar]
- 14.Jaya S, Rao TP, Rao GP. Mono- and multilayer formation studied of silver chloride on silver electrodes from chloride-containing solutions. Journal of Applied Electrochemistry. 1987;17:635–640. [Google Scholar]
- 15.Jovic BM, Jovic VD, Drazic DM. Kinetics of chloride ion adsorption and the mechanism of AgCl layer formation on the (111), (100) and (110) faces of silver. Journal of Electroanalytical Chemistry. 1995;399(1-2):197–206. [Google Scholar]
- 16.Brolo AG, Sharma SD. Using probe beam deflection (PBD) to investigate the electrochemical oxidation of silver in perchlorate media in the presence and absence of chloride ions. Electrochimica Acta. 2003;48(10):1375–1384. [Google Scholar]
- 17.Bozzini B, Giovannelli G, Mele C. Electrochemical dynamics and structure of the Ag/AgCl interface in chloride-containing aqueous solutions. Surface and Coatings Technology. 2007;201(8):4619–4627. [Google Scholar]
- 18.Katan T, Szpak S, Douglas NB. Silver/Silver Chloride Electrodes: Surface Morphology on Charging and Discharging. Journal of The Electrochemical Society. 1974;121(6):757–764. [Google Scholar]
- 19.Payer JH, et al. Role of transport properties in corrosion product growth. Materials Science and Engineering: A. 1995;198:91–102. [Google Scholar]
- 20.Smith B, et al. An externally powered, multichannel, implantable stimulator-telemeter for control of paralyzed muscle. Biomedical Engineering, IEEE Transactions on. 1998;45(4):463–475. doi: 10.1109/10.664202. [DOI] [PubMed] [Google Scholar]
- 21.Smith B, et al. Development of an implantable networked neuroprosthesis. in Neural Engineering, 2005; Conference Proceedings. 2nd International IEEE EMBS Conference on; 2005. [Google Scholar]
- 22.Ha HM, Payer JH. Corrosion of Silver-cored MP35N LT Composite for Networked Neuroprosthetic System. Corrosion p. submitted. [Google Scholar]
- 23.Weast RC. Handbook of Chemistry and Physics. The Chemical Rubber Co.; Cleveland, OH: 1969. [Google Scholar]
- 24.Newman J, Thomas-Alyea KE. Electrochemical Systems. 3rd Edition John Wiley & Son, Inc.; 2004. [Google Scholar]
- 25.Beck TR, Rice DE. Conductivity of Anodic Silver Chloride during Formation. Journal of The Electrochemical Society. 1984;131(1):89–93. [Google Scholar]
- 26.Mehl W, Bockris JOM. Mechanism of Electrolytic Silver Deposition and Dissolution. The Journal of Chemical Physics. 1957;27(3):818–819. [Google Scholar]
- 27.Despic AR, Bockris JOM. Kinetics of the Deposition and Dissolution of Silver. The Journal of Chemical Physics. 1960;32(2):389–402. [Google Scholar]
- 28.Baltrunas G. The mechanism of electrode process in the system silver/silver cyanide complexes. Electrochimica Acta. 2003;48(24):3659–3664. [Google Scholar]
- 29.Saitou M. Kinetic Electrode Reactions in Silver Electrodeposition Using a Multipulse Current Measurement. Journal of The Electrochemical Society. 2005;152(3):C113–C115. [Google Scholar]
- 30.Senanayake G. The cyanidation of silver metal: Review of kinetics and reaction mechanism. Hydrometallurgy. 2006;81(2):75–85. [Google Scholar]


