

Three crystal structures of the molybdenum-cofactor biosynthesis protein MogA from two highly thermophilic organisms have been determined at high resolution. Comparative analyses revealed the residues involved in oligomerization. In addition, molecular-dynamics and docking studies suggested the binding affinities of several small molecules towards MogA and homologous proteins.
Keywords: MogA, molybdenum-cofactor biosynthesis proteins
Abstract
Molybdenum-cofactor (Moco) biosynthesis is an evolutionarily conserved pathway in almost all kingdoms of life, including humans. Two proteins, MogA and MoeA, catalyze the last step of this pathway in bacteria, whereas a single two-domain protein carries out catalysis in eukaryotes. Here, three crystal structures of the Moco-biosynthesis protein MogA from the two thermophilic organisms Thermus thermophilus (TtMogA; 1.64 Å resolution, space group P21) and Aquifex aeolicus (AaMogA; 1.70 Å resolution, space group P21 and 1.90 Å resolution, space group P1) have been determined. The functional roles and the residues involved in oligomerization of the protein molecules have been identified based on a comparative analysis of these structures with those of homologous proteins. Furthermore, functional roles have been proposed for the N- and C-terminal residues. In addition, a possible protein–protein complex of MogA and MoeA has been proposed and the residues involved in protein–protein interactions are discussed. Several invariant water molecules and those present at the subunit interfaces have been identified and their possible structural and/or functional roles are described in brief. In addition, molecular-dynamics and docking studies with several small molecules (including the substrate and the product) have been carried out in order to estimate their binding affinities towards AaMogA and TtMogA. The results obtained are further compared with those obtained for homologous eukaryotic proteins.
1. Introduction
The trace element molybdenum is required by almost all organisms and forms the catalytic centre of a large variety of enzymes that carry out important chemical reactions in the carbon, nitrogen and sulfur cycles (Rajagopalan, 1991 ▶). Molybdenum is bioavailable as molybdate, which is incorporated into metal cofactors such as iron-Moco (Fe-Moco) and pterin-based Moco by complex biological systems (Santos et al., 2004 ▶; Schwarz, 2005 ▶). The biosynthetic pathways of both cofactors involve a similar mechanism of scaffold formation, metal activation and cofactor insertion into molybdoenzymes (Schwarz et al., 2009 ▶). The molybdoenzymes catalyze redox reactions using the versatile redox chemistry of the metal controlled by cofactors (Hille, 2002 ▶) and are found in all kingdoms of life, with Saccharomyces being the sole exception amongst well known model organisms (Zhang & Gladyshev, 2008 ▶). A genetic deficiency of these enzymes leads to various autosomal recessive diseases with severe neurological symptoms, which may even lead to death in early childhood (Johnson et al., 1989 ▶; Reiss, 2000 ▶). The biosynthesis of Moco is highly conserved in all organisms, including humans, and can be broadly divided into three steps (Rajagopalan & Johnson, 1992 ▶; Schwarz, 2005 ▶). Firstly, GTP is converted to a cyclic pyranopterin monophosphate (cPMP) with the help of MoaA and MoaC (Wuebbens & Rajagopalan, 1993 ▶; Hanzelmann et al., 2002 ▶, 2004 ▶). Secondly, cPMP is converted to molydopterin (MPT) by MPT synthase, which consists of two large (MoaE) and two small (MoaD) subunits, with the help of the sulfurtransferase MoeB (Lake et al., 2001 ▶; Rudolph et al., 2001 ▶). In the last step, the adenylation of MPT and the insertion of molybdenum into MPT to produce active Moco is carried out by two proteins, MogA and MoeA, respectively, in the bacterial system, whereas the orthologues of MogA and MoeA in plants (Cnx1) and animals (gephyrin) are fused into a single two-domain structure (G and E domains). However, the domain arrangements in plants and animals are reversed. Cnx1G from Arabidopsis thaliana (AtCnx1G) binds MPT with high affinity compared with AtCnx1E and catalyzes the MPT-adenylation reaction, yielding MPT-AMP (Schwarz et al., 1997 ▶; Kuper et al., 2004 ▶; Llamas et al., 2004 ▶). Subsequently, the adenylated MPT is transferred to the Cnx1E domain, where it is hydrolyzed to release Moco in a metal-dependent (Mg2+ or Zn2+) reaction (Llamas et al., 2006 ▶).
Here, we report three crystal structures of MogA from the thermophilic Gram-negative bacteria Thermus thermophilus HB8 and Aquifex aeolicus VF5. The enzymes of thermophilic organisms are not only thermostable but are also more resistant to chemical agents than their mesophilic homologues (Sterner & Liebl, 2001 ▶; Vieille & Zeikus, 2001 ▶). Although Moco biosynthesis is quite well understood in bacteria and eukaryotes, it is still not clear in the case of archaeal systems. Nearly all archaeal organisms contain MoaB (a homologue of MogA), whereas bacterial systems contain either MoaB or MogA, with Escherichia coli being an exception that contains both. Since MoaB from E. coli (EcMoaB) is inactive despite binding MPT, its functional role is still unclear (Bevers et al., 2008 ▶). Both organisms in the present study (T. thermophilus and A. aeolicus) contain MogA. Interestingly, gene TTHA0341 of T. thermophilus HB8 has been annotated as MoaB in the genomic database (CMR). However, based on our comparative analysis with known structural and experimental results, TTHA0341 is considered as MogA in the following (see §3 for details). Comparative analysis of MogA and its homologues MogA from E. coli (EcMogA; Liu et al., 2000 ▶) and Shewanella oneidensis (SoMogA), MoaB from E. coli (EcMoaB; Bader et al., 2004 ▶; Sanishvili et al., 2004 ▶), Bacillus cereus (BcMoaB) and Sulfolobus tokodaii (StMoaB; Antonyuk et al., 2009 ▶), Cnx1G from Arabidopsis thaliana (AtCnx1G; Kuper et al., 2004 ▶) and GephG from Homo sapiens (HsGephG; Schwarz et al., 2001 ▶) and Rattus norvegicus (RnGephG; Sola et al., 2001 ▶) revealed the functional role of the TtMogA and AaMogA proteins.
2. Materials and methods
2.1. Cloning, expression and protein purification
The cloning, expression and protein purification of TtMogA have been described previously (Kanaujia et al., 2007 ▶). For AaMogA, the following procedure was used. The mog gene (aq_061) was amplified by PCR using Aquifex aeolicus VF5 genomic DNA as the template. The amplified fragment was cloned under the control of the T7 promoter of the E. coli expression vector pET-21a (Novagen). The expression vector was introduced into the E. coli BL21-CodonPlus (DE3)-RIL strain (Stratagene) and the recombinant strain was cultured in 4.5 l LB medium supplemented with 50 µg ml−1 ampicillin. The cells (15.4 g) were collected by centrifugation, washed with 20 ml buffer A (20 mM Tris–HCl pH 8.0) containing 0.5 M NaCl, 5 mM 2-mercaptoethanol and 1 mM phenylmethanesulfonyl fluoride and resuspended in 15 ml of the same buffer. The cells were then disrupted by sonication in a chilled water bath and the cell lysate was incubated at 363 K for 11.5 min. The sample was centrifuged at 15 000g for 30 min and the supernatant was desalted by fractionation on a HiPrep 26/10 desalting column (GE Healthcare Biosciences) pre-equilibrated with buffer A. The sample was then applied onto a Toyopearl SuperQ-650M (Tosoh Corp.) column pre-equilibrated with the same buffer, which was eluted with a linear gradient of 0–0.4 M NaCl. The eluted fractions containing the recombinant MogA protein were collected, desalted by fractionation on a HiPrep 26/10 desalting column pre-equilibrated with buffer A and applied onto a Resource Q column (GE Healthcare Biosciences) pre-equilibrated with the same buffer, which was eluted with a linear gradient of 0–0.3 M NaCl. The eluted fractions containing the MogA protein were pooled, desalted by fractionation on a HiPrep 26/10 desalting column pre-equilibrated with 10 mM potassium phosphate buffer pH 7.0 and then applied onto a hydroxyapatite CHT20-I column (Bio-Rad Laboratories), which was eluted with a linear gradient of 10–500 mM potassium phosphate buffer pH 7.0. The sample containing the MogA protein was then loaded onto a HiLoad 16/60 Superdex 200 pg column (GE Healthcare Biosciences) pre-equilibrated with buffer A containing 0.2 M NaCl. The fractions containing MogA protein were concentrated to 2.7 ml with a Vivaspin 20 concentrator (5000 molecular-weight cutoff; Sartorius). The protein concentration was 24 mg ml−1 as determined by measuring the absorbance at 280 nm (Kuramitsu et al., 1990 ▶).
2.2. Crystallization, data collection and data processing
The crystallization and data collection of TtMogA have been described elsewhere (Kanaujia et al., 2007 ▶). For the crystallization of AaMogA, the purified protein sample was screened for preliminary crystallization conditions using Wizard Cryo II. Diffraction-quality crystals were obtained as two forms from different conditions. The first crystal form (P21) was obtained from 1 µl protein solution and 1 µl reservoir solution equilibrated against 200 µl reservoir solution using the sitting-drop vapour-diffusion method. The reservoir solution consisted of 40%(v/v) PEG 600, 100 mM CHES buffer pH 9.5. The second form of the crystal (P1) was obtained using the same drop ratio with a reservoir solution consisting of 0.2 M ammonium acetate, 0.1 M bis-tris pH 5.5, 25%(w/v) PEG 3350. Diffraction-quality crystals of both forms appeared within a week. The first crystal form was mounted without any cryoprotectant; however, the second crystal form was soaked in precipitant solution consisting of 20%(w/v) PEG 3350 for a short while prior to flash-freezing and X-ray exposure. The X-ray diffraction data were collected at 100 K on the RIKEN Structural Genomics Beamline II (BL26B2) at SPring-8 (Hyogo, Japan) using a Jupiter210 CCD detector (Rigaku MSC Co., Tokyo, Japan). The crystal-to-detector distance was maintained at 150 mm. The data were processed using the HKL-2000 suite (Otwinowski & Minor, 1997 ▶). Data-collection and processing statistics for all three crystals are given in Table 1 ▶.
Table 1. X-ray data-collection and refinement statistics for TtMogA and AaMogA.
Values in parentheses are for the highest resolution shell.
| TtMogA | AaMogA (P21) | AaMogA (P1) | |
|---|---|---|---|
| Data collection | |||
| Wavelength () | 1.0 | 1.0 | 1.0 |
| Temperature (K) | 100 | 100 | 100 |
| Space group | P21 | P21 | P1 |
| Unit-cell parameters | |||
| a () | 33.94 | 39.41 | 40.02 |
| b () | 103.32 | 113.16 | 64.07 |
| c () | 59.59 | 55.98 | 102.34 |
| () | 95.1 | ||
| () | 101.3 | 93.4 | 98.1 |
| () | 106.9 | ||
| Resolution range () | 50.01.64 (1.701.64) | 50.01.70 (1.761.70) | 501.90 (1.971.90) |
| No. of reflections | |||
| Total | 253272 | 283367 | 205366 |
| Unique | 48481 (4585) | 53022 (5250) | 71606 (7110) |
| Completeness (%) | 98.7 (93.0) | 99.6 (99.9) | 96.4 (95.5) |
| V M (3Da1) | 1.90 | 2.19 | 2.28 |
| Solvent content (%) | 35.2 | 43.8 | 46.1 |
| Average multiplicity | 5.2 | 5.3 | 2.9 |
| I/(I) | 23.3 (2.5) | 33.5 (3.6) | 21.7 (4.3) |
| R merge † (%) | 6.3 (25.5) | 5.4 (26.7) | 4.4 (21.9) |
| Refinement | |||
| R work/R free (%) | 19.2/21.7 | 19.5/22.7 | 20.8/23.9 |
| No. of subunits in ASU | 3 | 3 | 6 |
| No. of atoms | |||
| Protein | 3675 | 3990 | 7815 |
| Water | 562 | 625 | 953 |
| Others | 2 | 8 | 1 |
| Deviations from ideal geometry | |||
| Bond lengths () | 0.005 | 0.006 | 0.006 |
| Bond angles () | 1.3 | 1.3 | 1.2 |
| Dihedral angles () | 22.8 | 23.0 | 23.1 |
| Improper angles () | 0.96 | 0.97 | 0.93 |
| Average B factors (2) | |||
| Protein | 23.8 | 25.1 | 31.6 |
| Water | 35.1 | 36.6 | 35.2 |
| Others | 36.7 | 43.5 | 35.5 |
| Ramachandran plot (%) | |||
| Favoured | 91.7 | 91.8 | 90.4 |
| Allowed | 8.3 | 8.2 | 9.6 |
| PDB code | 3mch | 3mci | 3mcj |
R
merge = 
 , where I(hkl) is the intensity of reflection hkl,
  is the sum over all reflections and
  is the sum over i measurements of reflection hkl.
2.3. Structure solution, refinement and validation
All three crystal structures were solved by the molecular-replacement (MR) method using the program Phaser (McCoy et al., 2007 ▶). In the case of TtMogA the atomic coordinates of gephyrin (PDB code 1jlj; Schwarz et al., 2001 ▶) were used as the search model. The search model has 50% amino-acid sequence identity to TtMogA and preliminary calculations (Matthews, 1968 ▶) suggested the presence of three monomers in the asymmetric unit. The crystal structure solution of AaMogA was obtained using the atomic coordinates of SoMogA (PDB code 2fuw; C. Chang, L. J. Bigelow & A. Joachimiak, unpublished work) as a search model. The search model used in MR has 69% sequence identity to AaMogA. The Matthews coefficient V M (Matthews, 1968 ▶) was calculated to be 2.19 Å3 Da−1, suggesting the presence of three monomers in the asymmetric unit. The solution of the structure of the other form of AaMogA was obtained using the refined model of the first form. As suggested by the Matthews coefficient (2.28 Å3 Da−1), six monomers were searched for in the asymmetric unit using a monomer as the search model.
In summary, a total of 5% of reflections were kept aside for the calculation of R free (Brünger, 1992 ▶). The solution obtained from the MR calculation was subjected to rigid-body refinement using CNS v.1.2 (Brünger et al., 1998 ▶). Subsequently, positional refinement (50 cycles) was performed. The models were subjected to simulated annealing by heating the system to 3000 K and slow cooling to 100 K at a rate of 10 K per step. Furthermore, the models were subjected to 30 cycles of B-factor refinement. In the next step, the amino acids in the models were replaced by the corresponding primary structure and refined. In all three cases, R and R free fell to below 30% at this stage. Subsequently, water O atoms were located at 2.8σ and 0.8σ in 2F o − F c and F o − F c difference electron-density maps, respectively, and at a distance of 3.5 Å from polar groups of the protein molecule or water molecules. The final refinement statistics of all the crystal structures are given in Table 1 ▶. In brief, the molecular-modelling program Coot (Emsley & Cowtan, 2004 ▶) was used to display the electron-density maps for model fitting and adjustments. All atoms were refined with unit occupancies. Refinement was carried out using the program CNS (Brünger et al., 1998 ▶). Simulated-annealing OMIT maps were calculated to correct or check the final protein models. The program PROCHECK (Laskowski et al., 1993 ▶) was used to check and validate the quality of the final refined models. The atomic coordinates and structure factors of TtMogA (PDB code 3mch) and AaMogA (PDB codes 3mci and 3mcj) have been deposited in the RCSB Protein Data Bank (Berman et al., 2000 ▶).
2.4. Molecular-dynamics simulations
Molecular-dynamics (MD) simulations were performed using the package GROMACS v.4.0.4 running on parallel processors (van der Spoel et al., 2005 ▶; Hess et al., 2008 ▶). The AMBER force-field port for the GROMACS suite was used for all of the simulations (Duan et al., 2003 ▶; Sorin & Pande, 2005 ▶). All crystallographic water molecules were removed from the protein models before MD simulations. A cubic box was generated using the module editconf of GROMACS with the criterion that the minimum distance between the solute and the edge of the box was at least 0.75 nm. The protein models were solvated with the SPC (simple point charge) water model using the program genbox available in the GROMACS suite. All of the ligand molecules were modelled (using the program Coot) in the active site of the respective protein molecules based on the crystal structure of AtCnx1G (PDB code 1uuy; Kuper et al., 2004 ▶) bound to adenylated molybdopterin (MPT-AMP). H atoms were added to the ligand molecules using the PRODRG web server (Schüttelkopf & van Aalten, 2004 ▶). The parameters derived from AMBER03 (Case et al., 2006 ▶) were used to generate ligand topologies, which were further converted to GROMACS format using a Perl script (amb2gmx.pl). Furthermore, the partial charges of the ligands were optimized using the ab initio program Gaussian03 (Frisch et al., 2004 ▶). Chloride and sodium ions were used (wherever needed) to neutralize the overall charge of the system. Energy minimization was performed using the conjugate-gradient and steepest-descent methods with a frequency of the latter of 1 in 1000 with a maximum force cutoff of 1 kJ mol−1 nm−1 for convergence of minimization. Subsequently, solvent equilibration by position-restrained dynamics for 10 ps was carried out. Simulations utilized the NPT ensembles with Parrinello–Rahman isotropic pressure coupling (τp = 0.5 ps) to 100 kPa and Nose–Hoover temperature coupling (τt = 0.1 ps) to 300 K. Long-range electrostatics were computed using the Particle Mesh Ewald (PME; Darden et al., 1993 ▶) method with a cutoff of 1.2 nm. A cutoff of 1.5 nm was used to compute the long-range van der Waals interactions. Bond lengths were constrained with the LINCS algorithm (Hess et al., 1997 ▶). MD was performed for a time period of 50 ns for all of the simulations discussed in the present study. However, the first 5 ns of the trajectories were excluded from the analysis to allow the system to equilibrate. The protein–ligand interaction energies were calculated using the equation
where E protein–ligand denotes the interaction energy between protein and ligand and ‘elec’ and ‘vdw’ denote the electrostatics and van der Waals components of the energy, respectively.
2.5. Molecular docking
Molecular docking of the compounds with the protein molecules was performed using the program AutoDock v.3.0.5 (Morris et al., 1998 ▶). The three-dimensional atomic coordinates of TtMogA and AaMogA were taken from the final refined models, whereas in the cases of EcMoaB (PDB code 1mkz; Sanishvili et al., 2004 ▶), AtCnx1G (PDB code 1uux; Kuper et al., 2004 ▶) and EcMoeA (PDB code 1g8l; Xiang et al., 2001 ▶) they were downloaded from the locally maintained anonymous FTP server at the Bioinformatics Centre, Indian Institute of Science, Bangalore, India. All crystallographic water molecules were removed from the protein molecule. For comparison, the partial charge for each atom of the ligand molecules was kept the same as in the MD simulations. The solvation parameters were added using the addsol module of AutoDock. A grid box of 60 × 60 × 60 points in the x, y and z dimensions was used with a grid spacing of 0.375 Å. The grid was automatically centred at the central point of the ligand molecules modelled in the active site. The electrostatic and atomic interaction maps for all atom types of the ligand molecules were calculated using the module autogrid of the AutoDock program. The docking calculations were allowed to run for 250 runs using the Lamarckian genetic algorithm (LGA) for the global search and a Solis and Wets algorithm for the local search with an initial population size of 50. The values for other parameters were taken as the defaults implemented in the program. The final docked conformations of the ligand molecules in the active site were clustered using a root-mean-square deviation (r.m.s.d.) tolerance of 1 Å.
2.6. Structural analysis
The freely available web server PDB Goodies (Hussain et al., 2002 ▶) was used at various stages of the refinement and analysis. Multiple sequence alignment (MSA) was performed using the program ClustalW v.2 (Larkin et al., 2007 ▶) and was rendered using the program ESPript (Gouet et al., 1999 ▶). The secondary-structure elements of the protein were assigned using the program DSSP (Kabsch & Sander, 1983 ▶). Invariant water molecules were identified using the 3dSS web server (Sumathi et al., 2006 ▶). Protein surface cavities were identified and measured using the program SURFNET (Laskowski, 1995 ▶). Figures were generated using the program PyMOL (DeLano Scientific; http://www.pymol.org). Electrostatic potentials were calculated using the APBS (Baker et al., 2001 ▶) module plugged into PyMOL. Structures were superposed using the program ALIGN (Cohen, 1997 ▶). Hydrogen bonds were calculated using the program HBPLUS (McDonald & Thornton, 1994 ▶). A donor–hydrogen–acceptor angle of greater than or equal to 120° and a donor–acceptor distance of less than or equal to 3.5 Å were used as criteria for the identification of hydrogen bonds. The solvent-accessible surface area of invariant water molecules was computed using the program NACCESS (Hubbard & Thornton, 1993 ▶) with a probe radius of 1.4 Å. Water molecules with an accessible surface area of less than or equal to 2.5 Å2 were considered to be internal/buried water molecules. The normalized temperature factor (B i′) for all the invariant water molecules was calculated using the formula B i′ = (B i − 〈B〉)/σ(B), where B i is the B factor of each atom, 〈B〉 is the mean B factor and σ(B) is the standard deviation of the B factors. Most of the MD analyses were performed using the GROMACS tools and locally developed Perl scripts. Graphs were prepared using Xmgrace (Paul J. Turner, Center for Coastal and Land-Margin Research Oregon Graduate Institute of Science and Technology Beaverton, Oregon).
3. Results and discussion
3.1. General results
3.1.1. Annotation of TTHA0341 as MogA
Gene TTHA0341 of T. thermophilus HB8 was annotated as MoaB in the genomic database (CMR). All MoaB and MogA proteins belong to a single family called the MoaB–MogA-like family owing to their identical function. However, they differ in their oligomeric states. Our analyses suggest that the TTHA0341 gene is more like MogA than MoaB and the following points support this conclusion. (i) The other strain of T. thermophilus (i.e. HB27) contains the same protein with a single mutation (K159R) and has been annotated as MogA. (ii) On searching the operon databases (Okuda et al., 2006 ▶), only the mog operon could be found in T. thermophilus. (iii) Multiple sequence alignment of TTHA0341 with other MoaB and MogA proteins clearly shows higher sequence identity to MogA than to MoaB (see §3.2.2). (iv) Phylogenetic analysis of the multiple sequence alignment grouped TTHA0341 into the cluster containing MogA proteins (see §3.2.4). (v) It is known that MoaB proteins form hexamers in addition to trimers (Sanishvili et al., 2004 ▶) and the surface analysis of TTHA0341 suggested that it is stable in the trimeric form (see oligomerization for details). Thus, by considering the above points, it is concluded that gene TTHA0341 corresponds to a MogA protein (hereafter referred to as TtMogA).
3.1.2. Protein activity
Hereafter, unless mentioned otherwise, the numbering scheme and analysis are those of the TtMogA structure. A previous study of MoaB from Pyrococcus furiosus (PfMoaB) and EcMoaB suggested that EcMoaB was inactive; however, it can bind to MPT (Bevers et al., 2008 ▶). Thus, it was important to determine whether the TtMogA and AaMogA proteins are active or inactive. Therefore, we analyzed the sequences of all known active and inactive proteins. We found that Glu46, Arg77 and Thr80 (Asp57, Arg87 and Thr90, respectively, in PfMoaB), which were suggested to be the residues most likely to affect the activity of EcMoaB, are conserved in both the TtMogA and AaMogA proteins. Studies by Llamas et al. (2004 ▶) have shown that Ser10, Asp20, Asp45 and Arg77 are responsible for MPT binding. In addition, the single mutants D32A and D56A from site-directed mutagenesis of PfMoaB (Asp20 and Asp45, respectively, in TtMogA) showed almost no activity. Moreover, a mutation study of Ser112 (PfMoaB), which is highly conserved in all of these proteins except for TtMogA (in which it is substituted by Gly103), showed the mutant to be active (Bevers et al., 2008 ▶). Thus, comparing the sequences of and experimental results for proteins homologous to TtMogA and AaMogA, it can be concluded that the TtMogA and AaMogA proteins are active and are likely to play a role in MPT adenylation. However, it is known that Thr83 and Ser114 in AtCnx1G (Thr72 and Gly103, respectively, in TtMogA) are crucial for its catalytic activity. Ser114 is important as it directly interacts with the N2 atom of MPT. In TtMogA, loop L9 containing this residue is distant from the active site. Since the interaction takes place through the side chain of the serine residue, it might have some consequence for the activity of TtMogA.
3.2. Crystallographic results
3.2.1. Overall structure and active site of TtMogA and AaMogA
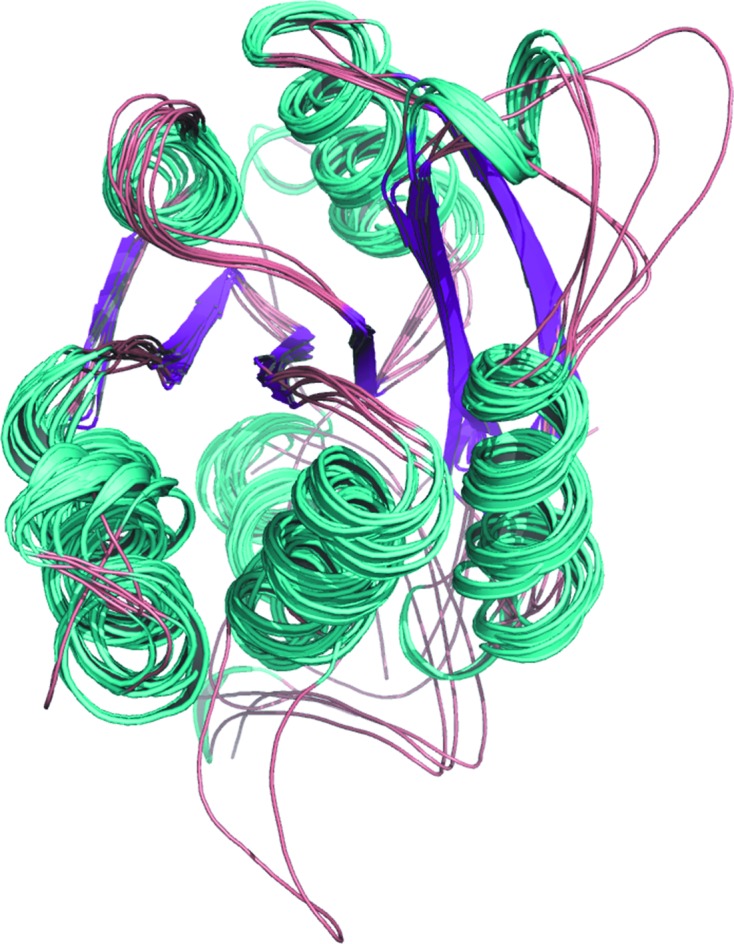
The asymmetric unit of TtMogA consists of three crystallographically independent molecules (Table 1 ▶) containing residues 1–159, 1–163 and 1–159 (of 164). The monomeric dimensions of TtMogA are ∼42 × 38 × 45 Å. Each monomer consists of seven α-helices, six β-strands and two 310-helices. The overall tertiary structure of the protein belongs to the Rossmann-like fold (Fig. 1 ▶). The twisted central β-sheet is sandwiched between the seven α-helices (five on one side and two on the other). All of the β-strands in the sheet are parallel except for β5. The two C-terminal α-helices (α6 and α7) are connected by a 310-helix (η2); the conserved residue Pro144 in η2 induces a kink of 72° between the α-helices. Helix α1 is perpendicular to all of the helices. The other six helices α2–α7 are parallel to each other, with the exception of α5.
Figure 1.

The overall three-dimensional structure of TtMogA. The secondary-structural elements and loops are labelled. The AMP-binding and MPT-binding sites (AMPBS and MPTBS, respectively) are indicated by arrows.
The crystal structure of AaMogA has been solved in two forms. The asymmetric units of the two forms contain three and six subunits (Table 1 ▶). In both forms, most of the residues were clearly observed in the difference electron-density (2F o − F c and F o − F c) maps, except for two or three residues at the N- and/or C-terminus in some subunits. In form II, electron density for residues 15–22 was not clear in two subunits. The overall three-dimensional structure of AaMogA is similar to that of TtMogA, with an r.m.s.d. of 1.4 Å, except at the terminal residues.
Residues from helices α5, α6 and η1, strand β1 and loops L1, L5 and L6 surround the active-site depression and can be divided into two parts based on the crystal structure of AtCnx1G (PDB code 1uuy), namely the MPT-binding site (MPTBS) and AMP-binding site (AMPBS) (Fig. 1 ▶). Gly70 and Gly130 in loops L6 and L12, respectively, separate the two sites. Thr72, Met99, Ala110, Ser113, Pro129 and Ser138 contribute to forming the floor of the MPTBS depression. Similarly, Val9, Ser10, Asp20, Thr22, Asp45, Asn69 and Asp78 are involved in formation of the floor of the AMPBS.
3.2.2. Sequence comparison
A search for MoaB and MogA proteins in the Swiss-Prot sequence database resulted in a total of 31 reviewed and manually curated nonredundant sequences. A multiple sequence alignment of 15 sequences (six for MogA, one each for Cnx1G, GephG and cinnamon and six for MoaB) is shown in Fig. 2 ▶(a). Protein sequences were chosen based on the criterion that their structure and/or experimental results were known. The sequence alignment shows that the GGTG signature motif is highly conserved in these proteins across species. Thr72 in this motif is involved in pyrophosphate-bond formation and/or pyrophosphate release (Llamas et al., 2004 ▶). The functionally important residues Ser10, Asp20, Asp45 (except in EcMoaB) and Asp78 are also conserved in these proteins (Kuper et al., 2003 ▶; Llamas et al., 2004 ▶). Another sequence motif PGX is also conserved with a mutation in the third position. In MoaB proteins X is a serine residue; however, MogA proteins show no conservation at this position. In MogA proteins X can be asparagine, lysine or glutamine (Fig. 2 ▶ a). In the crystal structure of the ligand-bound form of AtCnx1G, the Nδ2 atom of Asn142 (Ser131 in TtMogA) of the PGX motif interacts with the O4 atom of MPT. This suggests that the mutation of Asn142 to a lysine or a glutamine may be acceptable, whereas that to a serine is not. However, a study of PfMoaB, which contains serine at this position, showed that the PfMoaB protein is active (Bevers et al., 2008 ▶).
Figure 2.

(a) Multiple sequence alignment of MogA, MoaB, Cnx1G and GephG sequences. The protein sequences are taken from Swiss-Prot. The alignment was generated using ClustalW (Larkin et al., 2007 ▶). Consensus sequence calculation was performed using a threshold of 80% for the conserved residues. Completely conserved residues are shown as white letters on a red background and semi-conserved residues are shown in red and boxed. Secondary-structural elements are shown for TtMogA (top) and EcMoaB (bottom). (b) The phylogenetic tree obtained from multiple sequence alignment of MogA, MoaB, Cnx1G and GephG; the proteins that are known to form hexameric and trimeric oligomers are labelled. (c) The entropy difference (ΔS) as a function of alignment site. The differences are taken between the hexameric and the trimeric clusters. The alignment sites are given according to the TtMogA sequence in the multiple sequence alignment.
In addition, the semi-conserved residue Asp11 forms an ion pair with Arg77. The corresponding residue in EcMoaB is replaced by a glycine, which affects its activity (Bevers et al., 2008 ▶). While most of the homologous proteins maintain the conservation of this ion pair, StMoaB and EcMoaB show differences (natural mutation to threonine). Notably, the ion pair is involved in raising the wall near the AMPBS. Furthermore, two conserved residues, Asp45 and Asp78, have been shown to be essential for MPT binding and/or Mg2+ coordination (Sola et al., 2001 ▶; Llamas et al., 2004 ▶; Sanishvili et al., 2004 ▶). Another feature which might play a role in inactivating EcMoaB is the binding of molybdenum in the active site. It has been observed that a water molecule and His148 (Tyr154 in AaMogA) or two water molecules in AtCnx1G are responsible for binding the metal copper (Kuper et al., 2004 ▶). In contrast, in EcMoaB this position is replaced by alanine. Sequence comparison also revealed that Ala83 is only replaced by threonine or serine in the archaeal proteins StMoaB and PfMoaB, although its role is not clear (Fig. 2 ▶ a).
3.2.3. Sequence determinants of quaternary structure
The phylogenetic tree obtained from the MSA of MoaB, MogA and homologues reveals that proteins that form hexameric (MoaB) and trimeric (MogA) quaternary structures are clustered separately (Fig. 2 ▶ b) and suggests that the sequences of these two types of proteins determine their oligomeric states. Thus, an analysis of the sequences and available structures was carried out in order to identify the residues involved in this feature. Firstly, the residues involved in trimer–trimer interactions were identified in the crystal structures of EcMoaB, BcMoaB and StMoaB. The identified residues were Arg54, Tyr55, Arg58, Ala59, Ser62, Ala63, Ile65, Ala66, Pro93, Leu94 and Asp96 in EcMoaB (see Fig. 2 ▶ a for the corresponding residues in BcMoaB and StMoaB). A pairwise sequence alignment of TtMogA and EcMoaB revealed that Glu46, Asp59, Arg120 and Gly121 (in TtMogA) may be involved in hexamerization. However, Glu46 and Gly121 are less favourable since these are chemically similar to the corresponding residues of EcMoaB. Thus, Asp59 and Arg120 are the residues that strongly contribute to the formation of the oligomer.
Furthermore, the reduced entropy was calculated for all the ungapped sites in the MSA (Fig. 2 ▶ a), which resulted in 135 such sites (referred to in the following as alignment sites). The sequences were grouped into two clusters: (i) the MogA group containing TtMogA, AaMogA, EcMogA, SoMogA, Helicobacter pylori MogA (HpMogA), Haemophilus influenzae MogA (HiMogA), HsGephG and AtCn1xG and (ii) the MoaB group containing EcMoaB, BcMoaB, StMoaB, PfMoaB, Bacillus subtilis MoaB (BsMoaB) and Staphylococcus aureus MoaB (SaMoaB). The entropy values were calculated for both of the clusters separately. The amino acids were grouped into the following physicochemical classes: aromatic (Phe, Tyr and Trp), bulky aliphatic (Leu, Ile, Val and Met), small nonpolar (Gly and Ala), acidic or amide (Glu, Asp, Gln and Asn), basic (Lys, Arg and His), those with hydroxyl groups (Ser and Thr) and others (Pro and Cys) (Ptitsyn, 1998 ▶). The entropy values were calculated using the formula
where σ is the given class of amino acids, c is the number of classes considered and p σ(i) is the frequency of residues belonging to amino-acid type σ at position i in the sequence alignment. m is the number of amino-acid types for which p σ(i) ≠ 0 and n is the number of sequences analyzed. The second term corrects a systematic bias in the estimation of the entropy (Roulston, 1999 ▶). To study the entropic effect between hexameric and trimeric proteins, we calculated the entropy difference for each alignment site,
where the first term is the reduced entropy of a site in a hexameric cluster and the second term is that in a trimeric cluster. The calculated entropy difference for each alignment site is shown in Fig. 2 ▶(c). Although the numbers of sites above and below the baseline (with zero entropy) are similar, a total of eight sites (23, 34, 47, 64, 98, 106, 115 and 131) show a significant entropy difference of less than 1.0. Of these, five (47, 64, 106, 115 and 131) are worth mentioning. At site 47 the hexameric proteins contain positively charged residues, whereas the trimeric proteins show no amino-acid conservation. However, AaMogA and HpMogA contain a positively charged residue (arginine) at this site. Thus, this site alone is not responsible for determining the oligomeric state. A similar pattern is also found at sites 64 and 106. However, two sites, 115 and 131, along with other sites and possibly other properties of hexameric proteins, seem to have a high probability of being involved in determining the oligomeric state. At site 115 hexameric proteins contain a conserved alanine residue, whereas this site is dominated by a glutamine residue in the trimeric proteins. Site 131 belongs to the PGX motif (see §3.2.2 for details). It is interesting to note that although the GGTG motif is conserved among homologues, another sequence motif PGS is only conserved in MoaB proteins, with the exception of HsGephG. The serine residue in this motif is replaced by a lysine or glutamine, with the exception of AtCnx1G (where it is replaced by an asparagine).
3.2.4. Structural comparison
Pairwise structural superposition of all of the structures shows a high similarity at the tertiary level. Remarkably, even though the sequence similarities among these proteins are low (ranging from 16 to 69%), their overall three-dimensional structures are very similar (Table 2 ▶). The r.m.s.d. values show that TtMogA is very similar to HsGephG and AaMogA is very similar to SoMogA (Table 2 ▶). In general, the N- and C-terminal residues show greater dissimilarity. In addition, the regions 12–18, 25–35 and 95–115 show high r.m.s.d.s compared with the other regions (Fig. 3 ▶). The regions 12–18 and 95–115 belong to loops L2 and L9 and are very close to the AMPBS and the MPTBS, covering the active-site-like wall from both sides. It is notable that loop L9 also shows movement during the opening and closing process of the active-site channel (see §3.2.5 for details). The region 25–35 belongs to α2 and L2. However, the reason for its high flexibility is not clear.
Table 2. Pairwise r.m.s.d. values for all structures.
The pairwise sequence-similarity scores obtained from multiple sequence alignment of these sequences are given in parentheses. The diagonal elements have 100% sequence similarity.
| TtMogA | AaMogA | EcMogA | SoMogA | AtCnx1G | HsGephG | EcMoaB | BcMoaB | StMoaB | |
|---|---|---|---|---|---|---|---|---|---|
| TtMogA | 0 | 1.4 (43) | 1.5 (40) | 1.5 (42) | 2.3 (44) | 1.1 (45) | 1.3 (30) | 1.3 (26) | 1.5 (23) |
| AaMogA | 0 | 0.9 (55) | 0.6 (69) | 1.0 (39) | 1.1 (41) | 1.1 (17) | 1.0 (18) | 1.3 (17) | |
| EcMogA | 0 | 0.9 (55) | 1.1 (32) | 2.0 (35) | 1.5 (18) | 1.2 (18) | 1.5 (16) | ||
| SoMogA | 0 | 1.3 (40) | 1.2 (41) | 1.3 (48) | 1.3 (20) | 1.6 (16) | |||
| AtCnx1G | 0 | 1.0 (49) | 1.4 (22) | 1.4 (26) | 1.4 (22) | ||||
| HsGephG | 0 | 1.2 (25) | 1.3 (24) | 1.9 (27) | |||||
| EcMoaB | 0 | 1.0 (38) | 1.0 (25) | ||||||
| BcMoaB | 0 | 0.9 (39) | |||||||
| StMoaB | 0 |
Figure 3.
Overall tertiary structural superposition of TtMogA, AaMogA, EcMogA, SoMogA, AtCnx1G, HsGephG, EcMoaB, BcMoaB and StMoaB. For clarity, all structures are shown in the same colours.
3.2.5. Protein surface analysis
An analysis of the charge distribution of all MogA (TtMogA, AaMogA, EcMogA and SoMogA) and MoaB (EcMoaB, BcMoaB and StMoaB) proteins and their eukaryotic homologues AtCnx1G and HsGephG shows that the active sites of these proteins are more or less uniform in nature, with the MPTBS positively charged and the AMPBS negatively charged. However, the overall charge distribution of these proteins varies substantially. The protein surface of TtMogA is mostly positively charged, whereas those of the other homologues are negatively charged. A investigation of the amino-acid compositions of all of these proteins revealed that TtMogA contains marginally more positively charged residues (14%) than negatively charged residues (13%), in contrast to other homologous proteins which consist of fewer positively charged residues compared with negatively charged residues (Table 3 ▶). Interestingly, 91% of the positively charged residues of TtMogA are on the protein surface and the remaining residues are buried upon trimerization. In contrast, only 76% of the negatively charged residues of TtMogA are on the protein surface. Furthermore, the number of ion pairs found in TtMogA and AaMogA are also high compared with other proteins (Table 3 ▶). It is known that ion pairs (in addition to other factors) play a significant role in stabilizing the structure and function of thermophilic proteins (Karshikoff & Ladenstein, 2001 ▶).
Table 3. Charged amino-acid compositions, hydrogen bonds and ion pairs in all of the proteins.
Percentage values are given in parentheses.
| Protein | Protein length | No. of positively charged residues | No. of negatively charged residues | No. of hydrogen bonds owing to charged residues | No. of ion pairs |
|---|---|---|---|---|---|
| TtMogA | 164 | 23 (14.0) | 21 (12.8) | 71 (43.3) | 10 |
| AaMogA | 178 | 23 (12.9) | 24 (13.4) | 77 (43.3) | 14 |
| EcMogA | 195 | 18 (9.2) | 26 (13.3) | 85 (43.6) | 11 |
| SoMogA | 177 | 19 (10.7) | 27 (15.2) | 68 (38.4) | 9 |
| AtCnx1G | 161 | 16 (9.9) | 22 (13.6) | 58 (36.0) | 4 |
| HsGephG | 167 | 18 (10.7) | 23 (13.7) | 78 (46.7) | 7 |
| EcMoaB | 170 | 18 (10.5) | 22 (12.9) | 72 (42.4) | 6 |
| BcMoaB | 169 | 22 (13.0) | 24 (14.2) | 68 (40.2) | 5 |
| StMoaB | 178 | 24 (13.4) | 24 (13.4) | 72 (40.5) | 3 |
Analysis of protein surfaces results in another interesting feature of these proteins. Near the MPTBS, a surface channel (hereafter referred to as the active-site channel; ASC) is observed which has two states (open or closed). It is observed that TtMogA has an open ASC, whereas AaMogA, AtCnx1G, HsGephG and EcMoaB have closed ASCs (Fig. 4 ▶ a). Interestingly, the BcMoaB and StMoaB proteins show an intermediate state (Fig. 4 ▶ a). The crystal structure of TtMogA shows that the residues in loop L9 forming the ASC are too far away from the active site to form the closed state. However, the other proteins contain helices in this region and are observed to be in the closed state (Fig. 4 ▶ b). Although the structural and/or functional role of the ASC does not seem to be trivial, it is tempting to speculate that it might play a role in substrate (MPT) entry into the active site. Analysis of the surface cavities of all the available crystal structures of MoaB and MogA and their eukaryotic homologues revealed that the TtMogA and AtCnx1G proteins have similar active-site cavities (volume of ∼2000 Å3), whereas the active-site volumes of the other homologues range from 1000 to 1500 Å3. This suggests that TtMogA can bind a similar molecule as in the case of AtCnx1G.
Figure 4.

(a) Left: the electrostatic potential charge distribution at the active sites of TtMogA (top left), AaMogA (top right), EcMogA (bottom left) and AtCnx1G (bottom right). The two binding sites (AMPBS and MPTBS) and the active-site channel (ASC) are indicated by arrows. Right: the electrostatic potential charge distribution at the active sites of EcMoaB (top left), BcMoaB (top right), StMoaB (bottom left) and HsGephG (bottom right). The two binding sites (AMPBS and MPTBS) and the active-site channel (ASC) are also indicated. (b) Structural superposition of the crystal structures of MogA (cyan, lime green and orange), MoaB (red, green, blue and yellow), Cnx1G (wheat) and GephG (white), comparing the active-site channel (ASC). The secondary-structural elements of TtMogA (red) and EcMogA (cyan) are labelled.
3.2.6. Oligomerization
The asymmetric units of TtMogA and one form of AaMogA contain one trimer, whereas that of the other form of AaMogA contains two trimers; the trimers are generated by a noncrystallographic threefold axis. The proteins MogA, Cnx1G and GephG have been shown to be active as trimers in solution (Schwarz et al., 2000 ▶, 2001 ▶; Llamas et al., 2004 ▶). In contrast, the EcMoaB, BcMoaB and StMoaB proteins are predicted to be present in both trimeric and hexameric states. An investigation of the surface-charge distribution on the hexameric interface of these proteins shows that they have a combination of alternating positive and negative charges which aid in the formation of the hexamer (Fig. 5 ▶). In EcMoaB Tyr55, Arg58, Ser62, Leu94, Asp96 and Asn129 contribute to the formation of a hexamer. However, it is not clear why the MoaB proteins form hexamers whereas the MogA proteins form trimers. The best possible utilization of hexameric MoaB would seem to be to form a heterohexamer (MoaB–MogA) that facilitates substrate–product exchange without dissociation into the external solvent (Sanishvili et al., 2004 ▶). Thus, we analyzed the oligomerization states of all of the crystal structures of MoaB, MogA, Cnx1G and GephG proteins using the PISA server. The results suggest that EcMoaB, BcMoaB and StMoaB are predicted to be stable in both the trimeric and hexameric states, whereas TtMogA, AaMogA, EcMogA, SoMogA, AtCnx1G and HsGephG are only stable in the trimeric state. A detailed analysis of the buried surface area and the solvation-energy gain upon oligomerization of all these proteins is given in Table 4 ▶. Interestingly, Cnx1G and GephG are observed to be more stable as a trimer compared with other homologues. The regions involved in trimer formation are 74–78, 82, 90–98, 100–114, 144–45, 148–149 and 152–153 (80–84, 88, 96–104, 106–120, 150–151, 154–155 and 158–159 in AaMogA, respectively). As expected, almost 60% of these residues are hydrophobic in nature.
Figure 5.

Electrostatic potential of the trimeric interface of EcMoaB (left) and EcMogA (right).
Table 4. Protein surface analysis using the PISA web server.
| Surface area (2) | Buried surface area (2) | Free energy difference (G int; kcalmol1 †) | Predicted oligomer | |
|---|---|---|---|---|
| TtMogA | 19850 | 4500 | 29.6 | Trimer |
| AaMogA | 22090 | 4370 | 33.7 | Trimer |
| EcMogA | 21770 | 4460 | 27.8 | Trimer |
| SoMogA | 21655 | 4235 | 33.4 | Trimer |
| AtCnx1G | 18800 | 7580 | 94.6 | Trimer |
| HsGephG | 20340 | 4730 | 51.7 | Trimer |
| EcMoaB | 19920 | 5085 | 33.1 | Trimer |
| 36770 | 13240 | 84.8 | Hexamer | |
| BcMoaB | 20350 | 4880 | 33.6 | Trimer |
| 37520 | 12940 | 79.8 | Hexamer | |
| StMoaB | 21470 | 4700 | 27.4 | Trimer |
| 39260 | 13070 | 76.4 | Hexamer |
1kcal = 4.186kJ.
3.2.7. Role of the N- and C-terminal residues
Pairwise sequence alignment of the EcMoaB and EcMogA proteins revealed that the two regions 1–13 and 106–118 of EcMoaB match region 103–115 of EcMogA. Thus, the 103–115 region of EcMogA has similar sequence repeats in EcMoaB. The 103–115 region of EcMogA corresponds to loop L9 of TtMogA. Superposition of all of the crystal structures available for the MoaB, MogA, Cnx1G and GephG families revealed that the N-terminus of MoaB proteins extends to the top of the MPTBS (Fig. 6 ▶). Superposition of AtCnx1G bound with MPT-AMP and EcMoaB shows that the residues at the N-terminus of EcMoaB can easily interact with MPT. It is interesting to note that StMoaB has a similar N-terminal conformation. In contrast, in MogA proteins the C-terminal residues show a conformation that covers the MPTBS. These observations clearly distinguish between MoaB and MogA proteins. However, the eukaryotic homologues (AtCnx1G and HsGephG) do not show the above feature. Notably, these two proteins are fused with the E domain in a single two-domain polypeptide chain. Multiple sequence alignment of these proteins also shows insertions at the N- and C-termini of MoaB and MogA proteins, respectively. Thus, it can be concluded that the N- and C-termini of MoaB and MogA proteins, respectively, play a similar role, possibly in stabilizing the substrate molecule in the active site.
Figure 6.

Stereoview of an active-site structural superposition of all of the proteins. The N-termini and C-termini are labelled in different colours (TtMogA, brick; AaMogA, light blue; EcMogA, lemon; EcMoaB, green; StMoaB, pink; HsGephG, cyan). The two binding sites (AMPBS and MPTBS) and the active-site channel (ASC) are also labelled.
3.2.8. Protein–protein complexes
It is known that the two proteins Cnx1G and Cnx1E (which are homologues of MogA/MoaB and MoeA in bacteria) are involved in adenylation and metal insertion into MPT. Also, Cnx1G and Cnx1E both bind MPT with different affinities (Schwarz et al., 2000 ▶). The protein MoeA contains four domains, of which domain III has the same fold as MogA. It is a molybdate-binding protein and is involved in the transfer of the metal molybdenum into MPT (Schwarz et al., 2000 ▶). Owing to the intrinsic instability of MPT, Moco has to remain bound to protein during the whole biosynthetic process until its final delivery to apomolybdoenzymes (Magalon et al., 2002 ▶). Also, compared with MPT synthase (MoaD–MoaE complex), MogA and MoeA proteins bind MPT more strongly (Magalon et al., 2002 ▶). Thus, the two proteins MogA and MoeA are believed to form protein–protein complexes to carry out the comparatively fast and unstable MPT-adenylation reaction (Liu et al., 2000 ▶; Schwarz et al., 2000 ▶; Magalon et al., 2002 ▶). In addition, MoaB proteins have been suggested to form protein–protein complexes with MobB and MoeA in much the same way as MogA does with MoeA (Sanishvili et al., 2004 ▶). Thus, we carried out protein–protein complex docking using the ClusPro server (Comeau et al., 2007 ▶). The proteins EcMogA (PDB code 1di6; Liu et al., 2000 ▶) and EcMoeA (PDB code 1g8l; Xiang et al., 2001 ▶) were taken as the receptor (trimer) and ligand (dimer), respectively, during docking. The highest ranked conformer was used for further analysis. Since only a dimeric molecule of MoeA was taken as the ligand, the best conformation of MoeA showed a possible site for binding with respect to the single subunit of MogA. Thus, we generated the same MoeA conformation with respect to the other subunits of MogA by superposition. Similarly, the MogA molecule was generated with respect to the other end of the MoeA dimer interface (Fig. 7 ▶). Interestingly, the MPTBS of MogA is very close (in the range 10–15 Å) to the active-site cavity of domain III of MoeA in the MogA–MoeA protein complex, which has been proposed to be more stable in the presence of MPT/Moco (Magalon et al., 2002 ▶). The residues observed in the protein–protein interactions of MogA (MoeA) were Arg5B (Asp121L), Glu150B (Glu270M), Asn152B (Glu266M), Val153B (Glu266M), Glu170B (Val76L and Gly78L), Ala183B (Glu257M), Arg185B (Glu257M), Ser188B (Ala82L, Gly83L and Gln84L), Ala189B (Gln84L), Arg190B (Glu257M), Arg191B (Arg97L), Asp13C (Gly88L), Glu50C (Glu89L), Arg81C (Glu89L), Phe110C (Tyr260M), Gln135C (Asp187M) and Lys147C (His231M). The last letter denotes the chain identity. Most of the residues of domain III of MoeA interact with the active-site residues of MogA, whereas residues from domain II of MoeA interact with those of the N- and C-termini of MogA. As expected, almost 30% and 70% of the interacting residues of MogA and MoeA, respectively, are predicted to be involved in protein–protein interactions using the PPI-Pred server (Bradford & Westhead, 2005 ▶). Sequence comparison of EcMogA with AtCnx1G and HsGephG reveals that almost 50% of the residues involved in protein–protein interaction are similar in nature. Of these, four residues, Asp13, Glu50, Arg81 and Gln135, of EcMogA are of particular importance. Asp13 (Asp11 in TtMogA) is essential for maintaining the ion pair with Arg81 (Arg77 in TtMogA; see §3.2.4 for details). Glu50 (Glu46 in TtMogA) is similar in nature in all of the homologous proteins except for EcMoaB (see §3.1.2 for details). Gln135 (Ser131 in TtMogA) is possibly involved in oligomerization (see §3.2.5 for details). In addition to the dimeric ligand, protein docking was also carried out considering monomeric MoeA. A comparison of the two best conformers obtained from dimeric and monomeric MoeA protein docking shows that the conformations of the two proteins are different. In the case of dimeric MoeA most of the interactions are between residues belonging to domains II and III from two different subunits of the dimer, whereas in the case of monomeric MoeA the interactions are mainly between residues of domains III and IV. However, almost 30% of the interactions are common to both conformers.
Figure 7.

Protein–protein interactions (EcMogA–EcMoeA). EcMogA (trimeric) is shown in red and EcMoeA (dimeric) in blue and green. The interacting domains of MoeA are labelled. Two dimers of MoeA with respect to two subunits of MogA were obtained by superposition of the conformations obtained from the protein–protein docking program ClusPro (Comeau et al., 2007 ▶). In a similar way, three trimers of MogA were also generated with respect to the other dimeric interface of MoeA.
3.2.9. Invariant and interfacial water molecules
Water molecules are known to play an important role in the structure and/or function of many proteins (Halle, 2004 ▶; Smolin et al., 2005 ▶; Kanaujia & Sekar, 2009 ▶). Thus, invariant water molecules and those located at subunit interfaces were identified. A total of 12 (nine from AaMogA and three from TtMogA) crystallographically independent subunits were used separately to identify invariant water molecules. Identification of invariant water molecules was carried out using a similar method to that described by Kanaujia & Sekar (2009 ▶). A total of 12 water molecules were identified as invariant (Figs. 8 ▶ a and 8 ▶ b). Most of them interact with the polar backbone atoms of the residues and thus are independent of the amino-acid type. Five (IW1, IW2, IW3, IW10 and IW11) of these 12 water molecules are located in a cavity generated by the trimeric subunits. A further five (IW4, IW5, IW6, IW9 and IW12) are close to the active site. The remaining two water molecules (IW7 and IW8) are located on the protein surface far from the active site. Water molecule IW4 forms a hydrogen bond to the Oγ1 atom of Thr80 (Thr86 in EcMoaB), which is proposed to be one of the residues that possibly affect the activity of EcMoaB. Similarly, water molecules IW5, IW6, IW9 and IW12 are likely to have essential roles as they form hydrogen bonds to the highly conserved residues Gly73 and Asp78, Gly70, Asp45 and Gly72, respectively. Most of the invariant water molecules are buried, with the exceptions of IW3, IW7, IW8, IW11 and IW12, and have low B factors (Table 5 ▶). In addition, most of them (with the exceptions being IW1 and IW11) have greater than 50% occupancy during the MD simulations.
Figure 8.

The overall three-dimensional structure of AaMogA (cartoon) with invariant water molecules (spheres) is shown. (b) Schematic representation of invariant water molecules. Hydrogen-bond interactions with various residues of the protein molecules are shown as lines. The water molecules are shown as spheres and the residues are shown as rectangles. Water molecules and residues in lighter colours are deeper relative to the plane. (c) The water molecules observed at the chain interfaces are shown (as spheres) for TtMogA (red) and AaMogA (blue). (d) Schematic representation of the interfacial water molecules. The water molecules belonging to TtMogA (red) and AaMogA (blue) are shown as circles. Water molecules observed at similar positions in both structures are labelled in the same circle. Those observed in only one structure are also labelled in black for TtMogA and blue for AaMogA. The hydrogen-bonding interactions of water molecules with protein molecules are represented by lines. The residues belonging to the three subunits are coloured according to (c). The lighter colours represent a greater depth relative to the plane of the paper.
Table 5. Invariant water molecules and their hydrogen bonds to the protein molecule.
| Water no. as in chain A of AaMogA | Hydrogen-bond interactions with protein and water molecules | Average solvent accessibility (2) | Average normalized B factor | Average occupancy calculated during the MD simulations† | |
|---|---|---|---|---|---|
| IW1 | 209 | Leu98O, Gly102N, Thr122O1 | 0.1 | 1.1 | 0.48 |
| IW2 | 215 | Glu91O2, Thr122O1, HOH363, HOH441 | 1.2 | 0.9 | 0.69 |
| IW3 | 224 | Ile117O, Ser119O | 26.1 | 1.0 | 0.81 |
| IW4 | 258 | Arg83O, Val85N, Thr86O1, HOH319 | 0 | 0.5 | 0.77 |
| IW5 | 277 | Gly79O, Asp84O, Arg120NH1 | 0.1 | 0.8 | 0.69 |
| IW6 | 281 | Thr74O1, Gly76O, Leu134O | 0 | 0.9 | 0.77 |
| IW7 | 295 | Val143O, HOH587, HOH600 | 8.4 | 0.1 | 0.82 |
| IW8 | 308 | Ser70O, Ser128O, Ser128O, HOH355, HOH464 | 8.3 | 0.2 | 0.81 |
| IW9 | 326 | Asp51O, Arg83O, HOH375 | 3.4 | 0.1 | 0.56 |
| IW10 | 441 | HOH215, HOH450, HOH497 | 4.0 | 0.6 | 0.80 |
| IW11 | 497 | Arg120O, HOH289, HOH441 | 6.5 | 0.8 | 0.46 |
| IW12 | 788 | Gly77N, HOH233, HOH687 | 14.6 | 0.2 | 0.76 |
The average was taken over ligand-free simulations.
In addition, seven interfacial water molecules were identified in the TtMogA and AaMogA crystal structures (Table 6 ▶; Figs. 8 ▶ c and 8 ▶ d). Water molecule TGI1 was also identified as invariant (IW3). Two water molecules, TGI2 and TGI3, are almost located on a noncrystallographic threefold axis and are hydrogen bonded to Gly103 from all three subunits in the trimer. Water molecule TGI4 is hydrogen bonded to Asp78 and Arg90. In a similar fashion, TGI5 is hydrogen bonded to Glu91 and Arg114. Most of these water molecules show a reasonable occupancy as calculated using the trajectories obtained from MD simulations.
Table 6. Water molecules observed at chain interfaces and their hydrogen-bond interactions with the protein molecule.
| Protein | WID | One chain | Water | Other chain | SASA† | NBF‡ | Occupancy |
|---|---|---|---|---|---|---|---|
| TtMogA | TGI1 | Ala111, Ser113 | 208 | Gly94 | 0.0 | 0.8 | 0.00 |
| TGI2 | Gly103 | 539 | Gly103, Arg105 | 1.0 | 1.4 | 0.57 | |
| TGI3 | Gly103 | 422 | Gly103 | 1.3 | 0.2 | 0.72 | |
| TGI4 | Asp78 | 268 | Arg90 | 0.2 | 0.4 | 0.81 | |
| TGI5 | Arg114 | 388 | Glu91 | 3.1 | 0.2 | 0.99 | |
| TGI6 | Glu97 | 398 | Glu97 | 0.0 | 0.1 | 1.00 | |
| TGI7 | Arg105 | 480 | Arg105 | 4.6 | 1.6 | 0.82 | |
| AaMogA | AGI1 | Ile117, Ser119 | 224 | Pro99, Gly100 | 0.0 | 0.5 | 0.58 |
| AGI3 | Glu103 | 310 | Glu103 | 0.4 | 0.3 | 0.78 | |
| AGI3 | Glu103 | 310 | Glu103 | 0.4 | 0.3 | 0.78 | |
| AGI4 | Glu88 | 213 | Glu95 | 8.7 | 0.1 | 0.67 | |
| AGI5 | Pro82, Asp84 | 231 | Lys96 | 3.8 | 0.3 | 0.28 | |
| AGI6 | Pro114 | 624 | Ala147 | 0.9 | 0.3 | 0.66 | |
| AGI7 | Gln107 | 794 | Gln107 | 0.0 | 1.7 | 0.73 |
Average solvent-accessible surface area (2).
Average normalized B factor.
3.3. Results from molecular dynamics and docking
3.3.1. General features
A total of 42 MD simulations (each of 50 ns) and 47 molecular-docking studies were carried out to study the protein dynamics and protein–ligand binding energies. A previous study on the plant protein Cnx1G showed the binding of MPT-AMP (Kuper et al., 2004 ▶). Thus, 14 simulations with purine nucleotides, with MPT and with MPT and AMS (AMP with one fewer phosphoryl O atom) were carried out with TtMogA at both binding sites to compare the specificities (Table 7 ▶). The simulations with MPT and AMS were carried out in order to mimic the intermediate compound MPT-AMP. In parallel, molecular-docking studies with these compounds at both binding sites were also performed. Similarly, to compare the binding specificities of these compounds with EcMoaB, nine MD simulations were independently carried out only at the MPTBS as proposed in a previous study (Sanishvili et al., 2004 ▶). However, molecular docking was performed at both binding sites. In a similar way, eight MD and nine molecular-docking studies were also carried out for AaMogA. It is known from a previous study (Schwarz et al., 2000 ▶) that MogA and MoeA both bind MPT but with different affinities (MogA > MoeA). Thus, MD simulations and docking studies with AMP, MPT and MPT-AMP were carried out for both proteins to compare the binding affinities with those of TtMogA, AaMogA and EcMoaB.
Table 7. Energies calculated from molecular-dynamics and docking methods.
For each protein, the first and second rows give the proteinligand interaction energy and its standard deviation (s.d.), respectively, in kcalmol1 (1kcal = 4.186kJ). The third and fourth rows give the average number of hydrogen bonds and its standard deviation, respectively. The fifth row gives the proteinligand binding energies calculated using the docking method. The sixth row gives the number of clusters obtained from molecular docking. AMPA denotes AMP at the AMPBS and AMPM denotes AMP at the MPTBS, etc.
| Protein | AMPA | AMPM | ADPA | ADPM | ATPA | ATPM | GMPA | GMPM | GDPA | GDPM | GTPA | GTPM | MPT | MPT-AMP† |
|---|---|---|---|---|---|---|---|---|---|---|---|---|---|---|
| TtMogA | 116.2 | 128.1 | 131.7 | 196.2 | 170.5 | 178.1 | 117.7 | 125.9 | 142.7 | 166.4 | 148.9 | 183.1 | 74.7 | 93.7 |
| (4.7) | (3.3) | (4.7) | (5.7) | (9.4) | (5.4) | (5.5) | (5.0) | (4.1) | (5.5) | (5.0) | (7.0) | (8.1) | (3.8) | |
| 4.4 | 5.6 | 5.0 | 9.5 | 5.1 | 6.0 | 5.3 | 4.8 | 5.9 | 6.1 | 5.9 | 7.0 | 3.1 | 1.8 | |
| (1.7) | (1.4) | (1.6) | (1.7) | (1.7) | (1.7) | (1.9) | (1.8) | (1.8) | (1.7) | (1.4) | (1.9) | (1.2) | (1.2) | |
| 12.4 | 12.7 | 14.3 | 12.8 | 15.0 | 14.2 | 12.2 | 13.3 | 13.3 | 14.0 | 14.8 | 14.4 | 12.5 | 11.4/12.8 | |
| 29 | 31 | 67 | 103 | 162 | 153 | 35 | 31 | 125 | 79 | 210 | 143 | 4 | 43/2 | |
| AaMogA | 82.8 | 117.0 | 86.8 | 103.0 | 82.5 | 95.8 | 96.6 | 111.4 | ||||||
| (4.9) | (4.9) | (3.6) | (3.0) | 4.7) | (6.8) | (4.1) | (3.9) | |||||||
| 2.7 | 6.7 | 2.5 | 6.8 | 3.4 | 6.0 | 5.1 | 2.5 | |||||||
| (1.3) | (1.5) | (0.9) | (1.5) | (1.3) | (2.6) | (1.1) | (1.2) | |||||||
| 10.3 | 11.8 | 12.3 | 10.5 | 11.9 | 10.7 | 10.2 | 11.8/10.2 | |||||||
| 46 | 113 | 191 | 68 | 153 | 211 | 27 | 50/33 | |||||||
| EcMogA | 120.5 | 86.9 | 86.7 | 148.8 | 127.3 | 118.5 | 119.8 | 64.1 | 142.2 | |||||
| (3.1) | (7.2) | (7.0) | (6.5) | (3.1) | (4.4) | (6.4) | (4.8) | (4.4) | ||||||
| 6.0 | 4.7 | 3.8 | 7.0 | 6.1 | 6.1 | 4.9 | 3.7 | 3.4 | ||||||
| (1.4) | (2.2) | (1.6) | (3.0) | (1.3) | (1.6) | (1.7) | (1.5) | (1.4) | ||||||
| 11.7 | 12.7 | 14.0 | 12.5 | 12.5 | 12.2 | 11.6 | 12.0 | 12.5 | 12.8 | 13.6 | 14.0 | 11.7 | 11.6/11.8 | |
| 45 | 70 | 148 | 137 | 198 | 193 | 71 | 79 | 152 | 151 | 220 | 192 | 21 | 48/10 | |
| AtCnx1G | 75.5 | 46.5 | 135.6 | |||||||||||
| (7.9) | (3.2) | (2.8) | ||||||||||||
| 3.3 | 0.6 | 4.3 | ||||||||||||
| (1.5) | (0.8) | (1.1) | ||||||||||||
| 12.5 | 12.4 | 10.8/12.5 | ||||||||||||
| 21 | 2 | 27/2 | ||||||||||||
| EcMoeA | 76.0 | 39.0 | 125.7 | |||||||||||
| (3.0) | (6.9) | (3.6) | ||||||||||||
| 5.1 | 1.2 | 2.1 | ||||||||||||
| (1.0) | (1.4) | (1.2) | ||||||||||||
| 10.1 | 10.8 | 1.0/10.8 | ||||||||||||
| 15 | 23 | 250/17 |
In the case of EcMoeA, the molybdate ion was not considered during the docking studies.
3.3.2. Energetics
The interaction energies calculated using MD simulations and the intermolecular energies obtained from docking studies are given in Table 7 ▶. Since the methods use different equations to calculate the interaction energies, there are differences in some cases. However, MD results combined with molecular-docking studies reveal several features that relate to different ligand-binding specificities. A comparison of the binding energies obtained from docking studies suggests that MPT and MPT-AMP show increased binding to TtMogA and AtCnx1G compared with EcMoaB, AaMogA and EcMoeA (Table 7 ▶). However, it has been shown experimentally that Cnx1E only binds MPT-AMP with a higher affinity than Cnx1G in the presence of molybdate (Llamas et al., 2006 ▶). In the case of ATP and GTP, the binding energies are greater with TtMogA than with EcMoaB. A previous study (Bevers et al., 2008 ▶) showed that binding of ATP is preferred over GTP. The interaction energies obtained from MD simulations for these two compounds reveal that ATP and GTP have similar affinities at the MPTBS; however, ATP clearly shows better binding at the AMPBS. For AMP, the binding energy is better with TtMogA than with EcMoaB at the AMPBS; however, both proteins show similar affinities at the MPTBS. A comparison of the binding energies at the two sites suggests that these compounds have a preference for the MPTBS compared with the AMPBS. In addition, comparison of AtCnx1G and EcMoeA reveals that the binding is better with AtCnx1G than with EcMoeA, supporting the previous studies. Analysis of the conformational space accessed during the docking simulations reveals that MPT is more specific for AtCnx1G and TtMogA, which is reflected by the lower number of clusters (row 6 in Table 7 ▶). Each cluster represents a particular conformation of the ligands; the members of each cluster are more or less similar within an r.m.s.d. of 1.0 Å. Interestingly, ATP and GTP show fewer conformations at the MPTBS than at the AMPBS. However, diphosphate compounds show fewer conformations at the AMPBS than at the MPTBS. Analysis of hydrogen-bond dynamics during MD simulations shows that compounds form more hydrogen bonds at the MPTBS than at the AMPBS in most cases.
3.3.3. Protein dynamics
All of the secondary-structural elements (except for α1 and β4) of both the TtMogA and AaMogA proteins show low root-mean-square fluctuations (r.m.s.f.s) during the MD simulations. Helix α1 is solvent-accessible and forms the active-site cavity. Interestingly, the residues of helix α1 interact with MoeA in MogA–MoeA protein complexes (see §3.2.8). On the other hand, strand β4 is located in the trimeric interface and is involved in oligomerization. As expected, the residues of strand β4 show a very low r.m.s.f. in a simulation containing all three subunits of the trimer (Fig. 9 ▶). Most of the loops show a high fluctuation. The region 103–115 belongs to loop L9 and is of importance here. Remarkably, the r.m.s.f. for this region in the simulation containing MPT-AMP in the active site is low. Also, the simulation containing GTP at the MPTBS shows low fluctuation for this region. On the other hand, the r.m.s.f. for loop L9 is high in the simulation containing GTP at the AMPBS (Fig. 9 ▶). In a similar way, the region of loop L2, which is also part of the active site, shows low fluctuation in MPT-AMP-bound and GTP-bound simulations. In addition, the residues in loop L6, which is involved in oligomerization and is part of the active site, show a low r.m.s.f. in trimeric simulations and in those with MPT-AMP and GTP at the MPTBS. To some extent, the r.m.s.f. values calculated from the B factors obtained from the crystal structures agree with those of the MD simulations (Fig. 9 ▶). In both proteins, most of the flexible regions identified using the program ESCET (Schneider, 2004 ▶) show a high fluctuation. Similar patterns were observed in the EcMoaB, AtCnx1G and EcMoeA simulations.
Figure 9.

Root-mean-square fluctuation (r.m.s.f.) of TtMogA (bottom) and AaMogA (top). The conformationally invariant (lower) and flexible (upper) regions of the protein molecules obtained using the program ESCET (Schneider, 2004 ▶) are shown as brown lines. R.m.s.f. values for the protein only (green), GTP bound at the AMPBS (violet), GTP bound at the MPBTS (orange), MPT-AMP bound (blue) and the trimer (cyan) are coloured differently. The average r.m.s.f. values of all of the simulations are shown in red. The average r.m.s.f. values calculated from the B factor observed in the crystal structures are shown in magenta.
4. Conclusions
The crystal structures of the Moco-biosynthesis protein MogA from the thermophilic organisms T. thermophilus HB8 and A. aeolicus VF5 have been determined at high resolution. The residues Pro47, Pro48, Lys52, Arg55, Asp59, Glu86, Gly115, Arg120 and Ser131 (TtMogA) involved in the oligomerization of the protein molecule have been identified based on a comparative analysis. Furthermore, five invariant and two interfacial water molecules play a role in oligomerization. Similarly, a further five invariant water molecules and one interfacial water molecule are likely to play a role in anchoring the active-site residues. Our comparative analyses reveal a possible role for the N- and C-terminal residues of MoaB and MogA proteins, respectively, in stabilizing the substrate and/or product molecule in the active site. Protein–protein complex prediction leads to the identification of residues (Arg3, Asp11, Glu46, Arg77, Lys106, Ser131 and Thr154) that are possibly involved in inter-protein interactions. Further, MD simulations and molecular-docking studies of several small-molecule ligands with the proteins support the experimental results reported in the literature. The results show that MPT and MPT-AMP can bind more strongly to MogA proteins than to MoaB proteins. In addition, in most cases the MPTBS is preferred over the AMPBS, except for the ATP molecule. Furthermore, the results of the MD simulations show that the active-site loops are stabilized upon substrate and/or product binding.
Supplementary Material
PDB reference: TtMogA, 3mch
PDB reference: AaMogA, P21, 3mci
PDB reference: AaMogA, P1, 3mcj
Acknowledgments
The facilities at the Bioinformatics Centre and the Interactive Graphics-Based Molecular Modelling Facility are gratefully acknowledged. These facilities are supported by the Department of Biotechnology, Government of India. JJ thanks beamlines BL12B2, BL26B1 and BL26B2 at SPring-8 for excellent facilities and assistance.
References
- Antonyuk, S. V., Strange, R. W., Ellis, M. J., Bessho, Y., Kuramitsu, S., Shinkai, A., Yokoyama, S. & Hasnain, S. S. (2009). Acta Cryst. F65, 1200–1203. [DOI] [PMC free article] [PubMed]
- Bader, G., Gomez-Ortiz, M., Haussmann, C., Bacher, A., Huber, R. & Fischer, M. (2004). Acta Cryst. D60, 1068–1075. [DOI] [PubMed]
- Baker, N. A., Sept, D., Joseph, S., Holst, M. J. & McCammon, J. A. (2001). Proc. Natl Acad. Sci. USA, 98, 10037–10041. [DOI] [PMC free article] [PubMed]
- Berman, H. M., Westbrook, J., Feng, Z., Gilliland, G., Bhat, T. N., Weissig, H., Shindyalov, I. N. & Bourne, P. E. (2000). Nucleic Acids Res. 28, 235–242. [DOI] [PMC free article] [PubMed]
- Bevers, L. E., Hagedoorn, P. L., Santamaria-Araujo, J. A., Magalon, A., Hagen, W. R. & Schwarz, G. (2008). Biochemistry, 47, 949–956. [DOI] [PubMed]
- Bradford, J. R. & Westhead, D. R. (2005). Bioinformatics, 21, 1487–1494. [DOI] [PubMed]
- Brünger, A. T. (1992). Nature (London), 355, 472–475. [DOI] [PubMed]
- Brünger, A. T., Adams, P. D., Clore, G. M., DeLano, W. L., Gros, P., Grosse-Kunstleve, R. W., Jiang, J.-S., Kuszewski, J., Nilges, M., Pannu, N. S., Read, R. J., Rice, L. M., Simonson, T. & Warren, G. L. (1998). Acta Cryst. D54, 905–921. [DOI] [PubMed]
- Case, D. A. et al. (2006). AMBER 9. University of California, San Francisco, USA.
- Cohen, G. E. (1997). J. Appl. Cryst. 30, 1160–1161.
- Comeau, S. R., Kozakov, D., Brenke, R., Shen, Y., Beglov, D. & Vajda, S. (2007). Proteins, 69, 781–785. [DOI] [PubMed]
- Darden, T., York, D. & Pedersen, L. (1993). J. Chem. Phys. 98, 10089–10092.
- Duan, Y., Wu, C., Chowdhury, S., Lee, M. C., Xiong, G., Zhang, W., Yang, R., Cieplak, P., Luo, R., Lee, T., Caldwell, J., Wang, J. & Kollman, P. (2003). J. Comput. Chem. 24, 1999–2012. [DOI] [PubMed]
- Emsley, P. & Cowtan, K. (2004). Acta Cryst. D60, 2126–2132. [DOI] [PubMed]
- Frisch, M. J. et al. (2004). Gaussian03. Gaussian Inc., Wallingford, Connecticut, USA.
- Gouet, P., Courcelle, E., Stuart, D. I. & Métoz, F. (1999). Bioinformatics, 15, 305–308. [DOI] [PubMed]
- Halle, B. (2004). Philos. Trans. R. Soc. Lond. B Biol. Sci. 359, 1207–1224. [DOI] [PMC free article] [PubMed]
- Hanzelmann, P., Hernandez, H. L., Menzel, C., Garcia-Serres, R., Huynh, B. H., Johnson, M. K., Mendel, R. R. & Schindelin, H. (2004). J. Biol. Chem. 279, 34721–34732. [DOI] [PubMed]
- Hanzelmann, P., Schwarz, G. & Mendel, R. R. (2002). J. Biol. Chem. 277, 18303–18312. [DOI] [PubMed]
- Hess, B., Bekker, H., Berendsen, H. J. C. & Fraaije, J. G. E. M. (1997). J. Comput. Chem. 18, 1463–1472.
- Hess, B., Kutzner, C., van der Spoel, D. & Lindahl, E. (2008). J. Chem. Theory Comput. 4, 435–447. [DOI] [PubMed]
- Hille, R. (2002). Trends Biochem. Sci. 27, 360–367. [DOI] [PubMed]
- Hubbard, S. J. & Thornton, J. M. (1993). NACCESS. Department of Biochemistry and Molecular Biology, University College, London.
- Hussain, A. S. Z., Shanthi, V., Sheik, S. S., Jeyakanthan, J., Selvarani, P. & Sekar, K. (2002). Acta Cryst. D58, 1385–1386. [DOI] [PubMed]
- Johnson, J. L., Wuebbens, M. M., Mandell, R. & Shih, V. E. (1989). J. Clin. Invest. 83, 897–903. [DOI] [PMC free article] [PubMed]
- Kabsch, W. & Sander, C. (1983). Biopolymers, 22, 2577–2637. [DOI] [PubMed]
- Kanaujia, S. P., Ranjani, C. V., Jeyakanthan, J., Ohmori, M., Agari, K., Kitamura, Y., Baba, S., Ebihara, A., Shinkai, A., Kuramitsu, S., Shiro, Y., Sekar, K. & Yokoyama, S. (2007). Acta Cryst. F63, 324–326. [DOI] [PMC free article] [PubMed]
- Kanaujia, S. P. & Sekar, K. (2009). Acta Cryst. D65, 74–84. [DOI] [PubMed]
- Karshikoff, A. & Ladenstein, R. (2001). Trends Biochem. Sci. 26, 550–556. [DOI] [PubMed]
- Kuper, J., Llamas, A., Hecht, H.-J., Mendel, R. R. & Schwarz, G. (2004). Nature (London), 430, 803–806. [DOI] [PubMed]
- Kuper, J., Winking, J., Hecht, H.-J., Mendel, R. R. & Schwarz, G. (2003). Arch. Biochem. Biophys. 411, 36–46. [DOI] [PubMed]
- Kuramitsu, S., Hiromi, K., Hayashi, H., Morino, Y. & Kagamiyama, H. (1990). Biochemistry, 29, 5469–5476. [DOI] [PubMed]
- Lake, M. W., Wuebbens, M. M., Rajagopalan, K. V. & Schindelin, H. (2001). Nature (London), 414, 325–329. [DOI] [PubMed]
- Larkin, M. A, Blackshields, G., Brown, N. P., Chenna, R., McGettigan, P. A., McWilliam, H., Valentin, F., Wallace, I. M., Wilm, A. & Lopez, R. (2007). Bioinformatics, 23, 2947–2948. [DOI] [PubMed]
- Laskowski, R. A. (1995). J. Mol. Graph. 13, 323–330. [DOI] [PubMed]
- Laskowski, R. A., MacArthur, M. W., Moss, D. S. & Thornton, J. M. (1993). J. Appl. Cryst. 26, 283–291.
- Liu, M. T., Wuebbens, M. M., Rajagopalan, K. V. & Schindelin, H. (2000). J. Biol. Chem. 275, 1814–1822. [DOI] [PubMed]
- Llamas, A., Mendel, R. R. & Schwarz, G. (2004). J. Biol. Chem. 279, 55241–55246. [DOI] [PubMed]
- Llamas, A., Otte, T., Multhaup, G., Mendel, R. R. & Schwarz, G. (2006). J. Biol. Chem. 281, 18343–18350. [DOI] [PubMed]
- Magalon, A., Frixon, C., Pommier, J., Giordano, G. & Blasco, F. (2002). J. Biol. Chem. 277, 48199–48204. [DOI] [PubMed]
- Matthews, B. W. (1968). J. Mol. Biol. 33, 491–497. [DOI] [PubMed]
- McCoy, A. J., Grosse-Kunstleve, R. W., Adams, P. D., Winn, M. D., Storoni, L. C. & Read, R. J. (2007). J. Appl. Cryst. 40, 658–674. [DOI] [PMC free article] [PubMed]
- McDonald, I. K. & Thornton, J. M. (1994). J. Mol. Biol. 238, 777–793. [DOI] [PubMed]
- Morris, G. M., Goodsell, D. S., Halliday, R. S., Huey, R., Hart, W. E., Belew, R. K. & Olson, A. J. (1998). J. Comput. Chem. 19, 1639–1662.
- Okuda, S., Katayama, T., Kawashima, S., Goto, S. & Kanehisa, M. (2006). Nucleic Acids Res. 34, D358–D362. [DOI] [PMC free article] [PubMed]
- Otwinowski, Z. & Minor, W. (1997). Methods Enzymol. 276, 307–326. [DOI] [PubMed]
- Ptitsyn, O. B. (1998). J. Mol. Biol. 278, 655–666. [DOI] [PubMed]
- Rajagopalan, K. V. (1991). Adv. Enzymol. 64, 215–290. [DOI] [PubMed]
- Rajagopalan, K. V. & Johnson, J. L. (1992). J. Biol. Chem. 267, 10199–10202. [PubMed]
- Reiss, J. (2000). Hum. Genet. 106, 157–163. [DOI] [PubMed]
- Roulston, M. S. (1999). Physica D, 125, 285–294.
- Rudolph, M. J., Wuebbens, M. M., Rajagopalan, K. V. & Schindelin, H. (2001). Nature Struct. Biol. 8, 42–46. [DOI] [PubMed]
- Sanishvili, R., Beasley, S., Skarina, T., Glesne, D., Joachimiak, A., Edwards, A. & Savchenko, A. (2004). J. Biol. Chem. 279, 42139–42146. [DOI] [PMC free article] [PubMed]
- Santos, D. P. C., Dean, D. R., Hu, Y. & Ribbe, M. W. (2004). Chem. Rev. 104, 1159–1173. [DOI] [PubMed]
- Schneider, T. R. (2004). Acta Cryst. D60, 2269–2275. [DOI] [PubMed]
- Schüttelkopf, A. W. & van Aalten, D. M. F. (2004). Acta Cryst. D60, 1355–1363. [DOI] [PubMed]
- Schwarz, G. (2005). Cell. Mol. Life Sci. 62, 2792–2810. [DOI] [PMC free article] [PubMed]
- Schwarz, G., Boxer, D. H. & Mendel, R. R. (1997). J. Biol. Chem. 27, 26811–26814. [DOI] [PubMed]
- Schwarz, G., Mendel, R. R. & Ribbe, M. W. (2009). Nature (London), 460, 839–847. [DOI] [PubMed]
- Schwarz, G., Schrader, N., Mendel, R. R., Hecht, H.-J. & Schindelin, H. (2001). J. Mol. Biol. 312, 405–418. [DOI] [PubMed]
- Schwarz, G., Schulze, J., Bittner, F., Eilers, T., Kuper, J., Bollmann, G., Nerlich, A., Brinkmann, H. & Mendel, R. R. (2000). Plant Cell, 2, 2455–2472. [DOI] [PMC free article] [PubMed]
- Smolin, N., Oleinikova, A., Brovchenko, I. & Geiger, A. (2005). J. Phys. Chem. 109, 10995–11005. [DOI] [PubMed]
- Sola, M., Kneussel, M., Heck, I. S., Betz, H. & Weissenhorn, W. (2001). J. Biol. Chem. 276, 25294–25301. [DOI] [PubMed]
- Sorin, E. J. & Pande, V. S. (2005). Biophys. J. 88, 2472–2493. [DOI] [PMC free article] [PubMed]
- Spoel, D. van der, Lindahl, E., Hess, B., Groenhof, G., Mark, A. E. & Berendsen, H. J. C. (2005). J. Comput. Chem. 26, 1701–1718. [DOI] [PubMed]
- Sterner, R. & Liebl, W. (2001). Crit. Rev. Biochem. Mol. Biol. 36, 39–106. [DOI] [PubMed]
- Sumathi, K., Ananthalakshmi, P., Roshan, M. N. A. M. & Sekar, K. (2006). Nucleic Acids Res. 34, W128–W134. [DOI] [PMC free article] [PubMed]
- Vieille, C. & Zeikus, G. J. (2001). Microbiol. Mol. Biol. Rev. 65, 1–43. [DOI] [PMC free article] [PubMed]
- Wuebbens, M. M. & Rajagopalan, K. V. (1993). J. Biol. Chem. 268, 13493–13498. [PubMed]
- Xiang, S., Nichols, J., Rajagopalan, K. V. & Schindelin, H. (2001). Structure, 9, 299–310. [DOI] [PubMed]
- Zhang, Y. & Gladyshev, V. N. (2008). J. Mol. Biol. 379, 881–899. [DOI] [PMC free article] [PubMed]
Associated Data
This section collects any data citations, data availability statements, or supplementary materials included in this article.
Supplementary Materials
PDB reference: TtMogA, 3mch
PDB reference: AaMogA, P21, 3mci
PDB reference: AaMogA, P1, 3mcj