

Abstract
[F-18]Mefway was developed to provide an F-18 labeled PET neuroligand with high affinity for the serotonin 5-HT1A receptor to improve the in vivo assessment of the 5-HT1A system. The goal of this work was to compare the in vivo kinetics of [F-18]mefway, [F-18]MPPF, and [C-11]WAY100635 in the rhesus monkey.
Methods
Each of four monkeys were given bolus injections of [F-18]mefway, [C-11]WAY100635, and [F-18]MPPF and scans were acquired with a microPET P4 scanner. Arterial blood was sampled to assay parent compound throughout the time course of the PET experiment. Time activity curves were extracted in the high 5-HT1A binding areas of the anterior cingulate cortex (ACG), mesial temporal cortex (MTC), raphe nuclei (RN) and insula cortex (IC). Time activity curves were also extracted in the cerebellum (CB) which was used as a reference region. The in vivo kinetics of the radiotracers were compared based upon the nondisplaceable distribution volume (VND) and binding potential (BPND).
Results
At 30 minutes, the fraction of radioactivity in the plasma due to parent compound was 19%, 28%, and 29% and cleared from the arterial plasma at rates of 0.0031, 0.0078, and 0.0069 (min-1) ([F-18]mefway, [F-18]MPPF, [C-11]WAY100635). The BPND in the brain regions were; MTC: 7.4±0.6, 3.1±0.4, 7.0±1.2, ACG: 7.2±1.2, 2.1±0.2, 7.9±1.2; RN: 3.7±0.6, 1.3±0.3, 3.3±0.7 and IC: 4.2±0.6, 1.2±0.1, 4.7±1.0 for [F-18]mefway, [F-18]MPPF, and [C-11]WAY100635 respectively.
Conclusions
In the rhesus monkey, [F-18]mefway has similar in vivo kinetics to [C-11]WAY100635 and yields greater than 2-fold higher BPND than [F-18]MPPF. These properties make [F-18]mefway a promising radiotracer for 5-HT1A assay, providing higher counting statistics and a greater dynamic range in BPND.
Keywords: 5-HT1A, PET, serotonin
INTRODUCTION
The serotonin (5-HT) system plays a central role in regulating mood and affect, making a major contribution to how an individual responds to stress. Disruptions in this system, including 5-HT synthesis, transmission, reuptake and degradation, are implicated in a wide variety of mood and anxiety-related neuropsychiatric illnesses. The 5-HT1A receptor subtype is known to be a critical regulator of the 5-HT system and is believed to play a pivotal function in the pathophysiology of these illnesses. One of the most powerful techniques for examining the role of the 5-HT1A system in the living brain is PET imaging, providing the sensitivity for detecting 5-HT1A receptors that may be present at very low densities.
Presently, the PET antagonist compounds targeting the 5-HT1A receptor site are based upon the WAY-100635 moiety (see (Kumar and Mann, 2007) for review). The vast majority of PET 5-HT1A human studies are performed with the highly selective 5-HT1A PET radioligand [C-11]WAY100635(Pike et al., 2000). [C-11]WAY100635 yields high quality images with high target to cerebellum ratios, low intra-subject variability and BPND parameter stability from a 90 minute dynamic PET scan. In certain situations the short-lived [C-11] radiolabel (t1/2=20.3 min) may be deemed advantageous, however, its use necessitates an onsite cyclotron, limiting studies to select research PET centers. Further, the relatively high energy of the emitted β+ particle coupled with the rapid clearance through the gall bladder limits the injected dose of [C-11]WAY100635 to 260 MBq for research studies in humans (Parsey et al., 2005b), which is approximately 50% lower than the injected dose frequently used for research investigations with other C-11 labeled compounds (e.g., [C-11]PIB or [C-11]raclopride). Several F-18 compounds have been developed to address these experimental constraints. [F-18]MPPF has been used in humans to study a variety of neuropsychiatric disorders, however, the literature values of BPND suggest that it has specific-to-nonspecific (and nondisplaceable) binding ratio of approximately half that of [C-11]WAY100635 (Aznavour and Zimmer, 2007). [F-18]FCWAY has also been used in human to study 5-HT1A binding, but quantitative accuracy of [F-18]FCWAY is hindered by defluorination of the radiolabel, requiring an enzyme inhibitor to minimize this effect (Carson et al., 2003).
Preliminary reports with [F-18]mefway in rodent and nonhuman primate studies suggest that this tracer yields favorable in vivo characteristics for the quantitative assay of 5-HT1A binding. The stability of [F-18]mefway from defluorination is achieved by placing the fluorine radiolabel on a primary carbon while retaining the close structural similarity of the WAY-100635. In our previously published work, in vitro binding assays in rat brain slices have shown greatest uptake in the region of the hippocampus, revealing a specific to nonspecific binding ratio of 82:1 (using the cerebellum (CB) as a region with negligible specific 5-HT1A binding)(Saigal et al., 2006). High levels of [F-18]mefway binding were also seen in the colliculus (46:1) and the frontal cortex (40:1). The binding of [F-18]mefway was almost completely displaced with competition of 10 μM of WAY100635, demonstrating high selectivity for the 5-HT1A receptor site. In vitro competition experiments with serotonin yielded IC50 values of 170 – 240 nmol/L in the high uptake regions of the rat brain slices The binding affinity of WAY100635 (IC50 = 23.2 nM) and unlabeled mefway (IC50 = 25.7nM) against [F-18]mefway were found to be in close agreement. Also, the lipophilicity of [F-18]mefway and [C-11]WAY100635 (logP of 2.62 and 3.28, respectively)(Pike et al., 2000; Saigal et al., 2006), are both within a range that would suggest favorable in vivo uptake in the brain (Kessler et al., 1991).
In this work, we report a direct comparison of the in vivo kinetics of [C-11]WAY100635, [F-18]MPPF, and [F-18]mefway in rhesus monkeys. By performing multitracer studies in the same subjects, it is possible to accurately assess and compare the imaging characteristics of these three 5-HT1A PET radiotracers.
MATERIALS AND METHODS
Subjects
A total of 4 macaca mulatta (rhesus) (4 male; 7.8 ± 1.7 kg) underwent multitracer PET scans. The subjects were housed at the Harlow Primate Laboratory at the University of Wisconsin and all housing and experimental procedures were in accordance with institutional guidelines. The age of the subjects at the time of the first scan was 4.6 ± 0.3 years and the repeated scans were performed between 1 week and 7 months following the first scan. For the imaging procedures, the subjects were first anesthetized with ketamine (15mg/kg IM) and maintained on 0.75% – 1.5% isoflurane for the duration of the experiment. Atropine sulfate (0.27mg IM) was administered to minimize secretions during the course of the experiment. During the length of the scans, body temperature, breathing rate, heart rate, and SpO2 levels were monitored and recorded. A catheter was placed in the femoral artery for arterial plasma sampling and the saphenous vein for administration of radiotracer. After data acquisition, subjects were removed from anesthesia and returned to their cages when swallowing reflex was restored, then continuously monitored until fully alert.
Radiochemical Synthesis
The C-11 and F-18 radionuclides were produced using either an 11-MeV RDS 112 cyclotron or a 16-MeV GE PETtrace cyclotron. [C-11]WAY100635 [Carbonyl-C-11]N-(2-(1-(4-(2-Methoxyphenyl)-piperazinyl)ethyl)-N-pyridinyl) cyclohexanecarboxamide The C-11 was produced by a static irradiation of protons on a 1% O2/N2 mixture, producing [C-11]CO2. After irradiation, target gas was trapped in molecular sieves and then released into a Grignard solution. The procedure for the remaining steps of the synthesis was similar to a method previously described (Hwang et al., 1999). Briefly, approximately 2mg of WAY100634 precursor (ABX, Raderberg, Germany) in solution was added and the reaction proceeded for 5 minutes at a temperature of 75 °C. Purification of the mixture was achieved using reverse phase HPLC with a C18 Prodigy 10 micron 250×10mm ODS – Prep column (Phenomenex) and mobile phase of 70% methanol: 30% 0.1M ammonium formate solution: 0.3% triethylamine (by volume) at a flow rate of 8mL/min. Final formulation of the product collected from HPLC was performed using a C18 sep-pak and then passed through a 0.22μm millipore filter. At end of synthesis, radiochemical purity was > 95%, with specific activity of 34 – 92 GBq/micromol providing a batch yield of 370 – 740 MBq. [F-18]Mefway N-{2-[4-(2-methoxyphenyl)piperazinyl]ethyl}-N-(2-pyridyl)-N-(4-[F-18]-fluoromethylcyclohexane)carboxamide [F-18]Mefway is synthesized by nucleophilic substitution of the tosylate precursor, which was prepared according to previously published methods (Saigal, Pichika et al. 2006) The radiofluorination was performed using a modified CPCU automated module. Anhydrous acetonitrile was added to the [F-18]-fluoride and then dried by azeotropic distillation. Once dry, the [F-18]-fluoride was heated with 1 – 2 mg of the (trans-) tosylate precursor in 0.5 ml of anhydrous acetonitrile to 96°C for 10 minutes. The purification was performed using reverse phase HPLC with a C18 Econosil 10 micron 250 × 10 mm column (Alltech) and a mobile phase of 60% acetonitrile: 40% water containing 0.1% triethylamine (by volume) and a flow rate of 2.5 ml/min. The [F-18]mefway peak was collected at approximately 14 minutes and, after removal of HPLC solvents, final product was then diluted in 0.9% saline for injection and passed through a 0.22μm millipore filter. The final product yielded > 95% radiochemical purity, requiring approximately 2 hours for radiochemical synthesis with specific activity of 74 – 111 GBq/micromol providing a batch yield of 185 – 370 MBq. [F-18]MPPF 4-Fluoro-N-[2-[4-(2-methoxyphenyl)piperazin-1-yl]ethyl]-N-pyridin-2-ylbenzamide [F-18]MPPF is synthesized by nucleophilic substitution of the nitro precursor. The [F-18]-fluoride was heated with 1–2mg of nitro MPPF derivative (ABX, Raderberg, Germany) dissolved in 0.45ml solvent at 135°C for 30 minutes. Following the reaction, HPLC was performed using Prevail C18, 5 micron, 250 × 10 mm column (Alltech) and mobile phase of 18% tetrahydrofuran: 27% methanol: 55% 0.05M NaOAc, pH=5 (by volume) at a flow rate of 3ml/min. The [F-18]MPPF was collected at approximately 17 minutes and roto-evaporated to dryness. The final product was then diluted in 0.9% saline for injection and passed through a 0.22μm millipore filter. The radiochemical purity was > 95% and the specific activity of the [F-18]MPPF was 84 – 102 GBq/micromol at the end of synthesis providing a batch yield of 185 – 370 MBq.
Data Acquisition
PET scans were acquired using a Concorde microPET P4 scanner. The scanner has an axial field of view of 7.8 cm, a transaxial field of view of 19 cm, and an in-plane spatial resolution of 1.8 mm (Tai et al., 2001). The heads of the subjects were positioned in a steriotaxic headholder to maintain a consistent orientation for all scans on all subjects. Prior to injection of radiotracer, a 518 second transmission scan was acquired using a Co-57 point source. Emission data collection was started at the time of bolus injection of radiotracer of 161 ± 41 MBq, 101 ± 35 MBq, 47 ± 20 MBq for [C-11]WAY100635, [F-18]MPPF and [F-18]mefway, respectively. The injected mass for each radiotracer was 1.15 ± 0.50 nmol/kg, 0.18 ± 0.16 nmol/kg, 0.14 ± 0.18 nmol/kg for [C-11]WAY100635, [F-18]MPPF and [F-18]mefway, respectively. One of the subjects (M2) did not receive a [C-11]WAY100635 scan due to low radioactivity yields in the radiotracer synthesis. An acquisition of 120 minutes was acquired for the [F-18]MPPF and [F-18]mefway studies, and 90 minutes for the [C-11]WAY100635 study. Arterial blood samples were acquired throughout the course of the study ranging from 10 samples/minute immediately after injection to every 10 minutes toward the end of the study. Whole blood samples were taken in volumes of ~0.5mL, mixed with heparinized saline and counted using a NaI(Tl) well counter which was cross calibrated in units of kBq/mL with the PET scanner. The blood samples were then centrifuged for 5 minutes, 250 μL of plasma was drawn and added to 50 μL of sodium bicarbonate, and then the plasma was immediately assayed. Ethyl acetate extraction was performed (2 times, 500 μL each) on the plasma samples to separate the lipophilic parent compound from the polar metabolites using our previously reported methods (Saigal et al., 2006). The lipophilic fraction was assayed for radioactivity to provide the input function for tracer kinetic analysis. The same procedure for arterial sampling was performed in all of the studies.
Data Analysis
Raw list mode data from all scans were binned into temporal frames of 4×1 minute, 3×2 minutes, and either 16×5 minutes ([C-11]WAY100635) or 22×5 minutes ([F-18]MPPF and [F-18]mefway) with corrections applied for scanner deadtime and random coincidence events. Sinograms of the emission scan were reconstructed using filtered backprojection (0.5 cm−1 ramp filter) with corrections to account for attenuation, scatter, radioactive decay, and scanner normalization to a final matrix size of 128 × 128 × 63 and voxel dimensions of 1.90 × 1.90 × 1.21 mm3. The multitracer time series were realigned into common space for each subject using the Linear Image Registration Tool, which is part of the FMRIB Software Library (Jenkinson and Smith, 2001), to obtain the rigid body transformation matrix obtained from the coregistration of the integrated (i.e summed) data over the entire study. Circular regions of interest (ROIs) were drawn in various regions of the brain to extract time-activity curves of the radiotracer in the tissue, which included the brain regions of the CB (1.02 cm3), caudal anterior cingulate (ACG) (0.82 cm3), insula cortex (IC) (0.66 cm3), raphe nuclei (RN) (0.08 cm3) and mesial temporal cortex (MTC) (0.70 cm3) which includes the hippocampus.
The time series data were analyzed using two separate methods for estimation of the in vivo behaviors of the radiotracers. In the CB, the PET signal is dominated by nondisplaceable kinetics (i.e. radiotracer that is not specifically bound to the 5-HT1A receptors) and this region is frequently used as a reference for radiotracer behavior in regions without specific binding. To explore the presence of small but significant specific binding, the data from the cerebellar region were analyzed using the two-tissue compartment model, described by the state equations:
where CND and CS represent the radioactive concentration of radiotracer in the nondisplaceable (free and nonspecifically bound) and specifically bound states, respectively. The concentration of parent radiotracer in the arterial plasma is Cp, K1 (mL/min/mL) and k2 (min−1) respresent the bidirectional transport of radiotracer across the blood-brain barrier. The specific binding of the radiotracer to the receptor site is given by a bimolecular association parameter k3 (=konBmax in units of min−1) and dissociation rate k4 (=koff)(min−1). The decay corrected, measured PET signal in a tissue region represents: CT(t) = CND + CS + fVCWB, in units of kBq/mL, assuming the fractional blood volume (fV) and concentration of radioactivity in the whole blood of CWB. For this work, a value of 0.04 was assumed for fV. There was no attempt to estimate the fraction of radiotracer bound to plasma proteins or nonspecifically bound in the brain. A single-compartment model was also examined by fixing k3 = k4 = 0 to assess if the data could be adequately described without a compartment for specific binding. COMKAT software (Muzic and Cornelius, 2001) was used for obtaining the parameter estimates with the model configurations. The data were weighted according to the reciprocal of the variance of the PET data (weight = frame duration/PET concentration) and the standard deviation of the parameter estimates were derived from the covariance matrix (Mazoyer et al., 1986). The results of the one- and the two-compartment models were compared using the Akaike information criteria (AIC) and the appropriate model was selected based upon the lowest AIC(Akaike, 1974).
The two-compartment model was not used for regions of the brain with medium to high 5-HT1A receptor density (ACG, IC, RN, MTC) due to the lack of parameter identifiability (i.e. large covariance between the kinetic parameter estimates) as is frequently observed when attempting to estimate four or more parameters from a single bolus injection study (Delforge et al., 1990). The Logan graphical method was used in these brain regions with the CB time course serving as the reference region (Logan et al., 1996) to obtain an index of specific 5-HT1A binding. A period of linearization of t* = 40 minutes was used to obtain an estimate of the distribution volume ratio (DVR) for each brain region. A fixed value of k2 was used for each radiotracer (averaged over the 4 subjects) as obtained by the cerebellar compartment analysis. Estimates of the nondisplaceable binding potential (BPND) were obtained by the relationship: BPND = DVR 1. Estimates of BPND bias due to small amounts of specific binding in the CB were investigated based upon the k3 and k4 terms in the two-compartment analysis of the cerebellar data.
Parametric images of DVR were generated to provide a visual comparison of the binding profile for each radiotracer. Voxel based estimates of DVR were calculated using the same graphical based algorithm described above and the same period of linearization on the dynamic time series. The parametric images display DVR values (rather than BPND) to illustrate the presence of radiotracer uptake in regions outside the brain (e.g. scalp, sinuses) which would not be evident with using a threshold to eliminate negative BPND values. To minimize the effects of noise-dependent bias, a denoising algorithm (Christian et al., 2010) was performed on the time series images prior the parameter estimation.
RESULTS
Plasma Kinetics
The radioactive decay corrected time courses of the total whole blood and arterial plasma radioactivity and plasma radiotracer parent concentrations are shown in figure 1. Following the period of rapid clearance from the blood (>30 minutes), the tracers cleared from the arterial plasma at a rate of 0.0031 min-1 (MEF), 0.0078 min-1 (MPPF) and 0.0069 min-1 (WAY). The fraction of radioactivity in the plasma due to the parent radiotracer at 30 minutes after injection was 19% (MEF), 28% (MPPF) and 29% (WAY).
Figure 1.

Arterial plasma time-activity curves of [F-18]MPPF (left), [F-18]mefway (center), and [C-11]WAY100635 (right). The data for all of the studies have been normalized to injected dose and multiplied by the animal weight (kBq/cc/i.d.*kg*1000) for the total plasma radioactivity (◇) and the parent plasma radioactivity (□).
Cerebellar Kinetics
The cerebellar time-activity curves of the radiotracers through the CB are shown in figure 2. Similar to the plasma time-activity curves, the plots demonstrate fast and slow components of clearance. An exponential fit to the slow component (t > 30 minutes) reveals a clearance rate of 0.010 min−1 (MEF), 0.011 min−1 (MPPF) and 0.014 min−1 (WAY), which is the same rank order as the plasma clearance for each radiotracer.
Figure 2.

Cerebellar time-activity curves for [F-18]MPPF ( ), [F-18]mefway (
 ), and [C-11]WAY100635 (
 ). A The time course for all the studies, normalized to injected dose and multiplied by the animal weight (kBq/cc/i.d.*kg*1000) to illustrate the variability in each study. B The cerebellar time course averaged for each radiotracer averaged over all the subjects.
The cerebellar data were modeled as single-tissue compartment and two-tissue compartment (k3, k4) configurations. For all of the studies, the single-tissue compartment model was selected as the most appropriate model to describe the cerebellar time activity curves based upon the akaike information criteria. The parameter estimates for the single-compartment model fitting are shown in Table 1. Also given in the table are the nondisplaceable distribution volumes (VND = K1/k2), these values did not change by more than 10% when the two-tissue compartment parameter estimates were used indicating that the potential presence of small levels of specific binding in this region left the measure of VND largely unchanged.
Table 1.
Rate Constants in the Cerebellum
| K1 | M1 | M2 | M3 | M4 | mean | s.d. | |
|---|---|---|---|---|---|---|---|
| [F-18]MEFWAY | 0.59 | 1.34 | 1.14 | 0.99 | 1.02 | 0.32 | |
| [F-18]MPPF | * | 0.90 | 1.32 | 0.78 | 1.00 | 0.28 | |
| [C-11]WAY100635 | 0.51 | – | 1.10 | 0.62 | 0.74 | 0.31 | |
| k2 | |||||||
| [F-18]MEFWAY | 0.12 | 0.38 | 0.27 | 0.29 | 0.27 | 0.11 | |
| [F-18]MPPF | * | 0.29 | 0.45 | 0.27 | 0.34 | 0.10 | |
| [C-11]WAY100635 | 0.20 | – | 0.42 | 0.23 | 0.28 | 0.12 | |
| DVND | |||||||
| [F-18]MEFWAY | 4.92 | 3.53 | 4.22 | 3.41 | 4.02 | 0.70 | |
| [F-18]MPPF | * | 3.10 | 2.93 | 2.89 | 2.97 | 0.11 | |
| [C-11]WAY100635 | 2.55 | – | 2.62 | 2.70 | 2.62 | 0.08 |
Arterial plasma samples were not acquired for the M1 [F-18]MPPF scan.
The standard deviation of the individual K1 and k2 were < 5% as approximated from the covariance matrix of the parameter estimates.
Kinetics in Regions with Specific 5-HT1A Binding
The brain regions with the highest specific binding of the radiotracers were the MTC and the ACG as shown in figure 3. Intermediate binding was seen in the temporopolar cortex and dorsal lateral prefrontal cortex and the RN. Significant binding was seen throughout the cortical regions, including the IC, temporal and frontal gyri. A comparison of the time course for the radiotracers in the MTC and IC regions is shown in figure 4. The time course is also plotted as a ratio with the CB concentration to provide an indication of when the psuedoequilibrium between bound-to- nondisplaceable binding occurs. For [F-18]MPPF, a plateau is reached in this ratio by approximately 30 minutes in the high binding regions. The target to CB ratios are very similar for [C-11]WAY100635 and [F-18]mefway, reaching a plateau by approximately 60 minutes in the IC, but not reaching a plateau within the 2 hour scanning period in the high uptake regions. The estimates of the binding potential (BPND) for each of the radiotracers are given in table 2.
Figure 3.
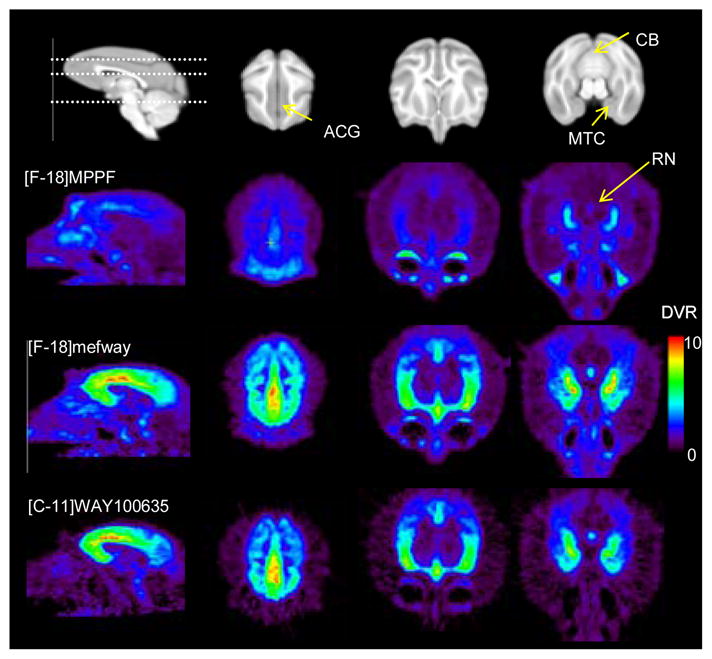
A comparison of [F-18]MPPF, [F-18]mefway and [C-11]WAY100635 in the rhesus monkey brain (M1). The top row is a skull stripped T1 MRI, with the dotted line illustrating the planes of the 3 transaxial slices highlighting radiotracer binding. The parametric images of distribution volume ratio (DVR) are scaled from 0 to 10.
Figure 4.

Time-activity curves for MTC (top) and IC (bottom) with [F-18]MPPF (), [F-18]mefway (), and [C-11]WAY100635 (). The left panel shows the time course for all the studies, normalized to injected dose and multiplied by the animal weight (kBq/cc/i.d.*kg*1000). The right panel shows the time course of the ratio of the regions to the CB. The lines represent the averages over all subjects for [F-18]MPPF (long dash short dash), [F-18]mefway (long dash line), and [C-11]WAY100635 (solid line).
Table 2.
BPND in the Regions with Specific 5-HT1A Binding
| MTC | M1 | M2 | M3 | M4 | mean | s.d. | |
|---|---|---|---|---|---|---|---|
| [F-18]MEFWAY | 7.23 | 8.25 | 7.17 | 6.77 | 7.36 | 0.63 | |
| [F-18]MPPF | 3.01 | 3.67 | 2.99 | 2.88 | 3.14 | 0.36 | |
| [C-11]WAY100635 | 5.97 | - | 8.37 | 6.66 | 7.00 | 1.24 | |
| ACG | [F-18]MEFWAY | 6.92 | 7.00 | 5.87 | 8.82 | 7.15 | 1.23 |
| [F-18]MPPF | 2.05 | 2.19 | 1.93 | 2.30 | 2.12 | 0.16 | |
| [C-11]WAY100635 | 6.90 | - | 7.64 | 9.21 | 7.92 | 1.18 | |
| RN | [F-18]MEFWAY | 4.06 | 4.00 | 2.85 | 3.84 | 3.69 | 0.57 |
| [F-18]MPPF | 1.49 | 1.71 | 0.98 | 1.18 | 1.34 | 0.32 | |
| [C-11]WAY100635 | 3.97 | - | 2.66 | 3.17 | 3.27 | 0.66 | |
| IC | [F-18]MEFWAY | 4.51 | 3.57 | 3.72 | 4.83 | 4.16 | 0.61 |
| [F-18]MPPF | 1.24 | 1.11 | 0.98 | 1.28 | 1.15 | 0.14 | |
| [C-11]WAY100635 | 4.08 | - | 4.11 | 5.77 | 4.65 | 0.97 |
DISCUSSION
This study compares the in vivo kinetics of three 5-HT1A antagonist PET radiotracers in the rhesus monkey. There have been numerous studies in humans and animal models using [C-11]WAY100635 and [F-18]MPPF to study possible 5-HT1A disruption in neuropsychiatrc illness. [F-18]Mefway was developed to provide an F-18 labeled radiotracer with suitable in vivo kinetics for PET 5-HT1A assay throughout the regions of the brain with significant 5-HT1A receptor expression. The results indicate that [F-18]mefway and [C-11]WAY100635 have very similar in vivo kinetics throughout the regions of the brain and provides a specific-to-nonspecific binding ratio of 2–3 times greater than [F-18]MPPF in the rhesus monkey.
Plasma and Cerebellar Kinetics
The time course of parent radioligand in the arterial plasma was very much alike for all three compounds. A rapid decrease over the first several minutes was followed by a slow clearance of the compound out to the end of the study. The [F-18]mefway cleared from the arterial plasma at approximately half the rate of the other two compounds, however, in all cases the mean clearance time was of the same order as period of measurement (30 – 90 minutes) for the exponential component thus reducing the precision of this parameter estimate. The assay of parent compound was performed by ethyl acetate extraction and this fraction could have also included lipophilic metabolites. We made no attempt to further characterize lipophilic species using HPLC or thin layer chromatography, as our previous measurements revealed only a small fraction (<10%) of radiolabeled lipophilic metabolites of [F-18]mefway in the rhesus monkey (Saigal et al., 2006) and we conclude that only a small portion of the CB PET signal may be due to nonparent compound.
The CB is frequently used as a reference region for 5-HT1A PET studies to provide information of the radiotracer’s kinetics in the absence of specific binding. In humans, there have been several reports on the presence of small, yet significant, levels of specific 5-HT1A binding in the CB (Hirvonen et al., 2007; Parsey et al., 2005a). CB time-activity curves were analyzed with both a one- and two-compartment model to determine if additional parameters (k3, k4) were needed to account for specific binding. Of the 10 studies acquired with arterial blood samples, only one study ([F-18]MPPF in M4) showed a significant improvement in the data description with the two-compartment model. However, for this study only the k3 parameter was significantly larger than zero and this additional term may be attributed to imprecision in the measurement of metabolites. There are examples with PET radiotracers (e.g. [C-11]tropanyl benzilate) where the binding and dissociation are sufficiently rapid that a two-compartment model cannot resolve the binding and delivery processes(Koeppe et al., 1994). However, based upon the similarities of the in vivo kinetics of [F-18]mefway with [C-11]WAY100635 in the high binding regions and the reported in vivo rate constants of [C-11]WAY1006351(Gunn et al., 1998), it is not likely that the delivery and the binding processes are being coupled in the single-compartment description of these data. We conclude that the potential levels of specific 5-HT1A binding in the CB of the rhesus monkey are below the threshold of detection for the methodologies employed in this work and these data suggest that the CB is a reasonable reference region for [F-18]mefway.
In comparing the nondisplaceable distribution volume (VND = K1/k2), these data indicate a rank order of [F-18]mefway > [F-18]MPPF > [C-11]WAY100635. The tissue to plasma transport (K1) is approximately equal for mefway and MPPF, but the efflux constant (k2) is larger for MPPF, resulting in a faster clearance from the tissue for this radiotracer. MPPF has been shown to be a substrate for p-glycoprotein (Pgp) (Passchier et al., 2000), and the presence of this transmembrane efflux pump increases the k2. Neither mefway nor WAY100635 have been found to be Pgp substrates. Of the three compounds, [C-11]WAY100635 displayed the smallest K1 and, in turn, the lowest VND.
Regions with Specific 5-HT1A Binding
The CG and the MTC were the brain regions demonstrating the highest levels of 5-HT1A binding for all three radiotracers. The region of highest focal binding was observed in the anterior hippocampus (within the region of the MTC), with elevated uptake seen throughout the entire hippocampal structure. There was no attempt to define the boundaries or subregions of the hippocampus without MRI scans for each individual. Many of the cortical areas were visually distinguishable on the [C-11]WAY100635 and [F-18]mefway scans, with elevated binding seen throughout the entire cingulate gyrus, orbitofrontal gyrus, central gyrus, superior and medial frontal gyri, temporal gyrus, and insula cortex. Reduced but detectable binding was observed in the occipital cortex. These cortical regions were not as visually distinct on the [F-18]MPPF data. The RN were clearly defined with all three radiotracers.
Figure 4 displays the target to CB ratios for the radiotracers during the course of the study. A plateau of this ratio represents a psuedoequilibrium of the two regions, a point at which the concentration in the free and the bound states are changing at the same rate. It is often desirable to acquire time series data until this plateau is reached to avoid possible flow dependent biases in the estimation of specific binding. It can be seen that in a region of the intermediate binding (IC), pseudoequlibrium is reached by 60 minutes for [C-11]WAY100635 and [F-18]mefway and by approximately 20 minutes for [F-18]MPPF. In the high binding region of the MTC, a plateau is not reached within the total time of acquisition for [C-11]WAY100635 and [F-18]mefway. Although the presence of psuedoequilibrium is not a necessary condition for accurate estimation of specific binding when using the Logan graphical method, it does suggest that a longer period may be required for linearization of the functional equations to avoid underestimation (i.e. negative bias) of the DVR parameter. For all four subjects it was found that the functional equation was linear starting at 40 minutes (i.e. t*=40) when the mean efflux term was excluded from the functional equation (i.e. Cref/k̄2 = 0) for [C-11]WAY100635 and [F-18]mefway and a scanning duration of 90 minutes provided an adequate period for stable BPND estimation. For the [F-18]MPPF studies, the functional equations were linear within several minutes following injection and a shorter scanning duration is allowable for stable parameter estimation. An example of the Logan plot is shown in figure 5 in the region of the ACG for subject M4.
Figure 5.
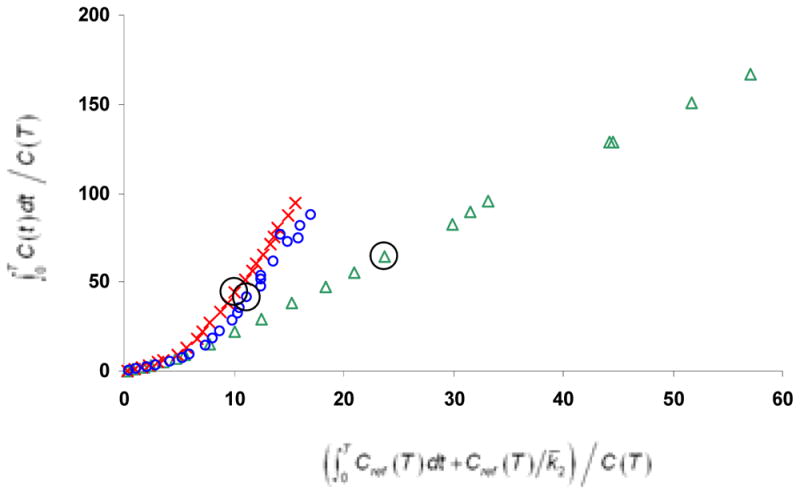
Logan DVR plots of the ACG region for [F-18]MPPF (), [F-18]mefway (), and [C-11]WAY100635 (). For these curves, the term Cref/k̄2 was set to 0 to illustrate the period of linearization with no a priori assumptions of the mean k̄2 parameter. The circles around the three points correspond to the 40 minute data point. The data for [F-18]mefway displays only the first 90 minutes to be consistent with the [C-11]WAY100635 and the [F-18]MPPF displays only 80 minutes to scale the axes for enhanced visualization.
Potential Mass Effects
Because there was a large variation in the injected mass of the three ligands, the potential effects of reduced specific binding due to competing unlabeled ligand must be closely examined. The shorter half-life of the [C-11] radiolabel resulted in a larger amount of injected mass for the [C-11]WAY100635 studies because of the decrease in specific activity due to the transport time needed to deliver the radioligand to the animal imaging facility. For the three studies reported herein there was an injected WAY100635 mass of 1.0, 1.7 and 0.7 nmol/kg, for M1, M3 and M4, respectively. Hume and colleagues performed detailed experiments in rats using [H-3]WAY100635 and reported an ED50 of 4.78 nmol/kg (Hume et al., 1994). The ED50 represents a measure of the injected dose required to reduce the maximal binding by one-half. Using this value and the relation for receptor occupancy and ED50 (Hume et al., 1998), it can be estimated that the occupancies of the WAY100635 at the 5-HT1A receptor sites are 18% (M1), 26% (M3) and 13% (M4) for these [C-11]WAY100635 studies. The increased receptor occupancy by the unlabeled drug will result in a decreased PET measured BPND due to the competition between the radiolabeled and unlabeled drugs. However, the measured BPND values in Table 2 do not scale inversely with the injected mass of [C-11]WAY100635. For example, if we consider the region of the ACG, the BPND of M3 study ranks in the middle for [C-11]WAY100635 and lowest for the [F-18]MPPF and [F-18]mefway studies despite having the highest WAY100635 mass injection. We speculate that the ED50 (and apparent KD) may be higher in rhesus monkeys than rats and that the significance of competing unlabeled WAY100635 mass may not be detectable in this small sample size. However, it is not possible to measure the effects of competing mass for the [C-11]WAY100635 studies without performing additional multi-dose scans on each animal. Therefore, we must issue the caveat that the average BPND values of [C-11]WAY100635 reported here may be underestimated by an upper limit of 20% due to nontracer conditions. For the sake of comparison, if a comparable ED50 is assumed for [F-18]MPPF and [F-18]mefway, then the occupancy of the unlabeled drug is less than 3% for both radiotracers.
CONCLUSIONS
In summary, [F-18]mefway has similar in vivo kinetic behavior to [C-11]WAY100635, with both being highly selective PET radiotracers for 5-HT1A receptor binding. [F-18]Mefway and [C-11]WAY100635 provide a greater dynamic range in BPND measurement compared to [F-18]MPPF but require a longer study duration to achieve stable BPND estimates. In the rhesus monkey, [F-18]MPPF may be a superior choice for assaying 5-HT1A binding in the high uptake regions of the cingulate cortex and hippocampus due to its rapid time of equilibration, however, will lack specific binding sensitivity in the brain regions with intermediate to lower 5-HT1A receptor densities, for example the RN. [F-18]Mefway offers the advantage of increased 5-HT1A detection sensitivity throughout the brain regions with low, intermediate, and high 5-HT1A expression and an improvement of counting statistics compared to [C-11]WAY100635, due to the 110 minute half life of the F-18 radiolabel. Considering just the effects of radioactive decay, [F-18]mefway will yield a 12-fold higher count rate at 90 minutes post-injection compared to [C-11]WAY100635 for injections of equal activity, resulting in significant improvements in counting statistics in the low count regions such as the CB. Additional studies are needed to demonstrate if these favorable imaging characteristics of [F-18]mefway will be realized in humans and to increase our understanding of the neurobiology underlying mood and anxiety-related neuropsychiatric illnesses.
Acknowledgments
The authors would like to thank the following for their contributions to this research: Elizabeth Ahlers, Maxim Slesarev, and Julie Larson for data acquisition and processing; the staff at the Harlow Center for Biological Psychology at the University of Wisconsin (RR000167) for nonhuman primate handling. Drs. Alex Converse and Nick Vandehey for technical discussions. Dr. Suresh Pandey and Neil Saigal for assistance with the radiochemical synthesis of mefway. This work was supported by NIH grants AA017706, MH086014, AG030524, AA12277, P30HD003352.
References
- Akaike H. A new look at statistical-model identification. IEEE Trans Auto Control AC. 1974;19(6):716–723. [Google Scholar]
- Aznavour N, Zimmer L. [F-18]MPPF as a tool for the in vivo imaging of 5-HT1A receptors in animal and human brain. Neuropharmacology. 2007;52(3):695–707. doi: 10.1016/j.neuropharm.2006.09.023. [DOI] [PubMed] [Google Scholar]
- Carson RE, Wu YJ, Lang LX, Ma Y, Der MG, Herscovitch P, Eckelman WC. Brain uptake of the acid metabolites of F-18-labeled WAY-100635 analogs. J Cereb Blood Flow Metab. 2003;23(2):249–260. doi: 10.1097/01.WCB.0000046145.31247.7A. [DOI] [PubMed] [Google Scholar]
- Christian BT, Vandehey NT, Floberg JM, Mistretta CA. Dynamic PET denoising with HYPR processing. J Nucl Med. 2010;51(7):1147–1154. doi: 10.2967/jnumed.109.073999. [DOI] [PMC free article] [PubMed] [Google Scholar]
- Delforge J, Syrota A, Mazoyer BM. Identifiability Analysis and parameter-identification of an invivo ligand-receptor model from PET data. IEEE Trans Biomed Eng. 1990;37(7):653–661. doi: 10.1109/10.55673. [DOI] [PubMed] [Google Scholar]
- Gunn RN, Sargent PA, Bench CJ, Rabiner EA, Osman S, Pike VW, Hume SP, Grasby PM, Lammertsma AA. Tracer kinetic modeling of the 5-HT1A receptor ligand [carbonyl-C-11]WAY-100635 for PET. Neuroimage. 1998;8(4):426–440. doi: 10.1006/nimg.1998.0379. [DOI] [PubMed] [Google Scholar]
- Hirvonen J, Kajander J, Allonen T, Oikonen V, Nagren K, Hietala J. Measurement of serotonin 5-HT1A receptor binding using positron emission tomography and [carbonyl-C-11]WAY-100635 - considerations on the validity of cerebellum as a reference region. J Cereb Blood Flow Metab. 2007;27(1):185–195. doi: 10.1038/sj.jcbfm.9600326. [DOI] [PubMed] [Google Scholar]
- Hume SP, Ashworth S, Opackajuffry J, Ahier RG, Lammertsma AA, Pike VW, Cliffe IA, Fletcher A, White AC. Evaluation of [O-methyl-H-3]WAY-100635 as an in-vivo radioligand for 5-HT1A receptors In rat-brain. Eur J Pharmacol. 1994;271(2–3):515–523. doi: 10.1016/0014-2999(94)90813-3. [DOI] [PubMed] [Google Scholar]
- Hume SP, Gunn RN, Jones T. Pharmacological constraints associated with positron emission tomographic scanning of small laboratory animals. Eur J Nucl Med. 1998;25(2):173–176. doi: 10.1007/s002590050211. [DOI] [PubMed] [Google Scholar]
- Hwang DR, Simpson NR, Montoya J, Mann JJ, Laruelle M. An improved one-pot procedure for the preparation of [C-11-carbonyl]-WAY100635. Nuc Med And Biol. 1999;26(7):815–819. doi: 10.1016/s0969-8051(99)00056-6. [DOI] [PubMed] [Google Scholar]
- Jenkinson M, Smith S. A global optimization method for robust affine registration of brain images. Med Image Anal. 2001;5(2):143–156. doi: 10.1016/s1361-8415(01)00036-6. [DOI] [PubMed] [Google Scholar]
- Kessler RM, Ansari MS, Depaulis T, Schmidt DE, Clanton JA, Smith HE, Manning RG, Gillespie D, Ebert MH. High-affinity dopamine-D2 receptor radioligands.1. regional rat-brain distribution of iodinated benzamides. J Nucl Med. 1991;32(8):1593–1600. [PubMed] [Google Scholar]
- Koeppe RA, Frey KA, Mulholland GK, Kilbourn MR, Buck A, Lee KS, Kuhl DE. [C-11] Tropanyl benzilate binding to muscarinic cholinergic receptors - methodology and kinetic modeling alternatives. J Cereb Blood Flow Metab. 1994;14(1):85–99. doi: 10.1038/jcbfm.1994.13. [DOI] [PubMed] [Google Scholar]
- Kumar JSD, Mann JJ. PET tracers for 5-HT1A receptors and uses thereof. Drug Discovery Today. 2007;12:748–756. doi: 10.1016/j.drudis.2007.07.008. [DOI] [PubMed] [Google Scholar]
- Logan J, Fowler JS, Volkow ND, Wang GJ, Ding YS, Alexoff DL. Distribution volume ratios without blood sampling from graphical analysis of PET data. J Cereb Blood Flow Metab. 1996;16(5):834–840. doi: 10.1097/00004647-199609000-00008. [DOI] [PubMed] [Google Scholar]
- Mazoyer BM, Huesman RH, Budinger TF, Knittel BL. Dynamic PET data-analysis. Journal Of Computer Assisted Tomography. 1986;10(4):645–653. doi: 10.1097/00004728-198607000-00020. [DOI] [PubMed] [Google Scholar]
- Muzic RF, Cornelius S. COMKAT: Compartment model kinetic analysis tool. J Nucl Med. 2001;42(4):636–645. [PubMed] [Google Scholar]
- Parsey RV, Arango V, Olvet DM, Oquendo MA, Van Heertum RL, Mann JJ. Regional heterogeneity of 5-HT1A receptors in human cerebellum as assessed by positron emission tomography. J Cereb Blood Flow Metab. 2005a;25(7):785–793. doi: 10.1038/sj.jcbfm.9600072. [DOI] [PubMed] [Google Scholar]
- Parsey RV, Belanger MJ, Sullivan GM, Simpson NR, Stabin MG, Van Heertum R, Mann JJ. Biodistribution and radiation dosimetry of C-11-WAY100635 in humans. J Nucl Med. 2005b;46(4):614–619. [PubMed] [Google Scholar]
- Passchier J, van Waarde A, Doze P, Elsinga PH, Vaalburg W. Influence of P-glycoprotein on brain uptake of [F-18]MPPF in rats. Eur J Pharmacol. 2000;407(3):273–280. doi: 10.1016/s0014-2999(00)00752-4. [DOI] [PubMed] [Google Scholar]
- Pike VW, Halldin C, Wikstrom H, Marchais S, McCarron JA, Sandell J, Nowicki B, Swahn CG, Osman S, Hume SP, Constantinou M, Andree B, Farde L. Radioligands for the study of brain 5-HT1A receptors in vivo -Development of some new analogues of WAY. Nuc Med Biol. 2000;27(5):449–455. doi: 10.1016/s0969-8051(00)00110-4. [DOI] [PubMed] [Google Scholar]
- Saigal N, Pichika R, Easwaramoorthy B, Collins D, Christian BT, Shi BZ, Narayanan TK, Potkin SG, Mukherjee J. Synthesis and biologic evaluation of a novel serotonin 5-HT1A receptor radioligand, F-18-labeled mefway, in rodents and imaging by PET in a nonhuman primate. J Nucl Med. 2006;47(10):1697–1706. [PubMed] [Google Scholar]
- Tai YC, Chatziioannou A, Siegel S, Young J, Newport D, Goble RN, Nutt RE, Cherry SR. Performance evaluation of the microPET P4: a PET system dedicated to animal imaging. Phys Med Biol. 2001;46(7):1845–1862. doi: 10.1088/0031-9155/46/7/308. [DOI] [PubMed] [Google Scholar]