

Abstract
Calcium-dependent electrical activity plays a significant role in neurotransmitter specification at early stages of development. To test the hypothesis that activity-dependent differentiation depends on molecular context, we investigated the development of dopaminergic neurons in the CNS of larval Xenopus laevis. We find that different dopaminergic nuclei respond to manipulation of this early electrical activity by ion channel misexpression with different increases and decreases in numbers of dopaminergic neurons. Focusing on the ventral suprachiasmatic nucleus and the spinal cord to gain insight into these differences, we identify distinct subpopulations of neurons that express characteristic combinations of GABA and neuropeptide Y as cotransmitters and Lim1,2 and Nurr1 transcription factors. We demonstrate that the developmental state of neurons identified by their spatial location and expression of these molecular markers is correlated with characteristic spontaneous calcium spike activity. Different subpopulations of dopaminergic neurons respond differently to manipulation of this early electrical activity. Moreover, retinohypothalamic circuit activation of the ventral suprachiasmatic nucleus recruits expression of dopamine selectively in reserve pool neurons that already express GABA and neuropeptide Y. The results are consistent with the hypothesis that spontaneously active neurons expressing GABA are most susceptible to activity-dependent expression of dopamine in both the spinal cord and brain. Because loss of dopaminergic neurons plays a role in neurological disorders such as Parkinson's disease, understanding how subpopulations of neurons become dopaminergic may lead to protocols for differentiation of neurons in vitro to replace those that have been lost in vivo.
Introduction
Calcium spike activity in embryonic and larval Xenopus regulates developmental specification of glutamate, GABA, glycine, and acetylcholine in neurons of the spinal cord (Borodinsky et al., 2004), dopamine in neurons of the ventral suprachiasmatic nucleus (VSC) of the hypothalamus (Dulcis and Spitzer, 2008), and serotonin in neurons of the raphe (Demarque and Spitzer, 2010). Neurons of the dopaminergic (DA) system are distinguishable by their connectivity and function and include separate populations in the telencephalon, diencephalon, mesencephalon, and spinal cord (Smeets and González, 2000). The DA system in Xenopus consists of the telencephalic olfactory bulb (OB), concerned with olfaction and kin recognition (Blaustein and Waldman, 1992); the diencephalic VSC and dorsolateral suprachiasmatic nuclei (DLSC) with roles in background adaptation (Ubink et al., 1998); and the mesencephalic posterior tuberculum (PT), equivalent to the substantia nigra and ventral tegmental area (VTA) in mammals, with roles in movement and reward (Márin et al., 1997; Endepols et al., 2004). The DA neurons of the spinal cord are CSF-contacting cells that extend an ascending axon toward the brain and are believed to respond to changes in the CSF (González et al., 1993, 1994; Heathcote and Chen, 1994; Vígh et al., 2004).
DA neurons are a heterogeneous population that expresses additional neurotransmitters. In adult Xenopus, neuronal subpopulations within the VSC coexpress dopamine with GABA and/or neuropeptide Y (NPY) (de Rijk et al., 1992; Tuinhof et al., 1994; Ubink et al., 1998). In lamprey, dopamine and GABA colocalize in different DA nuclei (Barreiro-Iglesias et al., 2009). In rat, dopamine is coexpressed with GAD in the substantia nigra (Hédou et al., 2000) and in mouse dopamine is coexpressed with VGlut2 in the VTA (Dal Bo et al., 2008; Mendez et al., 2008). In addition, heterogeneity is observed in the transcription factors expressed by DA neurons. In Xenopus, Pax6 is expressed in the diencephalon and OB during development (Moreno et al., 2008). Pax6 has been associated with the development of diencephalic and OB DA neurons in mice (Vitalis et al., 2000; Mastick and Andrews, 2001; Kohwi et al., 2005) and zebrafish (Wullimann and Rink, 2001). Transcription factors Lim1 and Lim2 are expressed in the developing diencephalon in Xenopus (Moreno et al., 2004) and in the diencephalon of embryonic mouse brain (Mastick and Andrews, 2001). Nurr1 has been linked to development of mouse mesencephalic DA neurons in both the VTA and substantia nigra (Zetterström et al., 1996, 1997; Jankovic et al., 2005; Ang, 2006) and zebrafish (Blin et al., 2008).
Because expression of dopamine is regulated by calcium spike activity in the VSC (Dulcis and Spitzer, 2008), we determined whether activity has a general role in dopamine specification across the nervous system. We find that DA neurons in different nuclei express different combinations of transmitters and transcription factors. Developing neurons exhibit distinct patterns of spontaneous calcium spike activity and show different changes in the number of DA neurons in response to manipulations of electrical activity. We conclude that activity-dependent dopamine specification is favored by spontaneous activity in GABAergic neurons.
Materials and Methods
Animals.
Xenopus laevis embryos were generated by in vitro fertilization and reared at 20–22°C. Animals were staged according to Nieuwkoop and Faber (1967). Because tyrosine hydroxylase (TH) expression in the annulus of the VSC has been shown to be light dependent (Dulcis and Spitzer, 2008), we standardized light exposure (12 h light/dark cycle) and background (gray) in our experiments. All protocols were approved by the University of California, San Diego Institutional Animal Care and Use Committee.
Immunocytochemistry.
Larvae were fixed in 4% paraformaldehyde and 0.025% glutaraldehyde PBS at pH 7.4 for 1–2 h at 4°C. After fixation, larvae were rinsed twice in 1× Dulbecco's calcium–magnesium-free PBS (1× CMF–PBS) (Sigma) and either cryoprotected in 30% sucrose in 1× CMF–PBS and embedded in optimal cutting temperature medium (Tissue-Tek) for cryostat sections or rinsed and incubated in PBS–0.5% Triton X-100 (PBT) for 5 d for whole mounts. Cryostat 10 μm sections were taken following an anterior to posterior progression through the whole brain or through 600–800 μm of spinal cord starting 300–400 μm caudal to the eyes. For whole mounts, the brain and spinal cord of larvae were dissected after permeabilization in PBT. Sections or dissected whole mounts were permeabilized in PBT for 1 h and then incubated in 1% fish gelatin (Sigma) in 1× CMF–PBS blocking solution for 1 h at 20–22°C. One or 2 night incubation at 4°C with primary antibodies to TH (Imgenex), GABA (Millipore Bioscience Research Reagents), NPY (Immunostar), Pax6 (Covance), Nurr1 (Santa Cruz Biotechnology), Lim3 (Millipore Bioscience Research Reagents), and Lim1,2 and Isl1,2 (Developmental Studies Hybridoma Bank) was followed by incubation with fluorescently tagged secondary antibodies for 1 h 30 min at 20–22°C. Sections were mounted with either Vectashield mounting medium with 4′,6′-diamidino-2-phenylindole (DAPI) or Fluoromount (Southern Biotechnology); whole mounts were cleared in successive washes of 30, 50, and 80% glycerol and mounted in 80% glycerol. Immunoreactivity of singly stained sections was examined with a 20× water-immersion objective on a Carl Zeiss Axioscope, using a xenon arc lamp attenuated by neutral density filters. Immunoreactivity of whole mounts and of double and triple stainings of sections was examined on a SP5 Leica confocal system; z-stacks were acquired to confirm colocalization and to generate through-series projections. For both microscopes, appropriate filter combinations for excitation and emission were used for Alexa Fluor 488, Alexa Fluor 594, Alexa Fluor 647, DAPI, FITC, or cyanine 3 fluorophores. Images were acquired and analyzed with either Axiovision or Leica Application Suite software. TH, the rate-limiting enzyme for dopamine synthesis, was used as a marker for dopamine. This enzyme has been shown to be a good marker for the DA nuclei and spinal cord neurons described here because TH colocalizes with other DA markers, including dopamine, dopamine transporter, and vesicular monoamine transporter (González et al., 1994; Dulcis and Spitzer, 2008), although TH has also been used as marker for noradrenaline in the locus ceruleus (González et al., 1994).
Ion channel misexpression and light adaptation.
DNA constructs for the human inward rectifying potassium channel [hKir2.1 (Kir)] and the rat voltage-gated sodium channel [rNav2a αβ (Nav)] were gifts from E. Marban (Johns Hopkins University, Baltimore, MD) and W. Catterall (University of Washington, Seattle, WA). These constructs were subcloned, transcribed, and expressed in all cells by injecting mRNA into both blastomeres at the two-cell stage along with a fluorescent tracer, Cascade Blue dextran (Invitrogen), to identify successfully injected embryos (Borodinsky et al., 2004; Dulcis and Spitzer, 2008). Light-adaptation of stage 42 larvae was performed following the protocol described by Dulcis and Spitzer (2008).
Calcium imaging followed by immunostaining.
To image DA neurons in the VSC, we cut sections through the heads of larvae at the relevant stage and partially embedded these brain sections in low-melting-point agarose (Promega) in a well filled with saline. This method led to stable preparations for imaging. To image DA neurons in the spinal cord, embryos were pinned ventral side up with 0.10-mm-diameter stainless-steel Austerlitz Minuten pins (Fine Science Tools) to the side of a well carved in the middle of a Sylgard-coated dish (Dow Corning). Incubation in 1–2% collagenase in saline (in mm: 116.6 NaCl, 0.67 KCl, 1.31 MgSO4, 2.0 CaCl2, and 4.6 Tris, pH adjusted to 7.8 with HCl) for 15 min facilitated removal of tissue covering the ventral surface of the spinal cord, using forceps and tungsten needles. Brain sections and spinal cords were then rinsed in 2 mm calcium saline and incubated with Fluo-4 (5 μm Fluo-4 AM/0.01% pluronic acid F-127/1% DMSO) for 1 h at room temperature and gently washed in saline before imaging.
Calcium imaging of the brain was focused on the midventral region of the sections, using the eyes, ventricle, and optic chiasm as landmarks to identify the VSC region. Calcium imaging of the spinal cord was performed on a field of view covering the rostral to mid-spinal cord regions, spanning 1500 μm. The time-lapse imaging protocol lasted 30 min, acquiring images at 0.2 Hz on a Bio-Rad MRC-600 confocal microscope with a 20× water-immersion objective. Imaging was performed at stages 39, 40, and 41 for the VSC and at stages 27, 28, and 29/30 for the spinal cord. Brain sections and spinal cords were immediately fixed with EDAC (Sigma-Aldrich) (40 mg/1 ml 0.1× CMF–PBS) for 1 h at room temperature to fix the calcium indicator Fluo-4 (Invitrogen) (Dallwig and Deitmer, 2002) and then fixed for another hour in 4% paraformaldehyde plus 0.025% glutaraldehyde at 4°C. Three 1 h washes in 1× CMF–PBS were followed by permeabilization for 1–2 nights in PBT. Brain sections and spinal cords were then incubated in blocking solution (1% fish gelatin in 1× CMF–PBS) for 12–24 h. Brain sections were stained for TH, Lim1,2, and Nurr1; spinal cords were stained for TH and GABA. Incubation lasting 3–5 nights at 4°C was followed by 1 h 30 min incubation with appropriate secondary antibodies and PBS washes. Immunopreparations were imaged on a Leica SP5 confocal by acquisition of 50–100 μm optical stacks. Projection of the Fluo-4 channel was used to match the calcium imaging movie to the staining. Changes in fluorescence in identified cells were analyzed by digitizing the time-lapse videos on NIH ImageJ with the “Measure Stacks” plug-in by Bob Dougherty (OptiNav, Redmond, WA). A region of interest was drawn around the cell body, pixel intensity was measured across all frames of the movie, and intensity values were exported to Excel (Microsoft). Calcium spikes were identified on digitized traces as transients that increased in fluorescence 2× the baseline with a single-frame rise time. We analyzed spike incidence (number of spiking neurons as a percentage of the total number of neurons of that staining class) and frequency (number of spikes/30 min).
Statistical analysis.
The incidence of immunostaining determined per brain region or spinal cord was used to calculate a mean ± SEM, using Excel (see Figs. 1, 2, 4, 5, 8B, 10). To analyze changes in staining after perturbations of calcium spiking, we determined the mean staining incidence, normalized it to control, and calculated the mean ± SEM (see Figs. 3, 9). We determined the incidence and frequency of spontaneous calcium spiking for each subclass of neurons per brain slice or spinal cord and calculated the mean ± SEM (see Figs. 7, 8A). Statistical analyses were performed using the online software provided by BrightStat (Stricker, 2008). Comparisons between two groups were assessed by the nonparametric Mann–Whitney U test. For comparisons of more than two groups, the nonparametric Kruskal–Wallis test followed by Conover's post hoc test was used. Results are considered significant when p < 0.05.
Figure 1.
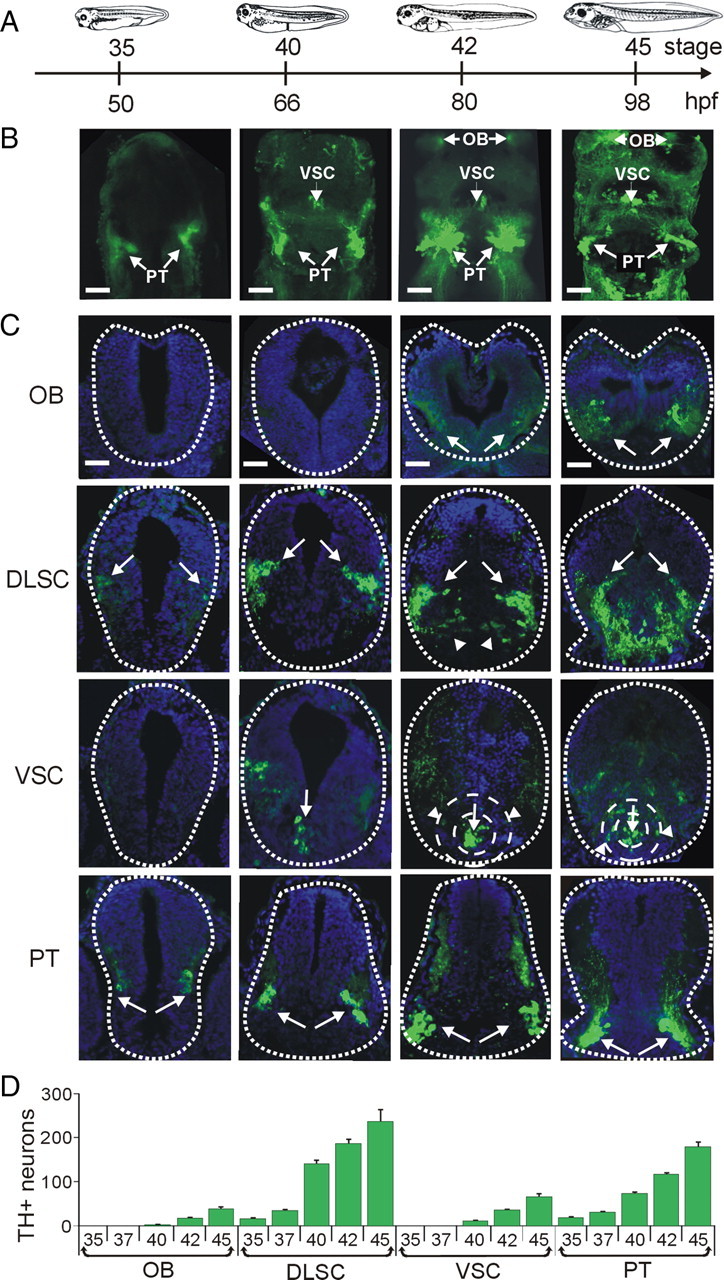
Development of brain dopaminergic nuclei. A, Developmental timeline showing stages and corresponding hours postfertilization (hpf) at which larvae were fixed for the images shown above. B, Whole-mount projections of brains stained for TH show caudal-to-rostral appearance of dopaminergic nuclei. Images are ventral side and rostral end up. The PT nucleus is visible from stage 35; by stage 40, the VSC can be detected; and by stage 42, the OB is also present. C, Cross sections through the brain were used for quantification of TH+ cells. TH staining is shown in green and DAPI staining of cell nuclei is shown in blue. Arrows point to TH+ cells in each section. The first row shows the OB, and the second row shows the DLSC. Arrowheads in this row point to a medial branch of the DLSC that becomes more prominent during development. The third row depicts the VSC. The arrows point to the core and the arrowheads point to TH+ cells in the annular region of the VSC, present from stage 42. The fourth row shows the PT nuclei. D, Quantification of the number of TH+ neurons per nucleus during development. Scale bars, 50 μm. Values are mean ± SEM for n ≥ 6 larvae per stage.
Figure 2.
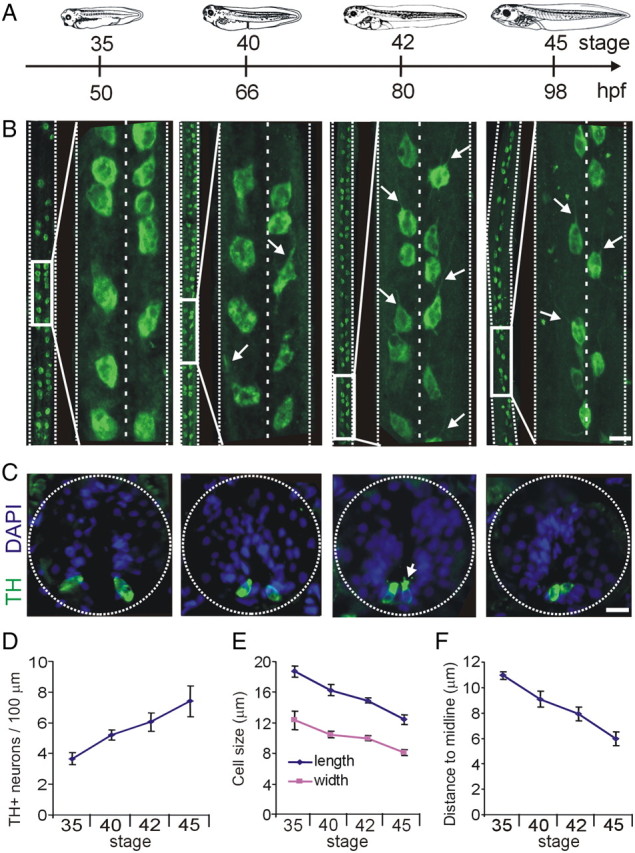
Development of spinal cord dopaminergic neurons. A, Developmental timeline as in Figure 1. B, Whole-mount projections of spinal cords stained for TH immunoreactivity. At each stage, large midbody segments of spinal cord are shown on the left side, and an inset expansion is shown on the right. Projections are shown ventral side and rostral end up. Arrows on the stages 40, 42, and 45 panels point to axons extending rostrally. C, Cross sections through the spinal cord at different stages of development. Dopaminergic spinal neurons are located on the ventral side of the spinal cord. The arrow points to microvilli and cilia extending into the central canal. D, Quantification of the number of neurons per 100 μm of spinal cord at different stages of development. E, Length and width measurements of dopaminergic spinal neurons. F, Quantification of the distance to the midline. Scale bars, 15 μm. Values are mean ± SEM for n ≥ 4 larvae per stage.
Figure 4.
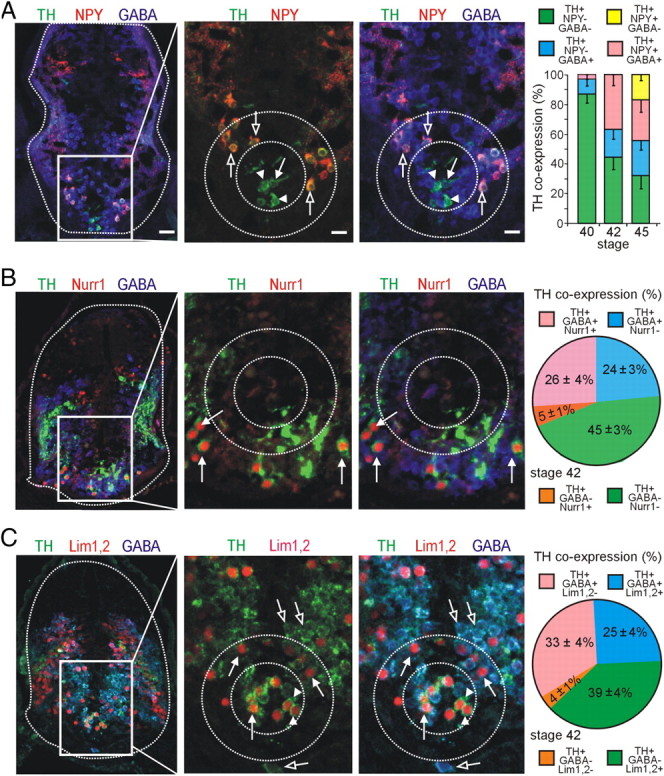
Coexpression of TH with other molecular markers during development of the VSC. GABA, NPY, or GABA/NPY are coexpressed in distinct regions of the VSC during development. A, Some TH+ cells in the core region (inner dashed circle) coexpress GABA (arrow), whereas others are GABA− (arrowheads). TH+ neurons in the annular region are TH+/GABA+/NPY+ (outer dashed circle, open arrows). Graph shows developmental changes in proportions of GABA and NPY coexpression with TH. B, TH+ cells of the outer annular region coexpress GABA and Nurr1 (arrows). This brain section depicts a more caudal region of the VSC. Graph shows the proportion of TH coexpression with GABA and Nurr1. C, TH+ cells of the core all coexpress Lim1,2 (arrowheads), but some are also GABA+ (arrows), whereas the TH+ cells in the annulus coexpress Lim1,2 and GABA (arrows). Cells in the outer annular region are Lim1,2− but coexpress TH and GABA (open arrows). Graph shows the proportion of TH coexpression with GABA and Lim1,2. A–C, Images are from stage 42 larvae. Scale bars (in A apply to all figures in each column): column 1, 80 μm; columns 2, 3, 40 μm. Values are mean ± SEM for n ≥ 4 larvae per stage.
Figure 5.
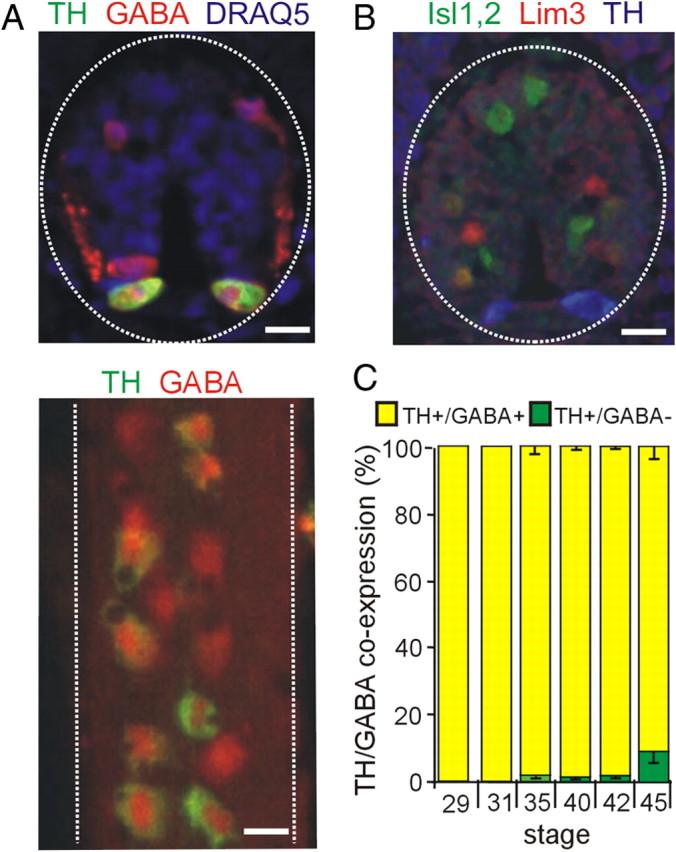
Coexpression of TH with GABA during development of the spinal cord. A, Top, Cross section through a stage 35 spinal cord shows coexpression of GABA in ventrally located dopaminergic cells. Dorsal GABAergic interneurons are also evident. Ventral side is down. Bottom, Whole mount of the spinal cord shows dopaminergic neurons within the rows of GABAergic ventral neurons in a stage 42 spinal cord. Ventral side is shown. B, TH does not colocalize with Lim3 or Isl1,2; stage 35 spinal cord. C, Percentage coexpression of TH and GABA during development. Scale bars, 15 μm. Values are mean ± SEM for n ≥ 4 late tail-bud embryos or larvae per stage.
Figure 8.

Spontaneous calcium spike activity and neurotransmitter expression in the spinal cord during TH acquisition. A, The incidence of calcium spiking is constant in spinal cord neurons at stages 27–29 (data not shown), but the frequency varies during this period: TH+/GABA+ neurons display a low and constant frequency of calcium spikes, whereas the TH−/GABA+ population shows an increase in frequency at stage 28 that decreases again by stage 29. **p < 0.01, comparing across stages; the Kruskal–Wallis test followed by Conover's post hoc analysis was used to determine statistical significance. B, The proportion of cells within the GABA-immunoreactive population of the ventral spinal cord that are TH−/GABA+ and TH+/GABA+ changes during development, with the first group decreasing and the second increasing between stages 27, 28, and 29/30. Significant differences between the TH−/GABA+ and TH+/GABA+ populations by stage (black asterisks; *p < 0.05 assessed by the Mann–Whitney U test) and across developmental stages for each cell population (colored asterisks; *p < 0.05 assessed by the Kruskal–Wallis test followed by Conover's post hoc analysis) are indicated. n ≥ 4 neural tubes with n ≥ 7 TH−/GABA+ or TH+/GABA+ neurons per neural tube per stage; values are mean ± SEM.
Figure 10.
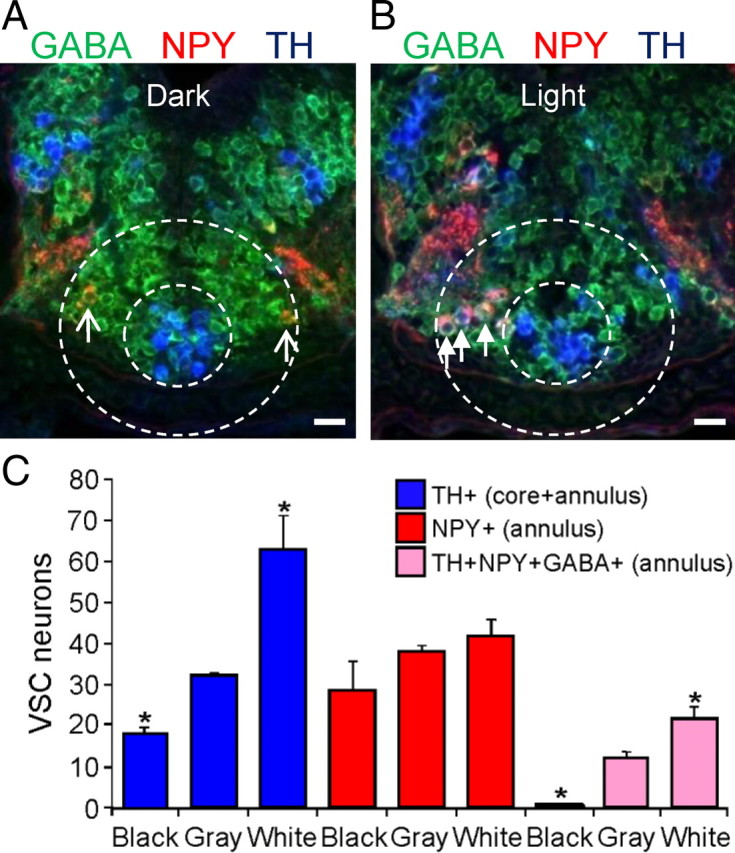
TH specification of NPY+/GABA+ VSC annular neurons after light adaptation. A, The VSC of a larva dark adapted on a black background for 2 h and triple stained for TH, NPY, and GABA is shown in a merged image of a transverse section. Arrows indicate TH−/NPY+/GABA+ neurons before induction of TH. B, The VSC of a larva light adapted on a white background for 2 h and triple stained for TH, NPY, and GABA in a merged image. Arrows indicate TH+/NPY+/GABA+ neurons after TH induction. A, B, Stage 42. Scale bars, 30 μm. C, Quantification of the number of neurons in the VSC that express TH, NPY, or TH+/NPY+/GABA+. Exposure to light increases and dark decreases the number of TH+ neurons recruited from the NPY+/GABA+ annular pool. n = 6 larvae; values are mean ± SEM. *p < 0.05 comparing light or dark conditions with low illumination on a gray background using the Mann–Whitney U test.
Figure 3.
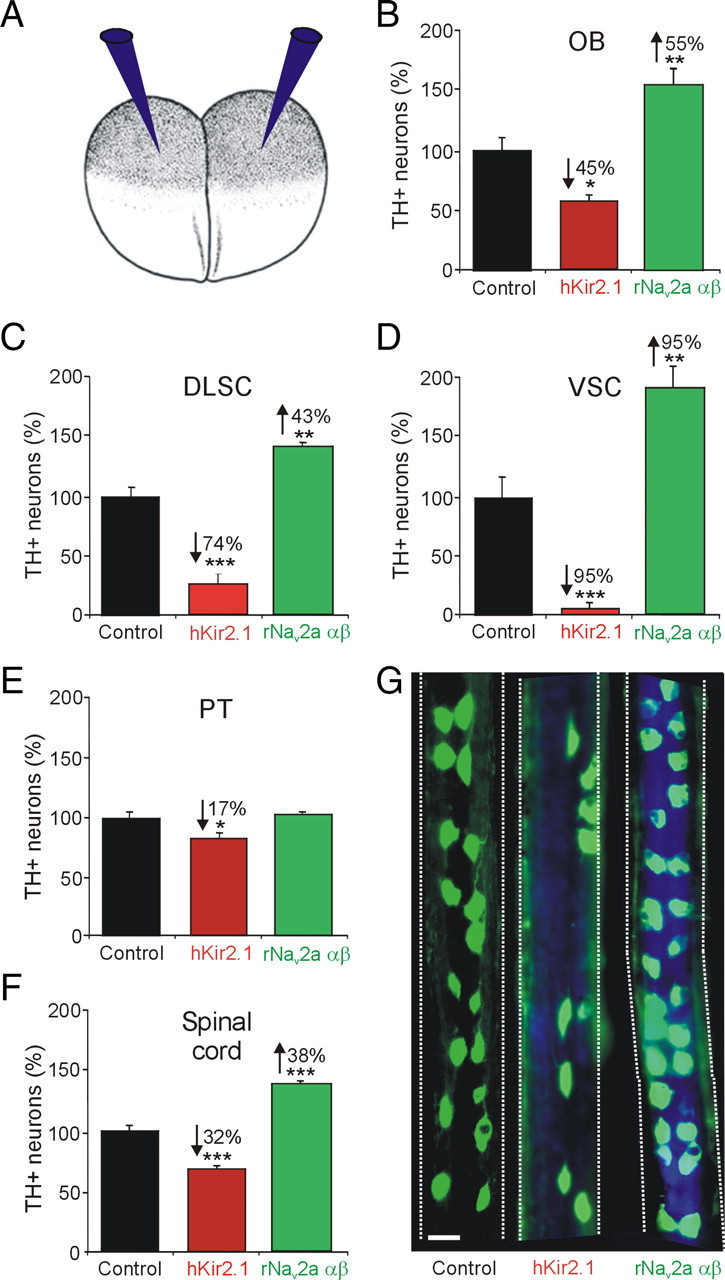
Dopaminergic specification is activity dependent. A, Embryos at the two-cell stage were injected bilaterally with either hKir2.1 or rNav2a αβ mRNA along with Cascade Blue tracer, to decrease or increase calcium spike activity, respectively (Borodinsky et al., 2004; Dulcis and Spitzer, 2008). B–F, Number of TH+ neurons (percentage) in activity-manipulated embryos in the OB (B), DLSC (C), VSC (D), PT (E), and spinal cord (F). G, Spinal cord whole mounts from stage 42 larvae stained for TH immunoreactivity (in green) show the effect of channel misexpression. The tracer (in blue) is seen in spinal cords from activity-manipulated larvae. Numerical percentage change is indicated in cases of significant difference (n ≥ 6 larvae per stage; values are mean ± SEM): *p < 0.05, **p < 0.01, ***p < 0.001, comparing control values with hKir2.1 or rNav2a αβ. The Mann–Whitney U test was used to assess statistical significance. Scale bar, 25 μm.
Figure 9.

Neurotransmitter expansion in the VSC and spinal cord of activity-manipulated larvae. A, The number of TH neurons in the VSC core and annulus increases upon overexpression of rNav2a αβ. Expansion of the TH phenotype occurs within the Lim1,2 population in both core and annulus (**p < 0.01, ***p < 0.001, compared with control by the Mann–Whitney U test), and the expansion in the annulus is significantly greater than the expansion in the core (*p < 0.05, comparing normalized control with rNav2a αβ values for the core and annulus with the Kruskal–Wallis test followed by the Conover's post hoc analysis). Stage 42; values are mean ± SEM for n = 6 embryos. B, rNav2a αβ overexpression expands the TH phenotype within the ventral GABA+ population of the spinal cord (*p < 0.05, comparing control vs rNav2a αβ values by the Mann–Whitney U test), increasing the number of clusters of TH+/GABA+ cells (*p < 0.05, comparing control vs rNav2a αβ values by the Mann–Whitney U test). Stage 35; values are mean ± SEM for n ≥ 4 larvae.
Figure 7.
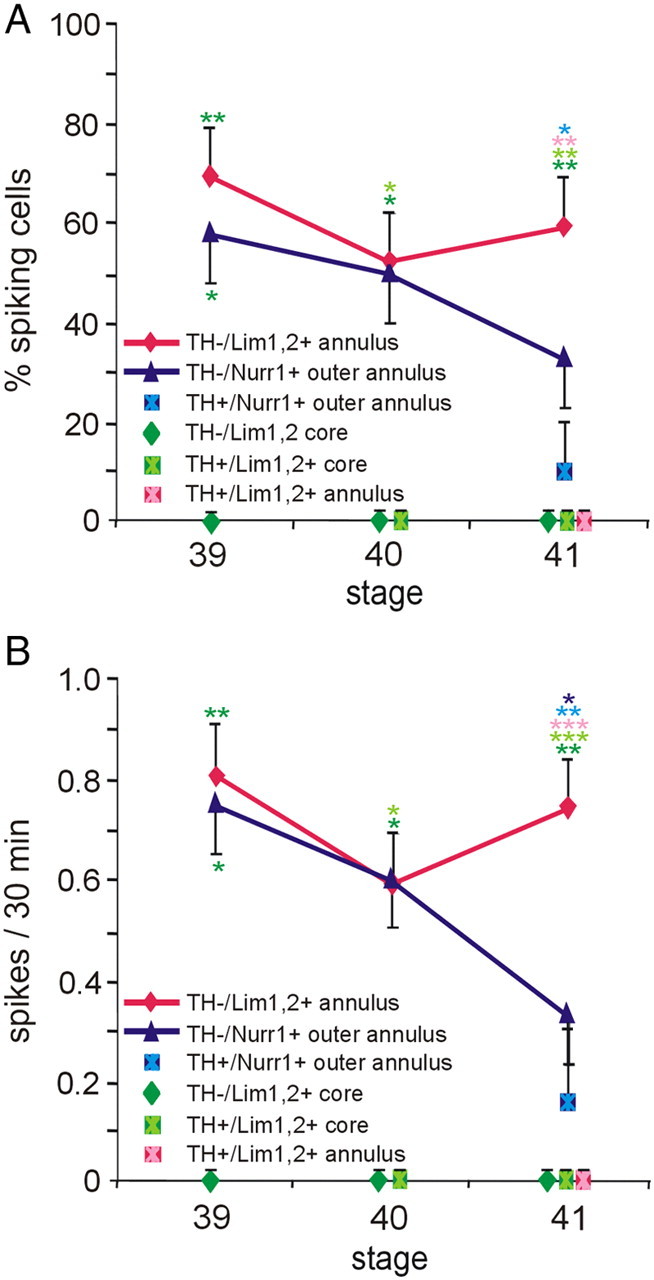
Spontaneous calcium spike activity in the VSC during TH acquisition. A, The incidence of spiking is different in VSC neurons expressing distinct molecular markers or located in different regions. Spikes were not detected in Lim1,2+ core and TH+/Lim1,2+ core neurons at stages 39–41, whereas spikes were initially observed in TH−/Lim1,2+ and TH−/Nurr1+ annular and outer annular neurons. At stage 41, spikes were not observed in annular TH+/Lim1,2+ neurons although still recorded in some TH+/Nurr1+ outer annular neurons. B, The frequency of spiking is also different. TH−/Lim1,2+ and TH−/Nurr1+ annular and outer annular neurons initially have a similar frequency of spiking that diverges during development. By stage 41, annular TH+/Nurr1+ cells spike at a relatively low frequency, annular TH−/ Lim1,2+ cells spike at a relatively high frequency, and spikes were not observed in TH+/Lim1,2+ annular cells. n ≥ 4 brain sections per stage with n ≥ 4 neurons per class across brain sections; values are mean ± SEM. Significant differences between cell types are indicated: *p < 0.05, **p < 0.01, ***p < 0.001, color coded according to the figure labels comparing across DA subtypes and across stages. The Kruskal–Wallis test followed by Conover's post hoc analysis was used to determine statistical significance.
Results
Sequential development of dopaminergic neurons in the brain and spinal cord
Whole-mount preparations of brain and spinal cord stained with an antibody to TH, the rate-limiting enzyme for dopamine biosynthesis, established the time course of appearance of different DA nuclei as well as changes in relative position and shape of each nucleus throughout development (Fig. 1A,B). Our data confirm the caudal-to-rostral progression of differentiation of the DA phenotype and illustrate a distinct temporal and spatial pattern for each nucleus (González et al., 1994).
To obtain a more refined quantification of the temporal and spatial development of the DA system as a baseline for comparing changes after activity manipulations, we quantified the number of TH-immunoreactive (TH+) neuronal profiles in transverse sections through the brain (Fig. 1C,D). At stage 35, TH is detected in a few cells in the PT, which is the most caudal of the DA brain nuclei, and in the DLSC. At stage 40, TH is also expressed in the VSC, and there is an incipient OB, the most rostral of the DA nuclei, composed of only a few TH+ cells. By stage 42 a cluster of TH+ cells is detected in the OB. All DA nuclei expand as more cells start expressing TH during further development.
TH+ neurons appear in the spinal cord at stage 28 (Heathcote and Chen, 1994). By stage 35, these cells are located on the ventral side of the spinal cord in two longitudinal rows. Developing spinal cord DA neurons undergo changes in size and position from the midline through stage 45 (Fig. 2B,C), a process that continues at later stages (Heathcote and Chen, 1994). Neuronal processes start developing rostrally at stage 40 (Fig. 2B, arrows), and by stage 42 axons extend anterolaterally along the longitudinal ventral axis. Confocal z-stack reconstructions of dissected spinal cord whole mounts quantify the increase in number, decrease in size, and migration toward the midline during a 3 d period of development (Fig. 2D–F).
Specification of the dopaminergic phenotype is modulated by calcium spike activity to different extents in different regions
To test the activity dependence of the DA phenotype, we overexpressed mRNA encoding hKir2.1 (Kir), an inward rectifier potassium channel, or rNav2a αβ (Nav), a voltage-gated sodium channel; expression of these channels has been shown to decrease or increase calcium spike activity in the spinal cord and the brain (Borodinsky et al., 2004; Dulcis and Spitzer, 2008) (Fig. 3A). The results of activity manipulations were quantified at stage 42, when all DA nuclei are present in control animals.
Nav mRNA-injected embryos exhibited an increase in the number of TH+ neurons in the brain, whereas Kir mRNA-injected embryos demonstrated a decrease compared with controls (supplemental Fig. 1A, available at www.jneurosci.org as supplemental material). However, the level of the response varied among nuclei (Fig. 3B–E). Hyperactivity caused an increase in the number of TH+ neurons in the OB, DLSC, and VSC. The same nuclei responded to hypoactivity with a decrease in number of TH+ neurons. In contrast, whereas the number of TH+ profiles in the PT decreased with hypoactivity, hyperactivity yielded numbers that were not significantly different from control (Fig. 3E). Overexpression of Nav resulted in similar changes in calcium spike frequency in the VSC and PT (supplemental Fig. 1B, available at www.jneurosci.org as supplemental material), suggesting that the PT is either less able to increase the number of TH cells in response to increased activity or that it requires a specific pattern of activity that is lost when activity is imposed by ion channel overexpression. Assessment of activity manipulations at earlier stages (37 and 40) did not reveal significant changes in the number of DA PT neurons, suggesting that the limited responsiveness of the PT observed at stage 42 is not attributable to developmental compensation (supplemental Fig. 1C,D, available at www.jneurosci.org as supplemental material). Each brain nucleus responded to a different degree to the activity imposed by channel overexpression. In the spinal cord, we also found an increase in the number of TH+ neurons after increased spike activity and a reduction in TH+ neurons after a decrease in spike activity compared with controls (Fig. 3F,G). Because the diencephalic VSC was the most responsive nucleus to activity manipulations in the brain and the spinal cord displayed the earliest onset of dopamine expression, we focused our study on the VSC and spinal cord to investigate further the context dependence of activity-dependent neurotransmitter specification.
Coexpression of neurotransmitters and transcription factors identifies subclasses of dopaminergic neurons in the VSC and spinal cord
To test the hypothesis that activity-dependent expression of TH/dopamine depends on the presence of additional molecular markers, such as neurotransmitters or transcription factors, we investigated the molecular heterogeneity of developing VSC and spinal cord neurons by immunocolocalizing TH with other molecular markers. Dopamine is coexpressed with GABA or NPY in the adult Xenopus suprachiasmatic nucleus (de Rijk et al., 1992; Ubink et al., 1998). A subpopulation of DA neurons of the VTA in mice and rat coexpress VGlut2 (Kawano et al., 2006; Mendez et al., 2008, Hnasko et al., 2010). Dopamine is coexpressed in a subset of CSF-contacting GABA neurons of the adult lamprey spinal cord (Rodicio et al., 2008), and dopamine and GABA colocalize to different degrees in various DA nuclei in its brain (Barreiro-Iglesias et al., 2009).
We studied colocalization of TH with additional neurotransmitters in the VSC at stages 40, 42, and 45, which span the onset of expression of TH in the core at stage 40, expression in the surrounding annulus by stage 42, and continued growth to stage 45. We found no colocalization of TH with VGlut2 at stages 40, 42, and 45 (data not shown) At stage 40, the DA VSC consists of a TH+ core region that is primarily GABA negative (GABA−) (Fig. 4A, graph). At this stage, neurons in the annular region are TH− but express NPY/GABA (data not shown). By stage 42, a larger set of DA neurons has been recruited from the NPY/GABA cells in the annulus, whereas the core retains a substantial TH+/GABA− composition (Fig. 4A). By stage 45, an additional TH+ subpopulation appears in an outer annulus that coexpresses NPY but is GABA−. This population persists in the adult suprachiasmatic nucleus (Ubink et al., 1998). In the spinal cord, TH+ neurons are NPY− (supplemental Fig. 2, available at www.jneurosci.org as supplemental material) and primarily GABA+ from stage 29 to 45 (Fig. 5A,C).
Selective expression of transcription factors has been described for large regions of the brain, but the level of heterogeneity of transcription factor expression within individual DA nuclei in Xenopus during development has not received attention. We tested TH coexpression with Pax6, Nurr1, and Lim1,2, which have been implicated in DA differentiation in the developing diencephalon (Pax6, Lim1,2: Vitalis et al., 2000; Mastick and Andrews, 2001) and mesencephalon (Nurr1: Zetterström et al., 1996, 1997; Ang, 2006) of mice. In addition, Nurr1 controls differentiation of DA neurons of the PT in zebrafish (Blin et al., 2008). Both Pax6 and Lim1,2 are expressed in the diencephalon throughout Xenopus development (Moreno et al., 2004, 2008).
To determine whether specific transcription factor expression is correlated with the different DA subclasses identified by their neurotransmitter expression pattern, we costained neurons in the VSC for TH along with GABA and Lim1,2, Nurr1, or Pax6. At stage 42, Nurr1+/TH+ cells expressing GABA are present in the outer annulus and the core is Nurr1− and Pax6− (Fig. 4B) (supplemental Fig. 3, available at www.jneurosci.org as supplemental material). Lim1,2 is expressed in neurons in the core and the annulus at this stage (Dulcis and Spitzer, 2008) (supplemental Fig. 3, available at www.jneurosci.org as supplemental material). The core contains two subclasses of neurons that express either TH and Lim1,2 or TH, Lim1,2, and GABA. Annular neurons expressing TH, GABA, and NPY are Lim1,2+ but Nurr1− (Figs. 4C, 6A), whereas neurons in the outer annulus expressing TH, GABA, and NPY are Nurr1+ but Lim1,2− (Figs. 4B, 6A). Thus, DA neuron subclasses defined by neurotransmitter coexpression do not correspond to expression domains of Lim1,2 or Nurr1. Each of these subpopulations—core, annulus, and outer annulus—expresses specific combinations of neurotransmitters and transcription factors before they start expressing TH (Fig. 6A).
Figure 6.

Subclasses of VSC and spinal cord dopaminergic neurons. The VSC is composed of four subclasses of dopaminergic neurons that can be identified by their coexpression of Lim1,2 or Nurr1 transcription factors and NPY and GABA neurotransmitters at stage 42. Spinal cord dopaminergic neurons constitute a single class at this stage. Panels on the right show expanded views of regions at the left.
No transcription factors have yet been associated with specification of dopamine in the spinal cord. We tested the transcription factors linked to dopamine specification in the brain but found no coexpression of TH with Lim 1,2, Nurr1, or Pax6. We also examined expression of Lim3 and Islet 1,2 that have been associated with neuronal differentiation of the ventral spinal cord (Appel et al., 1995), but neither of these markers were detected in TH+ spinal neurons (Figs. 5B, 6B).
With this developmental picture of TH+ neurons in the VSC and spinal cord based on their temporal and spatial pattern of expression of neurotransmitters and transcription factors, we determined whether different DA nuclei and neuronal subclasses exhibit different frequencies of spontaneous calcium spike activity before the onset of TH expression and once TH is expressed.
Subclasses of dopaminergic neurons display distinct patterns of spontaneous calcium spike activity
The heterogeneity of subclasses observed within the VSC led us to hypothesize that individual subpopulations of DA neurons possess different endogenous calcium-mediated electrical activity. We imaged subclasses of DA cells within the VSC that express different combinations of molecular markers and the more homogeneous spinal cord DA neurons that are distantly located along the rostrocaudal axis of the CNS for comparison.
We focused our analysis of spontaneous calcium spike activity on a window of development that begins at a stage just before detection of TH expression (stage 27 for the spinal cord and stage 39 for the brain). We were not able to identify VSC core neurons at earlier stages because there is no Lim1,2+ cluster of cells 10 μm dorsal to the optic chiasm. This window of development ends at the latest stage at which spiking is detected (stage 30 in the spinal cord and stage 42 in the brain). In the VSC, Lim1,2+ (core plus annulus) and Nurr1+ (outer annulus) DA precursors can be identified at stage 39 before the appearance of TH. At stage 40, some Lim1,2+ core neurons express TH, whereas both Lim1,2+ annulus and Nurr1+ outer annulus neurons are still TH−. By stage 41, TH starts to be expressed in the annular regions as well. Thus, we characterized calcium spike activity in neurons of the Lim1,2+ core, Lim1,2+ annulus, and the Nurr1+ outer annulus of the VSC before and after they acquired TH.
We found that the activity of core and annular neurons is distinct: core neurons did not exhibit spontaneous calcium activity, either before or after expressing TH (Lim1,2+ or TH+/Lim1,2+), although they can generate spikes in response to overexpression of Nav (Dulcis and Spitzer, 2008). Conversely, annular neurons exhibited robust activity, the incidence and frequency of which changed during development. At stage 39, TH− cells expressing either Lim1,2 or Nurr1 have a similar incidence and frequency of spiking. However, their activity patterns diverge by stage 41, with a lower spiking frequency for TH−/Nurr1+ cells compared with TH−/Lim1,2+ cells. As annular cells now acquire the TH phenotype, their activity patterns are correlated with the transcription factor they express. TH+/Lim1,2+ neurons no longer exhibit spiking, whereas TH+/Nurr1+ cells are active at a level similar to that of TH−/Nurr1+ cells at stage 41 (Fig. 7A,B).
In the spinal cord, we examined endogenous calcium activity of DA neurons at stages 27, 28, and 29/30, which encompass the period during which GABAergic ventral midline neurons acquire the additional DA phenotype. Calcium spike frequency increases in the GABA+/TH+ population at stage 28 (Fig. 8A). The spike incidence of the GABA+/TH+ cells remains constant during this period. The proportion of TH− and TH+ cells within the GABA+ population on the ventral surface of the spinal cord reverses as the GABA+/TH− population decreases and the GABA+/TH+ population increases (Fig. 8B), coincident with increased spike frequency at stage 28.
These results are consistent with the hypothesis that subclasses of TH− precursors and TH+ cells identified by different molecular markers and by their spatial location display different patterns of calcium spike activity at the same time point during development. The results also indicate that single molecular markers of DA neuron precursors are not always correlated with specific patterns of activity. Cells that express Lim1,2 can be active or not, depending on whether they are located in the core region or annular region of the VSC. Moreover, cells that express different transcription factors (Nurr1 or Lim1,2) but are located in the annular regions initially display similar incidence and frequency of calcium spikes.
Dopaminergic subclasses display different responsiveness to activity manipulation
We next characterized the expansion of the DA phenotype in the VSC and spinal cord after an increase in activity by overexpression of Nav channels. The neurons in both regions are responsive to an increase in activity, but the induction of neurotransmitter specification is different in each region.
In the VSC, increased activity leads to expression of Pax6 in regions where it is not normally present in controls (Dulcis and Spitzer, 2008). Most of the newly TH+ reserve pool neurons induced by increased activity are recruited from this ectopic Pax6+/Lim1,2+ neuronal population. We focused on the core and annular region that have been studied previously after manipulations of activity (Dulcis and Spitzer, 2008). After Nav overexpression, we found that the increase in the number of TH+/Lim1,2+ neurons in the annular region is larger than the increase in the number of neurons that are TH+/Lim1,2+ in the core (Fig. 9A). Annular reserve pool neurons, which display endogenous calcium spike activity during normal developmental acquisition of the TH phenotype, are more responsive to activity manipulation than neurons in the core. Although the expansion of the TH phenotype occurs within the available Lim1,2+ cell pool, the total number of Lim1,2+ neurons in the core and annulus does not change after activity manipulation (Dulcis and Spitzer, 2008); thus, it is unlikely that neurogenesis contributes to these results.
Expansion of the TH phenotype in the spinal cord occurs within the GABA+ cells localized in ventral longitudinal rows and adjacent to the central canal. In controls, TH+/GABA+ cells are distributed along the spinal cord, and only single-cell profiles are seen in 10 μm transverse sections. The number of ventral GABA+ cells is not significantly altered by increased activity, but Nav overexpression causes more of these GABA+ cells to acquire the TH phenotype, increasing the occurrence of clusters of TH+/GABA+ cells in transverse sections (Fig. 9B). The limited induction of TH expression within these cells suggests that ventral spinal GABA+ cells possess a selective responsiveness to activity and that a subset of these GABA+ cells serves as reserve pool neurons for additional TH expression in the spinal cord.
Circuit activity recruits TH expression selectively in GABAergic annular neurons of the VSC
To understand the physiological relevance of the molecular and spatiotemporal calcium spike diversity identified within the DA system, including the different responsiveness of TH+ neuronal subclasses to activity manipulations, we tested the effect on transmitter specification of activity triggered by sensory circuit stimulation. In contrast to molecular overexpression of ion channels, a 2 h period of white light illumination on a white background affects the activity of neurons without affecting the endogenous diversity of developmental calcium spike activity at earlier stages. Annular NPY neurons of the VSC acquire the DA phenotype after calcium-dependent activation of the retinohypothalamic projection by light (Dulcis and Spitzer, 2008). We found that NPY+ neurons acquiring TH in light-adapted larvae are GABA+ (Fig. 10) as well as Lim1,2+ (Dulcis and Spitzer, 2008); NPY+ neurons lacking GABA were not recruited to express TH in response to sensory stimulation. Dark adaptation on a black background causes a reduction in number of TH+ and TH+/NPY+/GABA+ neurons in the annulus compared with control (Fig. 10C). GABA expression detected in NPY+ annular neurons before TH specification persists after circuit activation and DA induction, leading to coexpression of three inhibitory transmitters (GABA, NPY, and dopamine). These experiments suggest that VSC neurons expressing GABA serve as a reserve pool of neurons that can acquire an additional neurotransmitter: dopamine. Our results show that not all of the potentially available reserve pool neurons are recruited by activity for dopamine specification in a circuit-dependent manner. Among the NPY+ annular neurons, only those coexpressing GABA were selected.
Discussion
Calcium spike activity is required for transmitter specification in neurons of the spinal cord and VSC of Xenopus embryos and larvae (Borodinsky et al., 2004; Dulcis and Spitzer, 2008). Here we extend these results, showing that calcium spikes modulate dopamine specification in multiple regions of the CNS and in a heterogeneous population of DA cells that display additional neurotransmitters and particular transcription factors. Specification of another monoamine, serotonin, is also activity dependent in the raphe (Demarque and Spitzer, 2010). These studies demonstrate that calcium spike activity-dependent transmitter specification is a general process across the Xenopus nervous system and for a variety of neurotransmitters, consistent with developmental activity-dependent regulation of dopamine expression in rat primary sensory neurons (Brosenitsch et al., 1998; Brosenitsch and Katz, 2002) and acetylcholine in mouse hypothalamic neurons (Liu et al., 2008).
Classifying dopaminergic neurons in space and time
Dopamine expression appears in the Xenopus CNS in a distinct spatial and temporal pattern, following a caudal-to-rostral progression (González et al., 1994) as observed in zebrafish and lamprey (McLean and Fetcho, 2004; Abalo et al., 2005). Expression of a particular transcription factor or neurotransmitter provides a basis for classifying neurons. However, cell identity is a complex combinatorial signature that includes coexpression of multiple transmitters and transcription factors in subsets of neuronal populations (Hökfelt, 1991; Trudeau and Gutiérrez, 2007). Developing DA neurons in the VSC are heterogeneous, with subpopulations that display specific combinations of GABA, NPY, Lim1,2, and Nurr1. Each subpopulation can also be identified by its stereotypic anatomical location within each nucleus and the stage of development at which this subpopulation appears.
The subpopulations that appear during normal development are most likely postmitotic cells acquiring their final neurotransmitter phenotypes and not newly generated neurons. The first wave of neurogenesis in Xenopus occurs during gastrulation, with the final mitosis occurring between stages 13 and 16 (Lamborghini, 1980; Hartenstein, 1989). The second wave of neurogenesis begins at stage 46 in the spinal cord and stage 48 in the brain (Schlosser et al., 2002; Wullimann et al., 2005), after the stages covered in the present study (stages 29–45). The DA subpopulations within the VSC are molecularly distinct before expression of the DA phenotype and not simply members of the same neuronal population at different stages of differentiation.
Interestingly, VSC neurons can be clustered into two groups expressing different transcription factors: Lim1,2 and Nurr1. Nurr1 expression has been implicated in the survival and differentiation of mesencephalic DA neurons in mice (Zetterström et al., 1997) and zebrafish (Blin et al., 2008). Here we report expression of Nurr1 in DA neurons in the diencephalon as well. Future work will identify additional transcription factors expressed in these neurons.
In the spinal cord, dopamine is expressed in a subset of the GABAergic CSF-contacting Kolmer–Agduhr (KA) neurons (Dale et al., 1987a,b; Binor and Heathcote, 2001). Dopaminergic and GABAergic KA cells were thought to be different populations. Here we show that some of these GABAergic cells coexpress TH. Developmentally, GABA expression precedes TH expression. GABA is first detected in the ventral spinal cord at stage 25 (Dale et al., 1987b), whereas TH expression starts at stage 28 (Heathcote and Chen, 1994).
It is becoming clear that the differentiation of neuronal populations thought to be homogeneous for neurotransmitter expression occurs in a complex spatiotemporal pattern. The DA system exemplifies a highly heterogeneous population of neurons, all of which share the expression of the transmitter dopamine yet diverge in their expression of additional markers. Brain nuclei described previously as cell clusters sharing the same function actually include subclasses of neurons with distinct endogenous calcium spike activity and responsiveness to activity that may enable accomplishment of the myriad tasks that a single brain nucleus controls.
Relationship of transmitters and transcription factors to endogenous patterns of excitability
Given the diversity of molecular markers within the DA system, we tested the hypothesis that developing DA neurons with different molecular markers display different patterns of calcium spike activity. VSC neurons exhibit different patterns of calcium spike incidence and frequency that are correlated with location within the nucleus and the transcription factor(s) they express. Neurons in the core expressing either Lim1,2, or TH/Lim1,2 do not exhibit calcium spike activity between stages 39 and 41. In contrast, Lim1,2+ and Nurr1+ annular and outer annular cells exhibit spiking that diverges during development. Acquisition of TH in GABA+ cells is associated with a decrease in frequency of calcium spiking. Examination of spinal cord neurons identified as GABA+/TH− or GABA+/TH+ revealed that each population has different frequencies of spiking that change during development and cell differentiation. A peak in spiking frequency is observed at the time that spinal cord GABA+ cells are acquiring TH. Thus, DA neurons and precursors identified by specific molecular markers and located in different regions of the CNS display particular patterns of spiking during the stages in which TH is acquired.
Dopamine and GABA: coexpression partners?
Dopamine and GABA appear to be preferred coexpression partners. Tottering (Hess and Wilson, 1991; Fletcher et al., 1996) and leaner (Austin et al., 1992; Abbott et al., 1996) mice with calcium channel mutations and neurological abnormalities, including seizures and ataxia, exhibit ectopic TH expression in a subset of normally GABAergic cerebellar Purkinje cells. TH is transiently expressed in Purkinje cells during normal development; in contrast, coexpression in these mutant mice persists throughout adulthood, suggesting that GABA+ Purkinje cell clusters responding to altered activity have a predisposition to acquire the DA phenotype by sustaining TH coexpression. Under normal conditions, only a few intrinsic putatively GABAergic neurons in the rodent striatum coexpress dopamine (Tashiro et al., 1989; Mao et al., 2001). When the substantia nigra is damaged in mice, striatal GABA+/TH+ neurons increase in number (Lopez-Real et al., 2003). Similarly, the normal monkey and human striatum, which contain more DA neurons than that of rodents (Dubach et al., 1987; Palfi et al., 2002), respond to massive striatal DA denervation by recruiting GABAergic striatal neurons to express TH (Tandé et al., 2006; Huot and Parent, 2007). These GABAergic neurons that can be induced to express TH appear to correspond to the reserve pool neurons described for the VSC and spinal cord.
Dopamine is coexpressed with GABA in the olfactory bulb of mice (Hack et al., 2005), in specific subpopulations of the DA system in adult lamprey (Rodicio et al., 2008; Barreiro-Iglesias et al., 2009), and in the adult suprachiasmatic nucleus as well as the developing VSC and spinal cord in Xenopus (Ubink et al., 1998; this study). In white-adapted Xenopus laevis larvae, NPY+ annular reserve pool neurons of the VSC that are recruited to coexpress dopamine (Dulcis and Spitzer, 2008) belong to a GABAergic neuronal population surrounding the core neurons.
The DA phenotype often appears to be recruited by altered circuit activity in GABAergic neurons of brain regions that have been shown to be capable of spontaneously expressing dopamine either transiently during development or persistently throughout adulthood. These observations suggest the existence of activity-dependent regulatory components controlling dopamine expression in reserve pool GABAergic neurons. Two regulatory elements in the TH promoter, the TH–fat-specific element that binds the Fos–Jun complex and the cAMP response element that binds cAMP response element-binding protein (CREB), have been implicated in regulating TH gene transcription (Ghee et al., 1998). Because expression of both CREB (Hardingham et al., 1997) and Fos–Jun (Xia et al., 1996) transcription factors is activity dependent, they may be links through which activity triggers dopamine specification in GABAergic neurons. Linkage to GABAergic neurons could also be provided by GABA spillover (Scanziani, 2000) that can activate GABAB receptors on GABAergic neurons (Liang et al., 2000); direct interaction of GABAB receptors with CREB2 and ATFx transcription factors (White et al., 2000) would provide a potential route for dopamine specification.
Conclusions
We have shown that dopamine specification is activity dependent to different extents across the DA nervous system. Specific cotransmitters and transcription factors identify subgroups of DA neurons that display distinct patterns of calcium spike activity during development. GABA and spontaneous activity appear to be common factors in DA neurons responsive to calcium spike activity. A model emerges in which electrical activity regulates transmitter specification by mediating expression or activation of transcription factors. Lmx1b and Tlx3 are regulated by calcium spike activity, and changes in their expression and activation lead to changes in transmitter expression (Demarque and Spitzer, 2010; Marek et al., 2010). The results support the hypothesis that the molecular context provided by specific combinations of cotransmitters and transcription factors regulates calcium spike activity and dopamine specification. Calcium spikes may also act as an upstream signal to recruit specific transcription factors that activate terminal selector genes to achieve spatiotemporal specification of dopamine expression in reserve pool neurons (Flames and Hobert, 2009). Understanding how transcription factors and electrical activity participate together in differentiation of neuronal precursors into mature DA neurons could help improve clinical treatments such as stem cell transplantation. Specific patterns of calcium activity may be important in regulating the expression of combinations of transcription factors and transmitters that subclasses of DA neurons display in vivo.
Footnotes
This research was supported by National Institutes of Health Grant R01NS15918 (N.C.S.) and a Consejo Nacional de Ciencia y Technología/University of California Institute for Mexico and the United States fellowship (N.A.V.-U.). We thank members of our laboratory for helpful discussions and technical assistance, Darwin Berg and Yimin Zou for comments on this manuscript, and A. de la Torre and I. Hsieh for technical support.
References
- Abalo XM, Villar-Cheda B, Anadón R, Rodicio MC. Development of the dopamine-immunoreactive system in the central nervous system of the sea lamprey. Brain Res Bull. 2005;66:560–564. doi: 10.1016/j.brainresbull.2005.05.004. [DOI] [PubMed] [Google Scholar]
- Abbott LC, Isaacs KR, Heckroth JA. Co-localization of tyrosine hydroxylase and zebrin II immunoreactivities in Purkinje cells of the mutant mice, tottering and tottering/leaner. Neuroscience. 1996;71:461–475. doi: 10.1016/0306-4522(95)00444-0. [DOI] [PubMed] [Google Scholar]
- Ang SL. Transcriptional control of midbrain dopaminergic neuron development. Development. 2006;133:3499–3506. doi: 10.1242/dev.02501. [DOI] [PubMed] [Google Scholar]
- Appel B, Korzh V, Glasgow E, Thor S, Edlund T, Dawid IB, Eisen JS. Motoneuron fate specification revealed by patterened LIM homeobox gene expression in embryonic zebrafish. Development. 1995;121:4117–4125. doi: 10.1242/dev.121.12.4117. [DOI] [PubMed] [Google Scholar]
- Austin MC, Schultzberg M, Abbott LC, Montpied P, Evers JR, Paul SM, Crawley JN. Expression of tyrosine hydroxylase in cerebellar Purkinje neurons of the mutant tottering and leaner mouse. Mol Brain Res. 1992;15:227–240. doi: 10.1016/0169-328x(92)90113-p. [DOI] [PubMed] [Google Scholar]
- Barreiro-Iglesias A, Villar-Cerviño V, Anadón R, Rodicio MC. Dopamine and γ-aminobutyric acid are colocalized in restricted groups of neurons in the sea lamprey brain: insights into early evolution of neurotransmitter colocalization in vertebrates. J Anat. 2009;215:601–610. doi: 10.1111/j.1469-7580.2009.01159.x. [DOI] [PMC free article] [PubMed] [Google Scholar]
- Binor E, Heathcote RD. Development of GABA-immunoreactive neuron patterning in the spinal cord. J Comp Neurol. 2001;438:1–11. doi: 10.1002/cne.1298. [DOI] [PubMed] [Google Scholar]
- Blaustein AR, Waldman B. Kin recognition in anuran amphibians. Anim Behav. 1992;44:207–221. [Google Scholar]
- Blin M, Norton W, Bally-Cuif L, Vernier P. NR4A2 controls the differentiation of selective dopaminergic nuclei in the zebrafish brain. Mol Cell Neurosci. 2008;39:592–604. doi: 10.1016/j.mcn.2008.08.006. [DOI] [PubMed] [Google Scholar]
- Borodinsky LN, Root CM, Cronin JA, Sann SB, Gu X, Spitzer NC. Activity-dependent homeostatic specification of transmitter expression in embryonic neurons. Nature. 2004;429:523–530. doi: 10.1038/nature02518. [DOI] [PubMed] [Google Scholar]
- Brosenitsch TA, Katz DM. Expression of Phox2 transcription factors and induction of the dopaminergic phenotype in primary sensory neurons. Mol Cell Neurosci. 2002;20:447–457. doi: 10.1006/mcne.2002.1135. [DOI] [PubMed] [Google Scholar]
- Brosenitsch TA, Salgado-Commissariat D, Kunze DL, Katz DM. A role for L-type calcium channels in developmental regulation of transmitter phenotype in primary sensory neurons. J Neurosci. 1998;18:1047–1055. doi: 10.1523/JNEUROSCI.18-03-01047.1998. [DOI] [PMC free article] [PubMed] [Google Scholar]
- Dal Bo G, Bérubé-Carrière N, Mendez JA, Leo D, Riad M, Descarries L, Lévesque D, Trudeau LE. Enhanced glutamatergic phenotype of mesencephalic dopamine neurons after neonatal 6-hydroxydopamine lesion. Neuroscience. 2008;156:59–70. doi: 10.1016/j.neuroscience.2008.07.032. [DOI] [PubMed] [Google Scholar]
- Dale N, Roberts A, Ottersen OP, Storm-Mathisen J. The morphology and distribution of “Kolmer-Agduhr cells,” a class of cerebrospinal-fluid-contacting neurons revealed in the frog embryo spinal cord by GABA immunocytochemistry. Proc R Soc Lond B Biol Sci. 1987a;232:193–203. doi: 10.1098/rspb.1987.0068. [DOI] [PubMed] [Google Scholar]
- Dale N, Roberts A, Ottersen OP, Storm-Mathisen J. The development of a population of spinal cord neurons and their axonal projections revealed by GABA immunocytochemistry in frog embryos. Proc R Soc Lond B Biol Sci. 1987b;232:205–215. doi: 10.1098/rspb.1987.0069. [DOI] [PubMed] [Google Scholar]
- Dallwig R, Deitmer JW. Cell-type specific calcium responses in acute rat hippocampal slices. J Neurosci Methods. 2002;116:77–87. doi: 10.1016/s0165-0270(02)00030-4. [DOI] [PubMed] [Google Scholar]
- de Rijk EP, van Strien FJ, Roubos EW. Demonstration of coexisting catecholamine (dopamine), amino acid (GABA), and peptide (NPY) involved in inhibition of melanotrope cell activity in Xenopus laevis: a quantitative ultrastructural, freeze-substitution immunocytochemical study. J Neurosci. 1992;12:864–871. doi: 10.1523/JNEUROSCI.12-03-00864.1992. [DOI] [PMC free article] [PubMed] [Google Scholar]
- Demarque M, Spitzer NC. Activity-dependent expression of Lmx1b regulates specification of serotonergic neurons modulating swimming behavior. Neuron. 2010;67:321–334. doi: 10.1016/j.neuron.2010.06.006. [DOI] [PMC free article] [PubMed] [Google Scholar]
- Dubach M, Schmidt R, Kunkel D, Bowden DM, Martin R, German DC. Primate neostratial neurons containing tyrosine hydroxylase: immunohistochemical evidence. Neurosci Lett. 1987;75:205–210. doi: 10.1016/0304-3940(87)90298-9. [DOI] [PubMed] [Google Scholar]
- Dulcis D, Spitzer NC. Illumination controls differentiation of dopamine neurons regulating behavior. Nature. 2008;456:195–201. doi: 10.1038/nature07569. [DOI] [PMC free article] [PubMed] [Google Scholar]
- Endepols H, Schul J, Gerhardt HC, Walkowiak W. 6-hydroxydopamine lesions in anuran amphibians: a new model system for Parkinson's disease? J Neurobiol. 2004;60:395–410. doi: 10.1002/neu.20047. [DOI] [PubMed] [Google Scholar]
- Flames N, Hobert O. Gene regulatory logic of dopamine neuron differentiation. Nature. 2009;458:885–889. doi: 10.1038/nature07929. [DOI] [PMC free article] [PubMed] [Google Scholar]
- Fletcher CF, Lutz CM, O'Sullivan TN, Shaughnessy JD, Jr, Hawkes R, Frankel WN, Copeland NG, Jenkins NA. Absence epilepsy in tottering mutant mice is associated with calcium channel defects. Cell. 1996;87:607–617. doi: 10.1016/s0092-8674(00)81381-1. [DOI] [PubMed] [Google Scholar]
- Ghee M, Baker H, Miller JC, Ziff EB. AP-1, CREB and CBP transcription factors differentially regulate the tyrosine hydroxylase gene. Mol Brain Res. 1998;55:101–114. doi: 10.1016/s0169-328x(97)00370-7. [DOI] [PubMed] [Google Scholar]
- González A, Tuinhof R, Smeets WJ. Distribution of tyrosine hydroxylase and dopamine immunoreactivities in the brain of the South African clawed frog Xenopus laevis. Anat Embryol. 1993;187:193–201. doi: 10.1007/BF00171750. [DOI] [PubMed] [Google Scholar]
- González A, Marín O, Tuinhof R, Smeets WJ. Ontogeny of catecholamine systems in the central nervous system of anuran amphibians: an immunohistochemical study with antibodies against tyrosine hydroxylase and dopamine. J Comp Neurol. 1994;346:63–79. doi: 10.1002/cne.903460105. [DOI] [PubMed] [Google Scholar]
- Hack MA, Saghatelyan A, de Chevigny A, Pfeifer A, Ashery-Padan R, Lledo PM, Götz M. Neuronal fate determinants of adult olfactory bulb neurogenesis. Nat Neurosci. 2005;8:865–872. doi: 10.1038/nn1479. [DOI] [PubMed] [Google Scholar]
- Hardingham GE, Chawla S, Johnson CM, Bading H. Distinct functions of nuclear and cytoplasmic calcium in the control of gene expression. Nature. 1997;385:260–265. doi: 10.1038/385260a0. [DOI] [PubMed] [Google Scholar]
- Hartenstein V. Early neurogenesis in Xenopus: the spatio-temporal pattern of proliferation and cell lineages in the embryonic spinal cord. Neuron. 1989;3:399–411. doi: 10.1016/0896-6273(89)90200-6. [DOI] [PubMed] [Google Scholar]
- Heathcote RD, Chen A. Morphogenesis of catecholaminergic interneurons in the frog spinal cord. J Comp Neurol. 1994;342:57–68. doi: 10.1002/cne.903420107. [DOI] [PubMed] [Google Scholar]
- Hédou G, Chasserot-Golaz S, Kemmel V, Gobaille S, Roussel G, Artault JC, Andriamampandry C, Aunis D, Maitre M. Immunohistochemical studies of the localization of neurons containing the enzyme that synthesizes dopamine, GABA, or gamma-hydroxybutyrate in the rat substantia nigra and striatum. J Comp Neurol. 2000;426:549–560. doi: 10.1002/1096-9861(20001030)426:4<549::aid-cne4>3.0.co;2-y. [DOI] [PubMed] [Google Scholar]
- Hess EJ, Wilson MC. Tottering and leaner mutations perturb transient developmental expression of tyrosine hydroxylase in embryologically distinct Purkinje cells. Neuron. 1991;6:123–132. doi: 10.1016/0896-6273(91)90127-l. [DOI] [PubMed] [Google Scholar]
- Hnasko TS, Chuhma N, Zhang H, Goh GY, Sulzer D, Palmiter RD, Rayport S, Edwards RH. Vesicular glutamate transport promotes dopamine storage and glutamate corelease in vivo. Neuron. 2010;65:643–656. doi: 10.1016/j.neuron.2010.02.012. [DOI] [PMC free article] [PubMed] [Google Scholar]
- Hökfelt T. Neuropeptides in perspective: the last ten years. Neuron. 1991;7:867–879. doi: 10.1016/0896-6273(91)90333-u. [DOI] [PubMed] [Google Scholar]
- Huot P, Parent A. Dopaminergic neurons intrinsic to the striatum. J Neurochem. 2007;101:1441–1447. doi: 10.1111/j.1471-4159.2006.04430.x. [DOI] [PubMed] [Google Scholar]
- Jankovic J, Chen S, Le WD. The role of Nurr1 in the development of dopaminergic neurons and Parkinson's disease. Prog Neurobiol. 2005;77:128–138. doi: 10.1016/j.pneurobio.2005.09.001. [DOI] [PubMed] [Google Scholar]
- Kawano M, Kawasaki A, Sakata-Haga H, Fukui Y, Kawano H, Nogami H, Hisano S. Particular subpopulations of midbrain and hypothalamic dopamine neurons express vesicular glutamate transporter 2 in the rat brain. J Comp Neurol. 2006;498:581–592. doi: 10.1002/cne.21054. [DOI] [PubMed] [Google Scholar]
- Kohwi M, Osumi N, Rubenstein JL, Alvarez-Buylla A. Pax6 is required for making specific subpopulations of granule and periglomerular neurons in the olfactory bulb. J Neurosci. 2005;25:6997–7003. doi: 10.1523/JNEUROSCI.1435-05.2005. [DOI] [PMC free article] [PubMed] [Google Scholar]
- Lamborghini JE. Rohon-beard cells and other large neurons in Xenopus embryos originate during gastrulation. J Comp Neurol. 1980;189:323–333. doi: 10.1002/cne.901890208. [DOI] [PubMed] [Google Scholar]
- Liang F, Hatanaka Y, Saito H, Yamamori T, Hashikawa T. Differential expression of γ-aminobutyric acid type B receptor-1a and -1b mRNA variants in GABA and non-GABAergic neurons of the rat brain. J Comp Neurol. 2000;416:475–495. [PubMed] [Google Scholar]
- Liu X, Popescu IR, Denisova JV, Neve RL, Corriveau RA, Belousov AB. Regulation of cholinergic phenotype in developing neurons. J Neurophysiol. 2008;99:2443–2455. doi: 10.1152/jn.00762.2007. [DOI] [PMC free article] [PubMed] [Google Scholar]
- Lopez-Real A, Rodriguez-Pallares J, Guerra MJ, Labandeira-Garcia JL. Localization and functional significance of striatal neurons immunoreactive to aromatic L-amino acid decarboxylase or tyrosine hydroxylase in rat Parkinsonian models. Brain Res. 2003;969:135–146. doi: 10.1016/s0006-8993(03)02291-1. [DOI] [PubMed] [Google Scholar]
- Mao L, Lau YS, Petroske E, Wang JQ. Profound astrogenesis in the striatum of adult mice following nigrostriatal dopaminergic lesion by repeated MPTP administration. Brain Res Dev Brain Res. 2001;131:57–65. doi: 10.1016/s0165-3806(01)00260-7. [DOI] [PubMed] [Google Scholar]
- Marek KW, Kurtz LM, Spitzer NC. cJun integrates calcium activity and tlx3 expression to regulate neurotransmitter specification. Nat Neurosci. 2010;13:944–950. doi: 10.1038/nn.2582. [DOI] [PMC free article] [PubMed] [Google Scholar]
- Márin O, Smeets WJ, González A. Basal ganglia organization in amphibians: development of striatal and nucleus accumbens connections with emphasis on the catecholaminergic inputs. J Comp Neurol. 1997;383:349–369. doi: 10.1002/(sici)1096-9861(19970707)383:3<349::aid-cne6>3.0.co;2-3. [DOI] [PubMed] [Google Scholar]
- Mastick GS, Andrews GL. Pax6 regulates the identity of embryonic diencephalic neurons. Mol Cell Neurosci. 2001;17:190–207. doi: 10.1006/mcne.2000.0924. [DOI] [PubMed] [Google Scholar]
- McLean DL, Fetcho JR. Ontogeny and innervation patterns of dopaminergic, noradrenergic and serotonergic neurons in larval zebrafish. J Comp Neurol. 2004;480:38–56. doi: 10.1002/cne.20280. [DOI] [PubMed] [Google Scholar]
- Mendez JA, Bourque MJ, Dal Bo G, Bourdeau ML, Danik M, Williams S, Lacaille JC, Trudeau LE. Developmental and target-dependent regulation of vesicular glutamate transporter expression by dopamine neurons. J Neurosci. 2008;28:6309–6318. doi: 10.1523/JNEUROSCI.1331-08.2008. [DOI] [PMC free article] [PubMed] [Google Scholar]
- Moreno N, Bachy I, Rétaux S, González A. LIM-homeodomain genes as developmental and adult genetic markers of Xenopus forebrain functional subdivisions. J Comp Neurol. 2004;472:52–72. doi: 10.1002/cne.20046. [DOI] [PubMed] [Google Scholar]
- Moreno N, Rétaux S, González A. Spatio-temporal expression of Pax6 in Xenopus forebrain. Brain Res. 2008;1239:92–99. doi: 10.1016/j.brainres.2008.08.052. [DOI] [PubMed] [Google Scholar]
- Nieuwkoop PD, Faber J. Normal table of Xenopus laevis (Daudin) Ed 2. Amsterdam: North Holland; 1967. [Google Scholar]
- Palfi S, Leventhal L, Chu Y, Ma SY, Emborg M, Bakay R, Déglon N, Hantraye P, Aebischer P, Kordower JH. Lentivirally delivered glial cell line-derived neurotrophic factor increases the number of striatal dopaminergic neurons in primate models of nigrostriatal degeneration. J Neurosci. 2002;22:4942–4954. doi: 10.1523/JNEUROSCI.22-12-04942.2002. [DOI] [PMC free article] [PubMed] [Google Scholar]
- Rodicio MC, Villar-Cerviño V, Barreiro-Iglesias A, Anadón R. Colocalization of dopamine and GABA in spinal cord neurones in the sea lamprey. Brain Res Bull. 2008;76:45–49. doi: 10.1016/j.brainresbull.2007.10.062. [DOI] [PubMed] [Google Scholar]
- Scanziani M. GABA spillover activates postsynaptic GABAB receptors to control rhythmic hippocampal activity. Neuron. 2000;25:673–681. doi: 10.1016/s0896-6273(00)81069-7. [DOI] [PubMed] [Google Scholar]
- Schlosser G, Koyano-Nakagawa N, Kintner C. Thyroid hormone promotes neurogenesis in the Xenopus spinal cord. Dev Dyn. 2002;225:485–498. doi: 10.1002/dvdy.10179. [DOI] [PubMed] [Google Scholar]
- Smeets WJ, González A. Catecholamine systems in the brain of vertebrates: new perspectives through a comparative approach. Brain Res Rev. 2000;33:308–379. doi: 10.1016/s0165-0173(00)00034-5. [DOI] [PubMed] [Google Scholar]
- Stricker D. BrightStat.com: free statistics online. Comput Methods Programs Biomed. 2008;92:135–143. doi: 10.1016/j.cmpb.2008.06.010. [DOI] [PubMed] [Google Scholar]
- Tandé D, Höglinger G, Debeir T, Freundlieb N, Hirsch EC, François C. New striatal dopamine neurons in MPTP-treated macaques result from a phenotypic shift and not neurogenesis. Brain. 2006;129:1194–1200. doi: 10.1093/brain/awl041. [DOI] [PubMed] [Google Scholar]
- Tashiro Y, Sugimoto T, Hattori T, Uemura Y, Nagatsu I, Kikuchi H, Mizuno N. Tyrosine hydroxylase-like immunoreactive neurons in the striatum of the rat. Neurosci Lett. 1989;97:6–10. doi: 10.1016/0304-3940(89)90130-4. [DOI] [PubMed] [Google Scholar]
- Trudeau LE, Gutiérrez R. On cotransmission and neurotransmitter phenotype plasticity. Mol Interv. 2007;7:138–146. doi: 10.1124/mi.7.3.5. [DOI] [PubMed] [Google Scholar]
- Tuinhof R, González A, Smeets WJ, Roubos EW. Neuropeptide Y in the developing and adult brain of the South African clawed toad Xenopus laevis. J Chem Neuroanat. 1994;7:271–283. doi: 10.1016/0891-0618(94)90018-3. [DOI] [PubMed] [Google Scholar]
- Ubink R, Tuinhof R, Roubos EW. Identification of suprachiasmatic-inhibiting neurons in Xenopus laevis: a confocal laser-scanning microscopy study. J Comp Neurol. 1998;397:60–68. [PubMed] [Google Scholar]
- Vígh B, Manzano e Silva MJ, Frank CL, Vincze C, Czirok SJ, Szabó A, Lukáts A, Szél A. The system of cerebrospinal fluid-contacting neurons. Its supposed role in the nonsynaptic signal transmission of the brain. Histol Histopathol. 2004;19:607–628. doi: 10.14670/HH-19.607. [DOI] [PubMed] [Google Scholar]
- Vitalis T, Cases O, Engelkamp D, Verney C, Price DJ. Defects of tyrosine hydroxylase-immunoreactive neurons in the brains of mice lacking the transcription factor Pax6. J Neurosci. 2000;20:6501–6516. doi: 10.1523/JNEUROSCI.20-17-06501.2000. [DOI] [PMC free article] [PubMed] [Google Scholar]
- White JH, McIllhinney RA, Wise A, Ciruela F, Chan WY, Emson PC, Billinton A, Marshall FH. The GABAB receptor interacts directly with the related transcription factors CREB2 and ATFx. Proc Natl Acad Sci U S A. 2000;97:13967–13972. doi: 10.1073/pnas.240452197. [DOI] [PMC free article] [PubMed] [Google Scholar]
- Wullimann MF, Rink E. Detailed immunohistology of Pax6 protein and tyrosine hydroxylase in the early zebrafish brain suggests role of Pax6 gene in development of dopaminergic diencephalic neurons. Dev Brain Res. 2001;131:173–191. doi: 10.1016/s0165-3806(01)00270-x. [DOI] [PubMed] [Google Scholar]
- Wullimann MF, Rink E, Vernier P, Schlosser G. Secondary neurogenesis in the brain of the African clawed frog, Xenopus laevis, as revealed by PCNA, Delta-1, Neurogenin-related-1, and NeuroD expression. J Comp Neurol. 2005;489:387–402. doi: 10.1002/cne.20634. [DOI] [PubMed] [Google Scholar]
- Xia Z, Dudek H, Miranti CK, Greenberg ME. Calcium influx via the NMDA receptor induces immediate early gene transcription by a MAP kinase/ERK-dependent mechanism. J Neurosci. 1996;16:5425–5436. doi: 10.1523/JNEUROSCI.16-17-05425.1996. [DOI] [PMC free article] [PubMed] [Google Scholar]
- Zetterström RH, Williams R, Perlmann T, Olson L. Cellular expression of the immediate early transcription factors Nurr1 and NGFI-B suggests a gene regulatory role in several brain regions including the nigrostriatal dopamine system. Mol Brain Res. 1996;41:111–120. doi: 10.1016/0169-328x(96)00074-5. [DOI] [PubMed] [Google Scholar]
- Zetterström RH, Solomin L, Jansson L, Hoffer BJ, Olson L, Perlmann T. Dopamine neuron agenesis in Nurr1-deficient mice. Science. 1997;276:248–250. doi: 10.1126/science.276.5310.248. [DOI] [PubMed] [Google Scholar]