Abstract
GABAergic neurons in the external capsule (EC) provide feedforward inhibition in the lateral amygdala (LA), but how EC affects synaptic transmission and plasticity in inputs from specific cortical areas remains unknown; this is because axonal fibers from different cortical areas are intermingled in the amygdala and cannot be activated selectively using conventional electrical stimulation. Here, we achieved selective activation of fibers from the temporal association cortex (TeA) or the anterior cingulate cortex (ACC) by using channelrhodopsin-2. Long-term potentiation (LTP) in the TeA–LA pathway, which runs through EC, was enabled by cutting connections between EC and LA or by blocking GABAA receptor-mediated transmission. In contrast, LTP in the ACC–LA pathway, which bypasses EC, was GABAA receptor independent. The EC transection shifted balance between inhibitory and excitatory responses in the TeA–LA pathway toward excitation, but had no effect on the ACC–LA pathway. Thus, EC provides pathway-specific suppression of amygdala plasticity.
Introduction
Sensory information from cortex enters lateral amygdala (LA) through the external capsule (EC), which contains axons from several cortical areas including temporal association cortex (TeA), which transmits auditory and polymodal sensory information into LA (McDonald, 1998), and plasticity in this pathway is implicated in fear learning (McKernan and Shinnick-Gallagher, 1997; Tsvetkov et al., 2002). Glutamatergic axons passing through the EC project to LA principal neurons (PNs), but also recruit local LA interneurons (INs) and the paracapsular intercalated cells inside the EC, which provide feedforward inhibition toward LA (Marowsky et al., 2005); yet, it remains unknown how the recruitment of inhibitory circuits through EC affects plasticity in cortico-amygdala synapses. To address this question, one needs to disconnect LA from EC without affecting the ability to selectively activate cortical axons, which enter LA via the EC. However, after such a disconnection conventional electrode stimulation of EC will no longer induce responses inside LA. Here we infected TeA or anterior cingulate cortex (ACC) with adeno-associated virus (AAV) expressing channelrhodopsin-2 (ChR2)-Venus fusion protein (ChR2-AAV) (Petreanu et al., 2009) and photostimulated axonal fibers containing ChR2 in LA slices. With this technique, we were able to activate TeA fibers in isolation from other cortical fibers that pass through EC, creating an advantage over the traditional electrical stimulation, which recruits all fibers in EC. In addition, we achieved selective activation of ACC–LA pathway, which does not form a distinct fiber bundle in LA and had not been studied in slice physiology experiments. This optogenetic activation of each pathway was effective even after LA was physically disconnected from EC by transection. Finally, we demonstrate that EC provides pathway-specific suppression of synaptic plasticity in TeA–LA pathway.
Materials and Methods
Viral injections.
ChR2-AAV pseudo-type 1 virus was prepared at the titer of 1012 viral particles per milliliter by University of North Carolina Gene Therapy Vector Core (Chapel Hill, NC) using Addgene plasmid 20071 (Petreanu et al., 2009). Three- to four-week-old 129SvEv/C57BL/6J F1 hybrid or GAD67-GFP (Tamamaki et al., 2003) male mice on 129SvEv/C57BL/6J mixed background were injected bilaterally with 0.5 μl of virus in TeA at 2.8 mm posterior, 4.6 mm lateral from bregma, and 1.8 mm ventral from brain surface, or in ACC at 1 mm anterior, 0.4 mm lateral from bregma, and 1.2 mm ventral from brain surface. Surgeries were performed according to National Institute of Mental Health Animal Care and Use Committee-approved protocol. Electrophysiology experiments were performed 3–4 weeks after surgery.
Electrophysiology.
Amygdala slices, 300 μm thick, were prepared as described previously (Tsvetkov et al., 2002) with several modifications. Slices were at a 35° tilt from horizontal. Such direction allowed equally effective light activation of axons from TeA and ACC, in contrast to coronal slices where activation of ACC pathway produced weaker responses. Slices were cut using DSK Microslicer (Ted Pella) in ice-cold partial sucrose artificial CSF (ACSF) solution containing the following (in mm): 80 NaCl, 3.5 KCl, 4.5 MgSO4, 0.5 CaCl2, 1.25 H2PO4, 25 NaHCO3, 10 glucose, and 90 sucrose equilibrated with 95% O2/5% CO2 (Daw et al., 2009) and stored in the same solution at room temperature for at least 45 min before recording. Slices were transferred to a recording chamber superfused at 1 ml/min with ACSF equilibrated with 95% O2/5% CO2 and containing the following (in mm): 119 NaCl, 2.5 KCl, 1 MgSO4, 2.5 CaCl2, 1.25 H2PO4, 26 NaHCO3, and 10 glucose, pH 7.4. Temperature was maintained at 29 ± 1°C. Whole-cell recordings were obtained with EPC-10 amplifier and Pulse v8.76 software (HEKA Elektronik). Principal cells in LA or the paracapsular interneurons in EC were visualized under differential interference contrast/infrared optics and recorded using 4–6 and 8–10 MΩ pipette, respectively. Putative LA interneurons in slices from GAD67-GFP mice (Tamamaki et al., 2003) were identified by green fluorescent protein fluorescence. Patch pipettes were filled with the following (in mm): 120 K-gluconate, 5 NaCl, 1 MgCl2, 10 HEPES, and 0.2 EGTA, 2 ATP-Mg, 0.1 GTP-Na, pH 7.3, osmolarity 285 Osm; 10 mm QX314 was included in the pipette solution for the inhibition/excitation (I/E) index experiments. Membrane potentials were not corrected by junction potential. Series resistance (R s) was in the range of 10–20 MΩ and was monitored throughout experiments. If R s changed >20% during recording, data were not included in analysis. The 470 nm light pulses (50–1000 μs duration) were generated using a light-emitting diode lamp and driver (Thorlabs) and delivered through a 40× objective lens (Carl Zeiss), providing 1.5–30.0 × 10⁻⁷ J measured under the objective lens. The threshold light energy was determined as the level of light energy that evoked EPSP responses that alternated with failures. EPSP/IPSP onset latency was determined visually as a time point in which membrane potential changed by 0.05 mV from baseline, and membrane time constants were calculated from membrane potential (V m) change during +60 pA current steps.
ChR2 expression analysis.
Three weeks after infection with ChR2-AAV, mice were intracardially perfused with 4% paraformaldehyde (PFA). Brains were then postfixed in PFA overnight and sliced into 150 or 300 μm sections. Low-magnification images of the injection area were obtained using DMRB fluorescence microscope (Leica) equipped with CoolSnap CCD camera (Photometrics). High-magnification images of ChR2 fibers in 150 μm LA sections were obtained using Zeiss LSM510 confocal microscope. For evaluation of brain area with virus infection, regions with yellow fluorescent protein (YFP) signal were outlined manually for each 150 μm section and projected on the nearest of the three representative coronal planes (for TeA injection, at −2.30, −2.92, and −3.64 from bregma; for ACC injection, at +1.54, +0.86, and +0.26 from bregma). To estimate the density of ChR2-YFP-expressing fibers in EC, the ChR2-YFP EC/LA fluorescence ratios were determined using confocal images of amygdala slices. Mean gray values for regions of interest (ROIs) encompassing either EC or LA, were obtained using ImageJ. Values for ROIs from areas lacking ChR2 fibers were used as background measure and were subtracted from the values for EC or LA.
Statistical analysis.
Data are presented as means ± SEM. Statistical comparisons were performed using the two-tailed unpaired t test, and differences were considered significant when the p value was <0.05.
Results
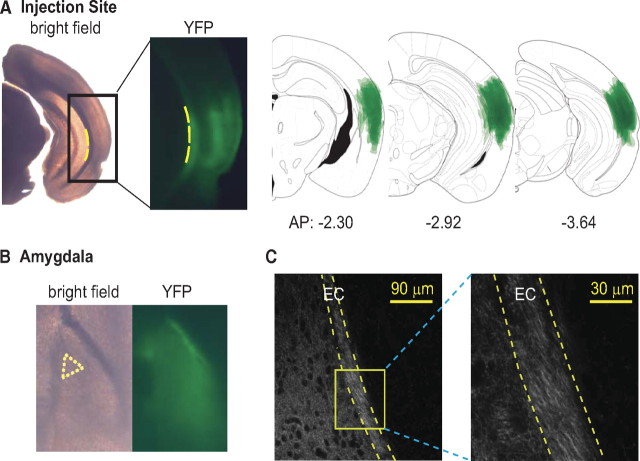
ChR2-AAV was injected into TeA and adjacent areas (Fig. 1 A), which transmit auditory and polymodal sensory information to the amygdala (McDonald, 1998). Abundant YFP-labeled axons inside EC (Fig. 1 B,C) indicated that EC is a major route of TeA axons to LA.
Figure 1.
ChR2-Venus-expressing axons from TeA pass through EC and innervate LA. A, A representative slice containing TeA infected with ChR2-AAV. Left, Bright-field image. Middle, Fluorescence image (YFP) of the corresponding rectangle area; yellow dotted line indicates medial boundary of the external capsule. Right, Overlay of YFP-expressing areas at injection sites from 6 animals. B, A postrecording fixed LA slice under bright field illumination (left) and fluorescence (right, YFP). Recording was made from neurons within the yellow dotted triangle area. C, Confocal images of YFP-expressing fibers around EC from a mouse injected with ChR2-AAV in TeA. Magnified image represents yellow rectangular area containing LA EC.
To determine whether these TeA axons can activate inhibitory neurons at EC, we obtained whole-cell recordings from putative paracapsular intercalated cells, which were identified as small-size clustered neurons that exhibit input resistance exceeding 200 MΩ and relatively broad spikes with small afterhyperpolarization (Marowsky et al., 2005) (Fig. 2 B, top). Blue light pulses evoked EPSPs in 9 of 10 tested cells (5 slices from 2 animals), leading to action potentials in 4 cells (Fig. 2 A,B, bottom). Thus, projections from TeA activate the putative paracapsular intercalated cells of EC.
Figure 2.
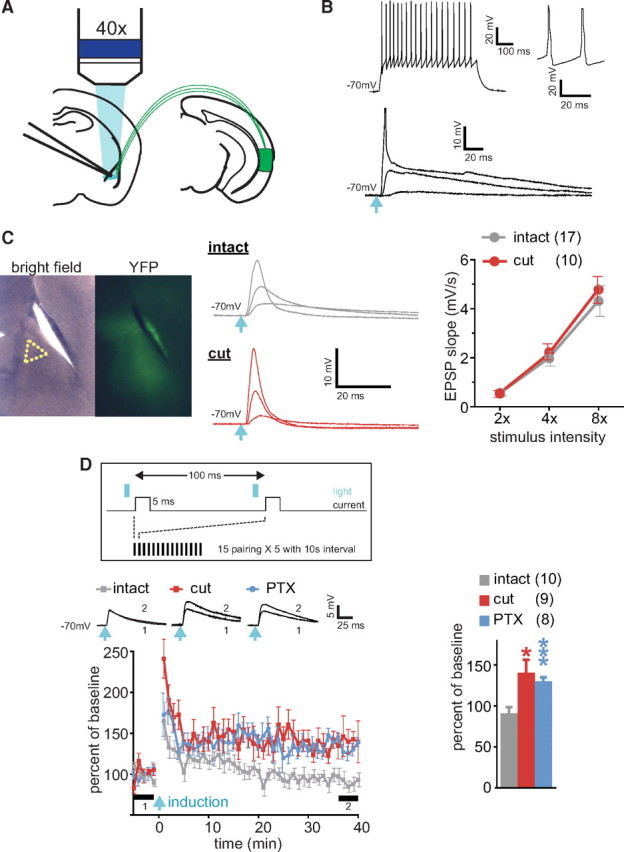
EC suppresses LTP in TeA–LA pathway. A, Experimental scheme for recording responses to optical stimulation of TeA axons in LA. B, Top, Response in a putative paracapsular interneuron to a 100 pA current step. Magnified time-scale spikes are shown on the right. Bottom, EPSPs evoked by blue light pulses (light blue arrow) with 2×, 4×, and 8× intensity of the threshold energy. Peak of action potential at 8× intensity is truncated. Light blue arrow indicates light pulse. C, Left, Bright-field/fluorescence (YFP) images of a slice with a cut separating EC from LA. Recording area is indicated by a yellow dot triangle. Middle, Examples of EPSPs evoked by blue light pulses with 2×, 4×, and 8× intensity of the threshold energy. Right, Input–output analysis of EPSPs. D, Top, LTP induction protocol. Left, LTP in TeA–LA pathway; insets represent averaged EPSPs before (1) and after (2) induction as indicated by thick bars (5 min each). Right, Summary for the LTP. *p < 0.05, ***p < 0.001. Error bars represent SEM. Number of cells is shown in parentheses.
By transecting LA along the medial border of EC, we next determined how severing the connections between EC and LA affects EPSPs evoked in putative LA PNs located in the ventromedial portion of LA (Fig. 2 C, left). PNs were identified by the presence of spike-frequency accommodation and large afterhyperpolarization (data not shown). The threshold energy of light pulse, required for responses in LA neurons, varied between cells and slices in the range of 150–1500 nJ, possibly due to variability in the level of viral infection; however, there was no significant difference in the mean threshold energy between intact and cut slices (intact: 694 ± 186 nJ, n = 32; cut: 571 ± 127 nJ, n = 31; p > 0.05). Given the broad range among cells, stimulus intensity was normalized to the threshold energy of light pulse for each neuron. The EPSPs evoked in cells at −70 mV did not differ in the input–output relationship for EPSP slope between intact and cut slices (Fig. 2 C, middle and right), indicating that the transection does not prevent optical activation of TeA fibers that project to PNs. The intrinsic properties of putative PNs (input resistance: intact, 80.8 ± 3.2 MΩ; cut, 82.3 ± 3.5 MΩ; resting membrane potential: intact, −66.3 ± 1.2 mV; cut, −64.5 ± 1.4 mV; firing threshold: intact, −39.7 ± 1.0 mV; cut, −38.0 ± 1.7 mV; membrane time constant: intact, 25.7 ± 1.6 ms; cut, 24.6 ± 1.8 ms) did not show significant differences between intact (n = 15 cells, 4 slices) and transected (n = 13 cells, 5 slices) slices either.
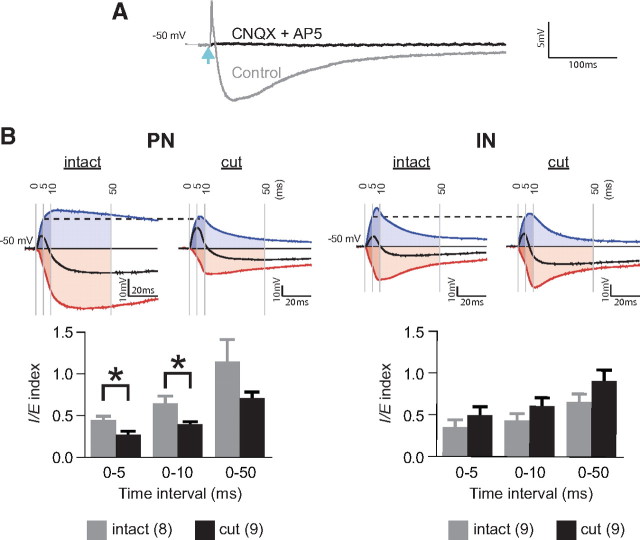
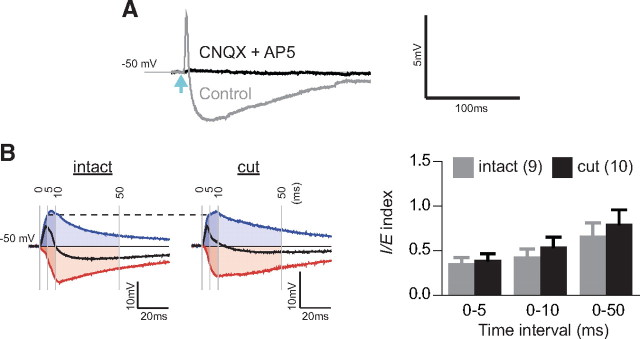
To study the effect of cutting EC on synaptic plasticity in LA PNs, we adapted a spike timing-dependent plasticity (STDP) protocol (Sjöström et al., 2001). Optical pulses of double the threshold energy were paired with 5 ms depolarizing current to produce action potential, which peaked within 3–5 ms after EPSP onset (Fig. 2 D, top). This protocol did not produce long-term potentiation (LTP) in intact slices but evoked LTP in transected slices or when GABAA receptor-mediated transmission was blocked by picrotoxin (PTX) (LTP as the percentage of baseline EPSP slope at 35–40 min after induction: intact: 91 ± 7.3, n = 10, p = 0.26; cut: 141 ± 16, n = 9, p = 0.03; intact with PTX: 130 ± 5.2, n = 8, p = 0.001) (Fig. 2 D, bottom and right). This suggests that GABA from the paracapsular interneurons in EC or from local interneurons activated by EC glutamatergic output, which is blocked by cutting, suppresses plasticity in TeA input to LA PNs. Since such a scenario predicts that EC transection would shift the balance between inhibitory and excitatory responses in the TeA–LA PN pathway toward excitation, we next examined this balance. The combined EPSP/IPSP responses were evoked from −50 mV membrane potential. The excitatory component of the response was eliminated in the presence of AMPA and NMDA receptor blockers 6-cyano-7-nitroquinoxaline-2,3-dione (CNQX) and (2R)-aminophosphonopentanoate (AP-5). The inhibitory component, which was blocked by PTX, was also eliminated by CNQX and AP-5 (Fig. 3 A), indicating the disynaptic nature of inhibition and confirming that ChR2 was absent in GABAergic fibers.
Figure 3.
Transection of EC shifts balance between inhibition and excitation in PNs toward excitation during activation of TeA fibers. A, EPSP/IPSP sequences evoked in PNs at −50 mV resting membrane potential (Control: gray trace) by blue light pulses (light blue arrow) with 4× intensity of the threshold energy are blocked by CNQX and AP-5 (CNQX+AP-5: black trace). Each trace is an average of five consecutive traces. B, Determination of I/E index for responses in PNs (left) and INs (right) from intact and transected slices. Top, Examples of mixed EPSP/IPSP response obtained in the absence of PTX (black line), excitatory response isolated in the presence of 100 μm PTX (blue line), and inhibitory component (red line) obtained by subtraction of the excitatory response from the mixed response. Shaded areas under the curves correspond to the time intervals of 5, 10, and 50 ms from EPSP onset. All responses are shown normalized to the EPSP amplitude at 5 ms (indicated by horizontal dashed line). Bottom, Summary diagram for the corresponding I/E indices. Number of cells is shown in parentheses. *p < 0.05. Error bars represent SEM.
To quantify the balance between inhibitory and excitatory responses, we first recorded combined EPSP/IPSP responses and then pharmacologically isolated EPSP responses by 20 min perfusion with ACSF containing PTX, which blocks GABAA receptor-mediated transmission; QX314 was included in the pipette solution to prevent sodium spikes and attenuate GABAB receptor-mediated response (Otis et al., 1993). The putative inhibitory component of the response was determined by subtracting the EPSP response from the combined EPSP/IPSP response. The I/E index was calculated as the ratio between areas under the corresponding response curves during 5, 10, and 50 ms from the onset of EPSP. The I/E index in PNs was significantly lower in transected than in intact slices during the first 5 and 10 ms, and showed a tendency to be lower during 50 ms (Fig. 3 B, left). These data indicate that disconnection of LA from EC decreases the relative levels of inhibition in LA PNs. For INs, the I/E index had a tendency to be higher in transected slices, but this tendency did not reach statistical significance (Fig. 3 B, right).
To determine whether the EC transection alters basic properties of EPSP responses to photostimulation in PNs and INs, we compared onset latency, time of peak, peak amplitude, maximum rise slope, and time of the maximum rise slope between intact and transected slices stimulated in the presence of PTX and found no significant differences (Table 1).
Table 1.
Properties of EPSP responses to photostimulation of TeA fibers
| PN/intact EC (n = 9) | PN/transected EC (n = 8) | IN/intact EC (n = 8) | IN/transected EC (n = 9) | |
|---|---|---|---|---|
| Onset latency (ms) | 3.26 ± 0.16 | 3.49 ± 0.21 | 3.81 ± 0.38 | 3.10 ± 0.15 |
| Time of peak (ms) | 17.93 ± 4.00 | 13.69 ± 0.77 | 15.01 ± 1.41 | 15.06 ± 1.40 |
| Peak amplitude (mV) | 14.89 ± 3.52 | 14.01 ± 3.45 | 26.66 ± 5.98 | 20.68 ± 2.77 |
| Maximum rise slope (mV/ms) | 3.64 ± 0.68 | 4.03 ± 0.80 | 5.59 ± 1.16 | 4.78 ± 0.34 |
| Time of maximum rise slope (ms) | 5.12 ± 0.25 | 5.97 ± 0.73 | 6.75 ± 0.99 | 5.23 ± 0.73 |
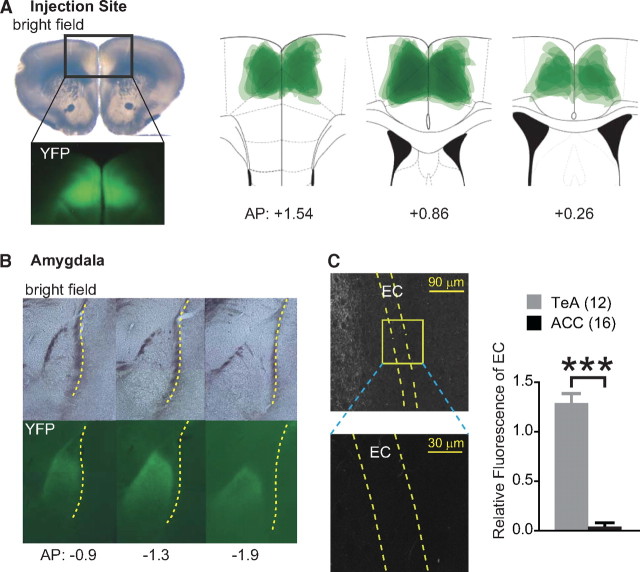
Next, we examined synaptic plasticity in a different cortico-amygdala pathway, which does not have strong projections to EC. We injected ChR2-AAV into ACC (Fig. 4 A), whose amygdala projections, described in previous studies, appear to bypass EC (Cassell and Wright, 1986; Bissière et al., 2008). We found ChR2-Venus-labeled axons inside LA and not in EC (Fig. 4 B,C); further evaluation of confocal images revealed that YFP fluorescence in EC from ACC-injected mice was negligible in comparison with that from TeA-injected animals (p < 0.001) (Fig. 4 C). In contrast to experiments with the TeA injections, EPSPs or EPSCs were not observed in the paracapsular interneurons even when the maximum energy of light pulses (1500 nJ) was used for stimulation (15 cells from 8 slices from 3 animals). As in experiments with TeA–LA pathway, light pulses evoked responses in LA PNs, and the threshold energy to evoke response was similar with that in TeA–LA pathway (624 ± 102 nJ, n = 31, p > 0.05).
Figure 4.
ChR2-Venus-expressing axons from ACC innervate LA but bypass EC. A, A representative slice containing ACC infected with ChR2-AAV. Top left, Bright-field image. Lower left, Fluorescence image (YFP) of the corresponding rectangle area. Right, Overlay of YFP-expressing areas at injection sites from 8 animals. B, Coronal sections of LA under bright-field illumination (top) and fluorescence (YFP) (bottom). Numbers at bottom indicate distance from the bregma. Yellow dotted line depicts EC. C, Left, Confocal images of YFP-expressing fibers around EC from a mouse injected with ChR2-AAV in ACC. Magnified image represents yellow rectangular areas containing LA EC. Right, Relative YFP fluorescence in EC of mice injected with ChR2-AAV into either ACC or TeA. Number of animals is shown in parentheses. ***p < 0.001. Error bars represent SEM.
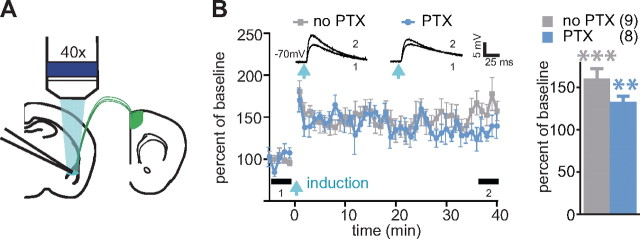
Using the STDP protocol, we tested LTP in PNs from the same area (Fig. 1 B, yellow triangle). LTP was produced in the absence and presence of PTX (LTP at 35–40 min after induction: no PTX: 160 ± 12, n = 9, p = 0.001; PTX: 133 ± 7, n = 8, p = 0.002) (Fig. 5), indicating that this form of plasticity in the ACC–LA pathway is not blocked by GABAA receptor.
Figure 5.
LTP in ACC–LA pathway does not require inhibition of GABAA receptor-mediated transmission. A, Experimental scheme. B, Left, LTP in ACC–LA pathway, insets represent averaged EPSPs before (1) and after (2) induction as indicated by thick bars (5 min each). Right, Summary for the LTP. Number of cells is shown in parentheses. **p < 0.01, ***p < 0.001. Error bars represent SEM.
To examine whether EC transection affects the balance between excitation and inhibition in LA neurons following photostimulation of ACC fibers in LA, we determined I/E indices in LA PNs using the same method as in Figure 3 B. The I/E indices in PNs were not significantly different (p > 0.05) between intact and transected slices for 5, 10, and 50 ms time intervals; (Fig. 6). The transection had no significant effect on EPSP onset latency, time of peak, peak amplitude, maximum rise in slope, and time of maximum rise in slope (Table 2).
Figure 6.
Transection of EC does not change the balance between inhibition and excitation in PNs during activation of ACC fibers. A, EPSP/IPSP sequences evoked in PNs at −50 mV resting membrane potential (Control: gray trace) by blue light pulses (light blue arrow) with 4× intensity of the threshold energy are blocked by CNQX and AP-5 (CNQX+AP-5: black trace). Each trace is an average of five consecutive traces. B, Determination of I/E index for responses in PNs in intact and transected slices. Left, Examples of mixed EPSP/IPSP response obtained in the absence of PTX (black line), excitatory response isolated in the presence of 100 μm PTX (blue line), and inhibitory component (red line) obtained by subtraction of the excitatory response from the mixed response. Shaded areas under the curves correspond to the time intervals of 5, 10, and 50 ms from EPSP onset. All responses are shown normalized to the EPSP amplitude at 5 ms (indicated by horizontal dashed line). Right, Summary diagram for the corresponding I/E indices. Number of cells is shown in parentheses. Error bars represent SEM.
Table 2.
Properties of EPSP responses in LA PNs to photostimulation of ACC fibers
| Intact EC (n = 9) | Transected EC (n = 9) | |
|---|---|---|
| Onset latency (ms) | 3.06 ± 0.18 | 3.07 ± 0.08 |
| Time of peak (ms) | 16.94 ± 2.32 | 16.23 ± 1.24 |
| Peak amplitude (mV) | 6.59 ± 1.00 | 5.66 ± 0.83 |
| Maximum rise slope (mV/ms) | 2.10 ± 0.27 | 1.99 ± 0.22 |
| Time of maximum rise slope (ms) | 4.98 ± 0.34 | 4.53 ± 0.13 |
Discussion
In the present study, we used ChR2-mediated activation of axonal fibers from TeA inside LA to examine how EC modulates synaptic plasticity in this pathway. Photostimulation allowed activation of TeA fibers inside LA even when connections between EC and LA were cut off. We show that this physical disconnection of EC from LA facilitates synaptic plasticity in TeA-LA synapses and also shifts the balance between inhibitory and excitatory responses in LA PNs toward excitation.
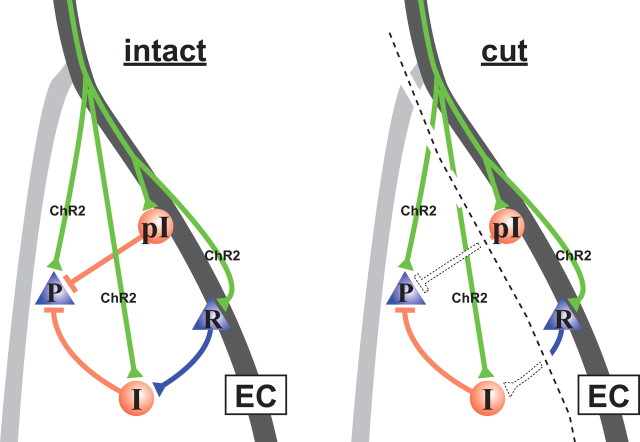
We propose that I/E changes following EC transection are caused mainly by disconnection of LA from GABAergic neurons located inside or very near EC and activated by TeA axons (scenario 1) (Fig. 7). These cells likely include the paracapsular interneurons, which have been shown to provide feedforward inhibition of PNs inside LA (Marowsky et al., 2005), and which, we found, can fire action potentials in response to photostimulation of TeA fibers. While 9 of 10 tested paracapsular cells showed EPSPs in response to the photostimulation of TeA fibers, only 4 cells fired action potentials, indicating heterogeneity of their synaptic connections, which is consistent with heterogeneities of their morphologies (Millhouse, 1986) and molecular signatures (Kaoru et al., 2010). Such partial recruitment of paracapsular neurons may still be sufficient for significant feedforward inhibition if the inhibitory axons make multiple contacts on multiple PNs inside LA.
Figure 7.
Schematic representation of potential inhibitory mechanisms recruited through EC. Left, According to scenario 1, fibers from TeA (green lines) fire paracapsular GABAergic neurons (pI), which provide feedforward inhibition of PN (P) inside LA. According to scenario 2, fibers from TeA activate hypothetical glutamatergic relay cells (R). The relay cells recruit GABAergic neurons inside LA (I), which increase inhibition in LA PNs. Right, Transection of EC eliminates both inhibitory mechanisms but does not prevent photoactivation of TeA fibers, which contain ChR2.
While inhibitory projections from the paracapsular cells appear to be the simplest explanation for the inhibitory effect of EC, there remains a more complex possibility (scenario 2) that unknown glutamatergic “relay” cells, residing inside or near the EC and projecting preferentially to INs inside basolateral amygdala, are responsible for the EC-mediated inhibition (Fig. 7). In such a case, severing excitatory output from these cells to LA INs would increase the I/E index in LA INs, but we did not find this increase to be significant despite a tendency of the I/E index to be higher in transected slices. Nevertheless, given high heterogeneity of LA INs, it is possible that this mechanism involves a specialized subpopulation of INs that we missed among randomly chosen putative INs; therefore, we cannot completely rule out this scenario.
Our observations have two implications. First, given the found differences between the two cortico-amygdala inputs, plastic changes in LA inputs from ACC, which is thought to convey the affective component of sensory information (Rainville et al., 1997), appear to be under less stringent control by GABA, whereas auditory and multimodal sensory information from TeA (McDonald, 1998) encounters strong GABA-dependent gating mediated by EC. Second, given that the feedforward inhibition from the paracapsular interneurons can be altered by neuromodulators (Marowsky et al., 2005), these cells are positioned to fine tune fear learning by gating plasticity in the TeA–LA pathway. Finally, the optogenetics technique would be a powerful tool to shed light into the intermingled and not-yet-resolved cortico-amygdala projections and to investigate how they interact with amygdala circuits.
Footnotes
This study was supported by the National Institute of Mental Health Intramural Research Program. We thank Chris McBain and Victor Luna for critical comments on the manuscript, and Jiayang Li for image analysis.
References
- Bissière S, Plachta N, Hoyer D, McAllister KH, Olpe HR, Grace AA, Cryan JF. The rostral anterior cingulate cortex modulates the efficiency of amygdala-dependent fear learning. Biol Psychiatry. 2008;63:821–831. doi: 10.1016/j.biopsych.2007.10.022. [DOI] [PMC free article] [PubMed] [Google Scholar]
- Cassell MD, Wright DJ. Topography of projections from the medial prefrontal cortex to the amygdala in the rat. Brain Res Bull. 1986;17:321–333. doi: 10.1016/0361-9230(86)90237-6. [DOI] [PubMed] [Google Scholar]
- Daw MI, Tricoire L, Erdelyi F, Szabo G, McBain CJ. Asynchronous transmitter release from cholecystokinin-containing inhibitory interneurons is widespread and target-cell independent. J Neurosci. 2009;29:11112–11122. doi: 10.1523/JNEUROSCI.5760-08.2009. [DOI] [PMC free article] [PubMed] [Google Scholar]
- Kaoru T, Liu FC, Ishida M, Oishi T, Hayashi M, Kitagawa M, Shimoda K, Takahashi H. Molecular characterization of the intercalated cell masses of the amygdala: implications for the relationship with the striatum. Neuroscience. 2010;166:220–230. doi: 10.1016/j.neuroscience.2009.12.004. [DOI] [PubMed] [Google Scholar]
- Marowsky A, Yanagawa Y, Obata K, Vogt KE. A specialized subclass of interneurons mediates dopaminergic facilitation of amygdala function. Neuron. 2005;48:1025–1037. doi: 10.1016/j.neuron.2005.10.029. [DOI] [PubMed] [Google Scholar]
- McDonald AJ. Cortical pathways to the mammalian amygdala. Prog Neurobiol. 1998;55:257–332. doi: 10.1016/s0301-0082(98)00003-3. [DOI] [PubMed] [Google Scholar]
- McKernan MG, Shinnick-Gallagher P. Fear conditioning induces a lasting potentiation of synaptic currents in vitro. Nature. 1997;390:607–611. doi: 10.1038/37605. [DOI] [PubMed] [Google Scholar]
- Millhouse OE. The intercalated cells of the amygdala. J Comp Neurol. 1986;247:246–271. doi: 10.1002/cne.902470209. [DOI] [PubMed] [Google Scholar]
- Otis TS, De Koninck Y, Mody I. Characterization of synaptically elicited GABAB responses using patch-clamp recordings in rat hippocampal slices. J Physiol. 1993;463:391–407. doi: 10.1113/jphysiol.1993.sp019600. [DOI] [PMC free article] [PubMed] [Google Scholar]
- Petreanu L, Mao T, Sternson SM, Svoboda K. The subcellular organization of neocortical excitatory connections. Nature. 2009;457:1142–1145. doi: 10.1038/nature07709. [DOI] [PMC free article] [PubMed] [Google Scholar]
- Rainville P, Duncan GH, Price DD, Carrier B, Bushnell MC. Pain affect encoded in human anterior cingulate but not somatosensory cortex. Science. 1997;277:968–971. doi: 10.1126/science.277.5328.968. [DOI] [PubMed] [Google Scholar]
- Sjöström PJ, Turrigiano GG, Nelson SB. Rate, timing, and cooperativity jointly determine cortical synaptic plasticity. Neuron. 2001;32:1149–1164. doi: 10.1016/s0896-6273(01)00542-6. [DOI] [PubMed] [Google Scholar]
- Tamamaki N, Yanagawa Y, Tomioka R, Miyazaki J, Obata K, Kaneko T. Green fluorescent protein expression and colocalization with calretinin, parvalbumin, and somatostatin in the GAD67-GFP knock-in mouse. J Comp Neurol. 2003;467:60–79. doi: 10.1002/cne.10905. [DOI] [PubMed] [Google Scholar]
- Tsvetkov E, Carlezon WA, Benes FM, Kandel ER, Bolshakov VY. Fear conditioning occludes LTP-induced presynaptic enhancement of synaptic transmission in the cortical pathway to the lateral amygdala. Neuron. 2002;34:289–300. doi: 10.1016/s0896-6273(02)00645-1. [DOI] [PubMed] [Google Scholar]


