

Abstract
As the two major glial cell types in the brain, astrocytes and microglia play pivotal but different roles in maintaining optimal brain function. Although both cell types have been implicated as major targets of methylmercury (MeHg), their sensitivities and adaptive responses to this metal can vary given their distinctive properties and physiological functions. This study was carried out to compare the responses of astrocytes and microglia following MeHg treatment, specifically addressing the effects of MeHg on cell viability, reactive oxygen species (ROS) generation and glutathione (GSH) levels, as well as mercury (Hg) uptake and the expression of NF-E2-related factor 2 (Nrf2). Results showed that microglia are more sensitive to MeHg than astrocytes, a finding that is consistent with their higher Hg uptake and lower basal GSH levels. Microglia also demonstrated higher ROS generation compared to astrocytes. Nrf2 and its downstream genes were upregulated in both cell types, but with different kinetics (much faster in microglia). In summary, microglia and astrocytes each exhibit a distinct sensitivity to MeHg, resulting in their differential temporal adaptive responses. These unique sensitivities appear to be dependent on the cellular thiol status of the particular cell type.
Keywords: methylmercury, microglia, astrocytes, reactive oxygen species, Nrf2
Introduction
Mercury, a global pollutant, is methylated to MeHg in the aquatic environment by sulfate-reducing bacteria (Jensen and Jernelov, 1969). Subsequently, MeHg is readily taken up by living organisms and biomagnified through the food chain, reaching concentrations 10,000–100,000 times greater in fish than in the surrounding water (EPA, 1997), resulting in its accumulation at higher concentrations in fish-eating populations (Dorea, 2008). Congenital Minamata disease is the most well documented neurological disorder caused by MeHg poisoning (Irukayama et al., 1963).
MeHg readily crosses the blood-brain barrier via the L-type large neutral amino acid transporter and is distributed to all brain cell types (Yin et al., 2008). Although the majority of studies on MeHg-induced central nervous system (CNS) damage focus on its effects on neurons, (Tamm et al., 2006; Yuan and Atchison, 2007), recent studies have extended to other CNS cell types, predominately glial cells (Heneka et al. 2010; Verkhratsky, 2010 ). Glial cells, like astrocytes and microglia perform diverse and important functions, such as providing support and nutrition (Hamilton et al., 2007; Vernadakis 1988), removing pathogens (Alarcon et al., 2005), inducing neuronal differentiation (Goritz et al., 2007) and mediating immune responsiveness (Griffiths et al., 2009).
The effects of MeHg on glial cells modulate neurotoxicity (Allen et al., 2002; Sakamoto et al., 2008). MeHg inhibits the astrocytic uptake of cystine, a crucial precursor for glutathione (GSH) synthesis. Because astrocytes play an essential role in providing GSH precursors to neurons, the MeHg-induced decrease of cystine uptake in astrocytes contributes to neuronal oxidative damage (Allen et al., 2002). MeHg also inhibits astrocytic glutamate uptake, while stimulating glutamate efflux (Aschner et al., 1993), resulting in excessive glutamate in the synapse and, consequently, neuronal excitotoxicity. Furthermore, MeHg stimulates the microglial production and secretion of lysosomal proteases, leading to neuronal toxicity in vivo (Sakamoto et al., 2008). Although the aforementioned studies indicate that the glial effects of MeHg contribute to increased toxicity, several lines of evidence also show that both astrocytes and microglia mediate protective effects against MeHg-induced neuronal toxicity. For example, MeHg-exposed microglia increase interleukin-6 (IL-6) production and release (Eskes et al., 2002). Moreover, astrocytes, when co-cultured with neurons, increase neuronal resistance to MeHg (Morken et al., 2005).
As a key protective factor against oxidative stress, Nrf-2 is upregulated in both astrocytes and microglia upon MeHg treatment (Ni et al., 2010; Wang et al., 2009). Under physiological conditions, Nrf2 is bound to Kelch-like ECH-associating protein 1 (Keap1) in the cytoplasm (Kensler and Wakabayashi, 2009). The interaction between Nrf2 and Keap1 is disrupted upon oxidative stress, resulting in the dissociation of Nrf2 from Keap1. Notably, the unbound Nrf2 is more resistant to proteasomal degradation (Chen et al., 2009), leading to the increased translocation of Nrf2 into the nuclei (Li and Kong, 2009). Once in the nucleus, Nrf2 interacts with an antioxidant response element (ARE) to initiate the transcription of target genes, and their encoded proteins serve to detoxify xenobiotics and endogenous reactive electrophiles (Itoh et al., 1999; Prestera et al., 1993; Prestera and Talalay, 1995). An objective of the present study was to determine differences in the kinetics of Nrf2 activation between glial cell types in order to better understand their respective roles in mediating adaptive responses to MeHg treatment.
Although previous studies have assessed the effects of MeHg on microglia and astrocytes, their respective roles in modulating neurotoxicity (Ni et al., 2010; Yin et al., 2007) have not yet been systematically addressed. We hypothesized that, although common factors and pathways may be activated in astrocytes and microglia in response to MeHg toxicity, their respective sensitivities and kinetic profiles would differ. The data from our studies support this hypothesis, establishing that microglia are more sensitive to MeHg than astrocytes as determined by cell viability, ROS generation, glutathione depletion and Nrf2 activation.
Materials and Methods
Cell Culture
Primary astrocytes and microglia were isolated from postnatal day-1 neonatal Sprague-Dawley rats, according to a published protocol (Ni and Aschner, 2010; Ni et al., 2010). The mixed glial cell culture was maintained in minimum essential medium (MEM) (Invitrogen, Carlsbad, CA, USA), supplemented with 5% heat-inactivated fetal bovine serum (Hyclone, South Logan, Utah, USA) and 5% horse serum (Invitrogen, Carlsbad, CA, USA). After two weeks in culture, microglia and astrocytes were separated by gentle shaking for 20 min at room temperature. Cells were then plated in 6-well plates and cultured at 37°C in a 95% air/5% CO2 incubator. The plating density for microglia and astrocyte cultures was identical (20,000/well). Notably, the attachment of microglia to the substratum is much looser than that of astrocytes, so fewer cells remained on the slide coverslips after immunochemistry (see Fig. 4B). For these experiments, we used poly-L-lysine coated plates. Microglia are widely spread on this particular coating material, while astrocytes grow in clusters (Ni and Aschner, 2010).
Fig 4.
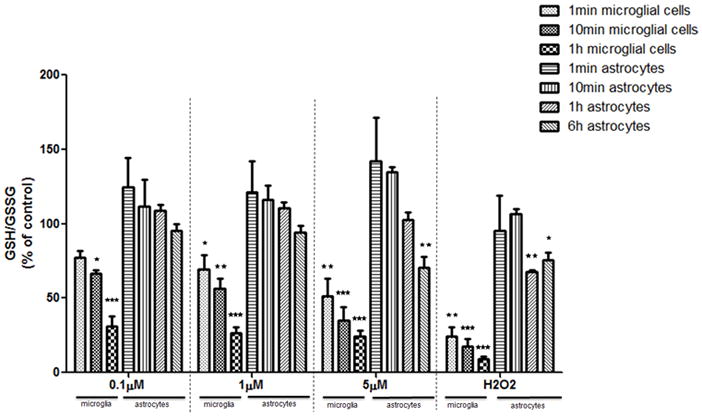
GSH/GSSG ratios in microglia and astrocytes. GSH and GSSG concentrations were measured by HPLC, and the ratios of GSH/GSSG were calculated. The ratio of the control group was set to 100%. Both cell types were treated with MeHg for 1 min, 10 min and 1 hr. Astrocytes were also treated with MeHg for 6 hr. Values are expressed as the mean ± SEM derived from three independent experiments. ★ P<0.05, ★ ★ P<0.01, ★ ★ ★ P<0.001
MTT Assay and LDH Assay
The cytotoxic effects of MeHg were evaluated by 3-[4,5- dimethylthiazol-2-yl]-2,5 diphenyltetrazolium bromide (MTT) assay (Sigma in vitro Toxicology Assay Kit, MTT based, M-5655, St. Louis, MO, USA) and lactate dehydrogenase (LDH) assay (L2402, Sigma, St. Louis, MO, USA), following standard protocols (Ni et al., 2010). The Absorbance for MTT assay was measured at 570 nm and LDH assay at 490 nm. The background absorbance (690 nm) was subtracted out for both assays.
Detection of intracellular ROS formation
Astrocytes and microglia were pre-incubated with dichlorodihydrofluorescein diacetate acetyl ester (H2DCFDA) (C6827, Invitrogen, Carlsbad, CA, USA) at a concentration of 25 μM for 30 min at 37°C. MeHg was added without aspirating the H2DCFDA solution. After treatment, as indicated, cells were washed twice with 4°C phosphate-buffered solution (PBS) and precipitated at 400 × g. The cell pellets were dissolved in 1% Triton X- 100 (Promega, Madison, Wisconsin, USA). Fluorescence was measured at 530 nm (excitation at 480 nm) by SpectraMax M5 (Molecular Devices, Sunnyvale, CA, USA).
Measurement of glutathione (GSH)
The intracellular GSH concentration was measured by high-performance liquid chromatography (HPLC) as previously described (Ni et al., 2010; Wang et al., 2009). Cells were derivatized with iodoacetic acid and dansyl chloride. HPLC analysis was carried out with a propylamine column (YMC Pack, NH2, Waters, Milford, MA, USA) and an automated HPLC system (Alliance 2695, Waters Corporation, Milford, MA, USA). GSH and GSSG concentrations were normalized to the protein concentration of the samples analyzed with the BCA Protein Assay Reagent (23225, Thermo, Rockford, IL, USA).
Immunocytochemistry
Astrocytes and microglia were cultured on poly-L-lysine coated coverslips. Immunochemistry was performed following a published protocol (Ni et al., 2010). Cells were incubated for 1 hr with 1:200 rabbit anti-Nrf2 (Abcam 31136, Cambridge, MA, USA) prior to incubation with 1:400 secondary antibody, donkey anti-rabbit IgG conjugated with fluorescein isothiocyanate FITC (Millipore, AP182F, Billerica, MA). Coverslips were mounted with Vectashield Mounting Medium with Propidium Iodide (PI) (VECTOR, H-1300, Burlingame, CA, USA). The fluorescence signal was detected with a Zeiss confocal microscope (LSM 510, Zeiss, Dublin, CA, USA).
Western Blot Analysis
Total cellular proteins were prepared with a radioimmunoprecipitation assay buffer (RIPA, R0278-50ML, Sigma, St. Louis, MO, USA) with protease inhibitors (Complete Protease Inhibitor Cocktail, 04693116001, Roche, Indianapolis, IN, USA) and Halt Phosphatase Inhibitors (78427, Thermo Scientific, Rockford, IL 61105). Western blot analysis was conducted with primary antibodies, rabbit-anti Nrf2 (1:400) (sc- 722, Santa Cruz Biotechnology, Santa Cruz, CA, USA) and mouse anti β-actin (1:2,000) (A1978, Sigma, St. Louis, MO, USA). Secondary antibodies were donkey anti-rabbit IgG conjugated with horseradish peroxidase (HPR) (1:1000) (W4011, Promega, Madison, Wisconsin, USA) and donkey anti-mouse IgG conjugated with horseradish HPR (1:4,000) (W4021, Promega, Madison, Wisconsin, USA). The density of the Nrf2-specific bands was normalized to β-actin.
Quantitative Real-Time PCR
The transcription levels of heme oxygenase 1 (Ho1), NAD(P)H dehydrogenase, quinone 1 (Nqo1) and x- C-type transporter (xCT) were measured by real-time PCR using the Universal Probe Library (UPL) (Roche, Indianapolis, IN, USA). Table 1 lists the primer sequences and UPL probes. Average threshold cycle (ΔCt) values were used to determine the relative difference between control and treated samples. All data were normalized to β-actin levels.
Table 1.
| Primer Sequences and UPL Probes Used for Real-time PCR Analysis | |||
|---|---|---|---|
| Gene | Forward (5′-3′) | Backward (5′-3′) | UPL probe |
| Ho-1 | 5′-GTC AGG TGT CCA GGG AAG G-3′ | 5′-CTC TTC CAG GGC CGT ATA GA-3′ | #9 |
| Nqo1 | 5′-AGC GCT TGA CAC TAC GAT CC-3′ | 5′-CAA TCA GGG CTC TTC TCA CC-3′ | #50 |
| xCT | 5′-TCC ATG AAC GGT GGT GTG T-3′ | 5′-CCC TTC TCG AGA TGC AAC AT-3′ | #80 |
| β-actin | 5′-CCC GCG AGT ACA ACC TTC T- 3′ | 5′-CGT CAT CCA TGG CGA ACT- 3′ | #17 |
Nrf2 Knockdown by Short Hairpin RNA (shRNA)
At ~50–60% confluence, primary astrocytes and microglia were infected with 15 μl lentiviral particles containing 1X10⁶ infectious units of virus (IFU) for 24 hr prior to MeHg treatment. The lentiviral particles containing expression constructs of shRNA against Nrf2 (sc-37049-V, Santa Cruz Biotechnology, Santa Cruz, CA, USA) were used to knock down Nrf2. Lentiviral particles containing scrambled shRNA sequence with no known gene target (sc-108080, Santa Cruz Biotechnology, Santa Cruz, CA, USA) were used as the negative control.
Measurement of Intracellular Mercury (Hg) Levels
14C-MeHg (82 nCi/μg Hg, American Radiolabeled Chemical, Inc., St. Louis, MO) was added into regular MeHg at the volume ratio of 1:1,000. After treatment with a radiolabeled 14C-MeHg/“cold” MeHg mixture at the indicated concentrations, cells were washed three times with a cold mannitol buffer [290 mM mannitol, 10 mM Tris nitrate and 0.5 mM calcium nitrate (Ca(NO3)2] and lysed with 1M sodium hydroxide. Cell lysates (750 μl) were combined with 75 μl 10 M HCl, and radioactivity was measured in a liquid scintillation counter (Tri-Carb 2900TR, Perkin Elmer Life Science). For each well, radioactivity was corrected for the cellular protein content as determined by the BCA assay.
Statistical analysis
All results were expressed as means ± standard errors. Unless otherwise specified, differences between treatment groups were analyzed by one-way analysis of variance (ANOVA), followed by Bonferroni’s post hoc test. Statistical significance was set at p<0.05. All experiments were conducted in 3–4 wells and repeated in a minimum of three independently isolated cell cultures. Data analysis was carried out with GraphPad Prism (GraphPad Software, San Diego, CA, USA).
Results
Microglia are More Vulnerable to MeHg Compared with Astrocytes
As a first step, we compared the sensitivity of rat primary microglia and astrocytes to MeHg. Each cell type was plated at an equal density (20,000 cells/well) to ensure that changes in the measured end-points would be unrelated to plating density. After 6 hr of MeHg treatment, cell viability was determined by the MTT and LDH assays. The MTT assay measures the activity of labile mitochondrial dehydrogenases, a marker of cell viability. As shown in Fig. 1, MeHg (≥ 1 μM) caused a significant decrease (p<0.05) in microglial cell viability. In contrast, the same treatment in astrocytes did not lead to significant cell death. A positive control, 100 μM H2O2 treatment, reduced cell viability to 24±0.1% (p<0.001) and 66.8±5.3% (p<0.001) of control levels in microglia and astrocytes, respectively. Lactate dehydrogenase, a substance released into the medium after the distortion of plasma membrane integrity, is reversely correlated with cell viability (Hernandez et al., 2003). Microglial LDH activity was significantly increased after treatment with 1 μM (p<0.01) and 5 μM (p<0.001) MeHg, while treatment with MeHg (up to 5 μM) did not cause a significant increase in LDH release in astrocytes (Fig.,2). Thus, results from both experiments indicate an increased rate of cell death in microglia vs. astrocytes upon MeHg treatment.
Fig 1.
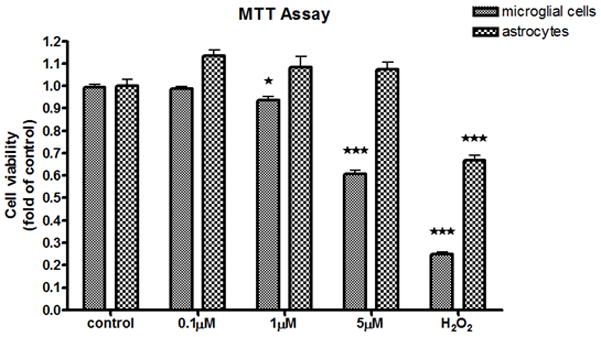
MTT analysis of MeHg-treated astrocytes and microglia. The effects of MeHg cytotoxicity were measured with the MTT assay after MeHg treatment for 6 hr. Values are expressed as the mean ± SEM derived from three independent experiments. ★ P<0.05, ★ ★ P<0.01, ★ ★ ★ P<0.001
Fig 2.
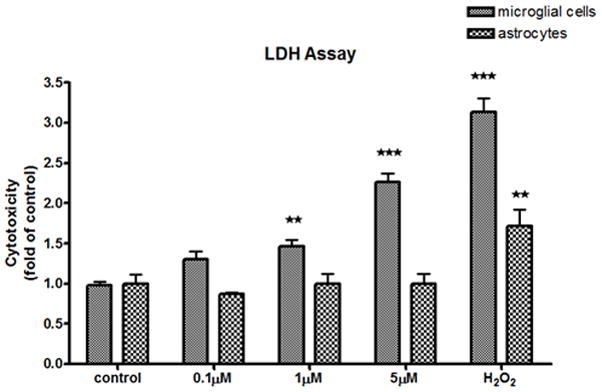
LDH analysis of MeHg-treated astrocytes and microglia. The effects of MeHg cytotoxicity were measured with the LDH assay after MeHg treatment for 6 hr. Values are expressed as the mean ± SEM derived from three independent experiments. ★ P<0.05, ★ ★ P<0.01, ★ ★ ★ P<0.001
Microglia and Astrocytes Exhibit Distinct Kinetics and Levels of ROS Generation
To explain the differences in cell vulnerability to MeHg, we sought to determine whether the kinetics and levels of ROS generation, a common cause of cell death, differed between astrocytes and microglia. The H2DCFDA-based assay was used to measure intracellular ROS. As shown in Fig. 3, increased ROS levels (arbitrary fluorescent units) in microglia were detected as early as 1 min after treatment with 5 μM MeHg (222.6±39.0, p<0.01) or treatment with 100 μM H2O2 (229.0±40.1, p<0.01). ROS levels continued to rise to 243.1±15.3 (p<0.01) following treatment with 1 μM MeHg, and increased to 298.5±40.3 (p<0.001) after treatment with 5 μM MeHg for 10 min. Treatment with the highest concentration of MeHg (5 μM) for 1 hr increased ROS levels to 339.0±28.9 (p<0.001). In astrocytes, however, a significant (p<0.01) increase in ROS generation was only observed only after treatment with 5 μM MeHg for 6 hr.
Fig 3.
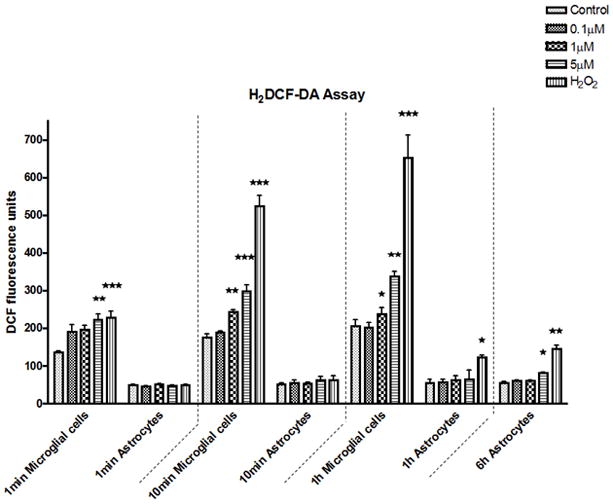
ROS production in astrocytes and microglia. DCF fluorescence was measured at 1 min, 10 min and 1 hr after MeHg treatment both in microglia and astrocytes. MeHg effects at 6 hr were collected only in astrocytes. Values are expressed as the mean ± SEM derived from six independent experiments. ★ P<0.05, ★ ★ P<0.01, ★ ★ ★ P<0.001
MeHg Causes Rapid GSH Reduction in Microglia, but not in Astrocytes
GSH detoxifies ROS in a process that generates GSSG, the oxidized form of GSH (Hwang et al., 1992). Given the different kinetics of ROS production in astrocytes and microglia, further studies were carried out to compare changes in GSH and GSSG levels in the two cell types in response to MeHg treatment. The GSH/GSSG ratio of the control group was standardized to 100% (Fig. 4). Treatment with1 μM and 5 μM MeHg for 1 min decreased microglial GSH/GSSG to 69.1±16.9% (p<0.05) and 51.3±20.9% (p<0.01) of control levels, respectively. A further reduction in the microglial GSH/GSSG ratio was observed after longer MeHg treatments (for 10 min and 1 hr) in a concentration- and time-dependent manner. In contrast, a significant reduction in the astrocytic GSH/GSSG ratio was not detected until 6 hr after treatment with 5 μM MeHg (p<0.01).
Kinetic profiles of Nrf2 Upregulation differ between Microglia and Astrocytes
Nrf2 plays a pivotal role in maintaining the cellular redox balance upon MeHg treatment (Ni et al., 2010; Wang et al., 2009). Given the cell-specific differences in MeHg-induced ROS generation (Fig. 3) and GSH levels (Fig. 4), we sought to determine if Nrf2 kinetics would show a cell-specific signature.
As shown in Fig. 5A, the basal level of Nrf2 was low in both cell types. After treatment for 10 min with 0.1 μM MeHg, Nrf2 fluorescence was sparsely detected in microglia. However, higher MeHg concentrations (≥ 1 μM) appreciably increased the intensity of the Nrf2 fluorescence and promoted its nuclear translocation, as indicated by the colocalization of Nrf2 (green) and PI staining (counterstaining nuclei in red). In contrast, changes in the intensity of the Nrf2 fluorescence and its nuclear translocation in astrocytes were observed only at a much later time point (after 6 hr treatment) and only at the highest concentration of MeHg (5 μM) (Fig. 5B). Consistent with the profiles of ROS generation and GSH reduction, these results suggest that changes in the Nrf2 protein level in astrocytes occur on a more protracted time scale as compared to microglia.
Fig 5.
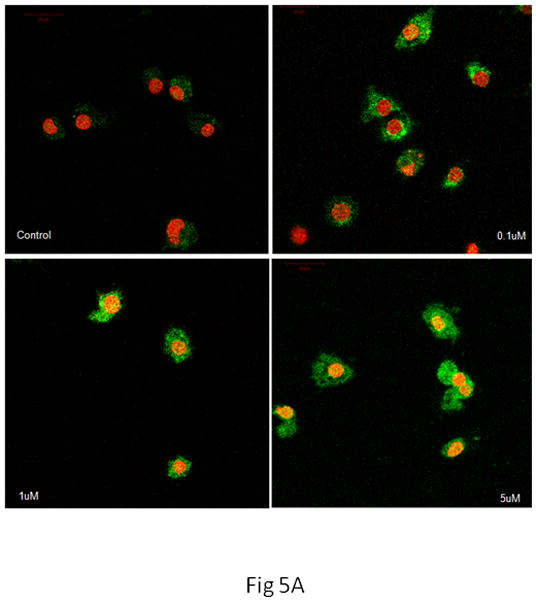
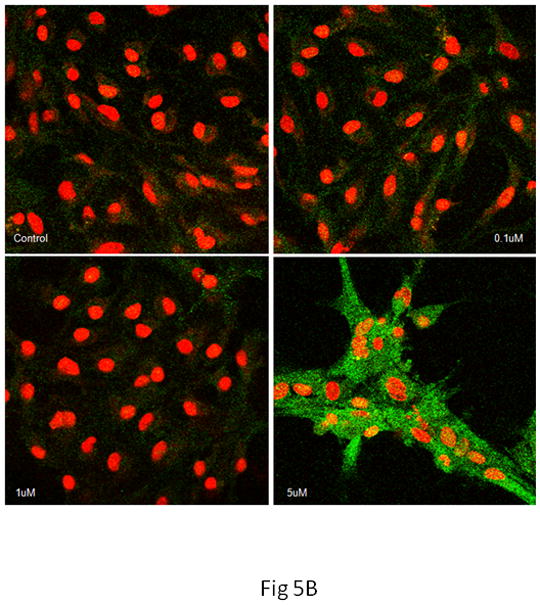
Nrf2 immunostaining in microglia and astrocytes. Nrf2 was labeled in green, cell nuclei were stained with PI dye in red, and the yellow coloring reflects the colocalization of Nrf2 and DNA in microglial nuclei. (A) In microglia, controls showed minimal Nrf2 protein expression in the cytosol. Treatment with 0.1 μM of MeHg for 10 min increased Nrf2 in the cytosol, but not in the nuclei. Higher concentrations of MeHg increased Nrf2 in both the cytosol and nuclei. (B) In astrocytes, treatment with only 5 μM MeHg for 6 hr increased Nrf2 protein expression in both the cytosol and nuclei. Photographs show representative fields observed from four independent experiments. ★ P<0.05, ★ ★ P<0.01, ★ ★ ★ P<0.001
Changes in the microglial and astrocytic Nrf2 fluorescence intensities (Fig. 5) were also corroborated by means of western blot analysis. As shown in Fig. 6, MeHg treatment caused a concentration- and time-dependent increase in microglial Nrf2 protein levels. However, in astrocytes, Nrf2 protein levels remained unchanged following 1 hr of MeHg treatment at the tested concentrations (0.1–5 μM). After prolonged MeHg treatment (6 hr), only the highest concentration of MeHg (5 μM) significantly increased the astrocytic Nrf2 protein level (P<0.05).
Fig 6.
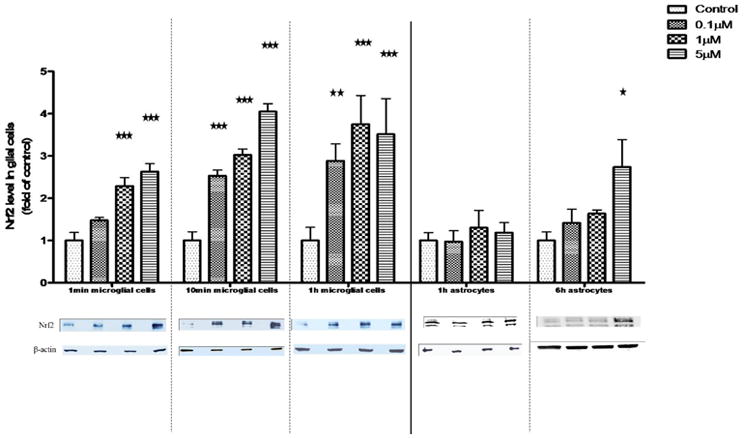
Nrf2 protein level in whole cell lysates of microglia and astrocytes. The Nrf2 protein level in whole cell lysates was measured by western blot analysis. Both cell types were treated with MeHg for 1 min, 10 min and 1 hr. Astrocytes were also treated with MeHg for 6 hr. Values are expressed as the mean ± SEM derived from three independent experiments. ★ P<0.05, ★ ★ P<0.01, ★ ★ ★ P<0.001
The Temporal Upregulation of Nrf2 Downstream Genes Differs in Microglia vs. Astrocytes
Based on the changes noted above (Figs. 5, 6), microglia were treated with MeHg for 30 min, while astrocytes were treated with MeHg for 6 hr prior to mRNA extraction for real-time PCR analysis. As shown in Fig. 7A, in microglia, the transcription levels of Ho1 and Nqo1 were upregulated in response to treatments with 1 and 5 μM MeHg. xCT gene expression was increased by 2.3±1.46-fold over the control value (p<0.01) after treatment with 5 μM MeHg for 30 min. In contrast, increased transcription levels of these genes in astrocytes were detected only after 6 hr of treatment at the highest concentration of MeHg (5 μM) (Fig 7B).
Fig 7.
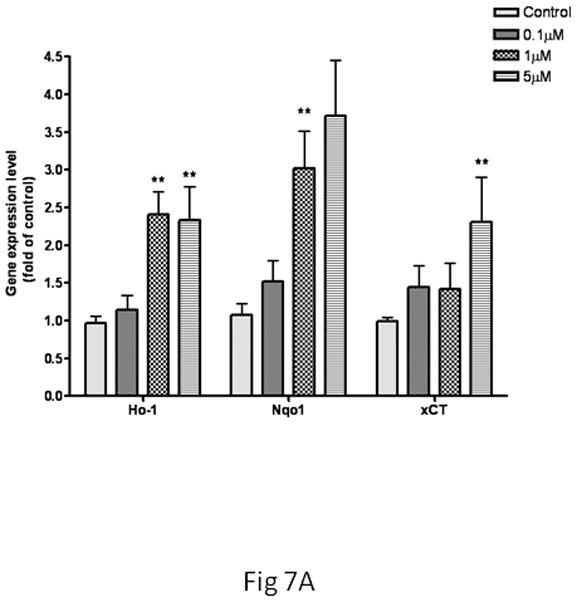
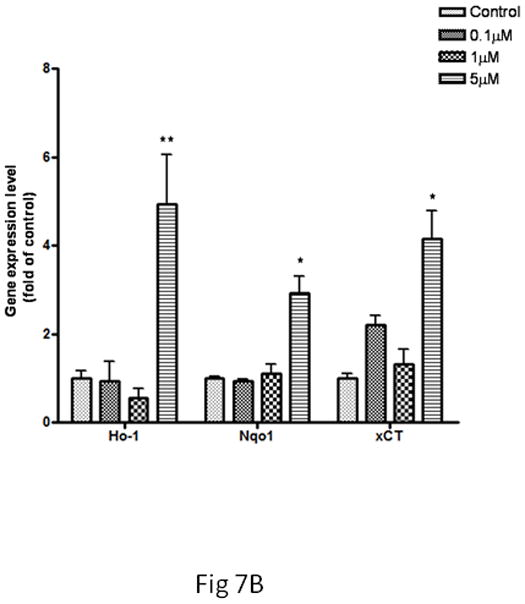
Expression of Ho1, Nqo1 and xCT in microglia and astrocytes. The gene expression level was measured by real-time PCR. The differences in the average threshold cycle (ΔCt) values were determined and normalized to the expression of β-actin. (A) Microglia were treated with MeHg for 30 min. (B) Astrocytes were treated with MeHg for 6 hr. Values are expressed as the mean ± SEM derived from three independent experiments. ★ P<0.05, ★ ★ P<0.01, ★ ★ ★ P<0.001
Next, we tested whether the transcriptional upregulation of these genes would be dependent upon Nrf2 activation by knocking down Nrf2 gene expression. As shown in Fig. 8A, treatment with 5 μM MeHg for 30 min significantly increased Ho1 mRNA levels in both uninfected and scramble shRNA-infected microglia (p<0.05) compared with controls. In contrast, the microglial Ho1 transcription levels in the Nrf2 knockdown cells were indistinguishable from control levels. Similar changes in microglial Nqo1 and xCT were also observed after Nrf2 knockdown (Fig. 8A). In astrocytes (Fig. 8B), treatment with 5 μM MeHg for 6 hr caused a significant increase (p<0.05) in Ho1 and Nqo1 mRNA levels in both uninfected and scramble shRNA-infected astrocytes. Nrf2 knockdown in astrocytes decreased Nrf2 transcription levels to control values in the presence of MeHg. Interestingly, Nrf2 knockdown in astrocytes decreased the xCT transcription level compared to the uninfected or scramble shRNA-infected cells; however, the xCT transcription level remained significantly higher compared to controls (p<0.05).
Fig 8.
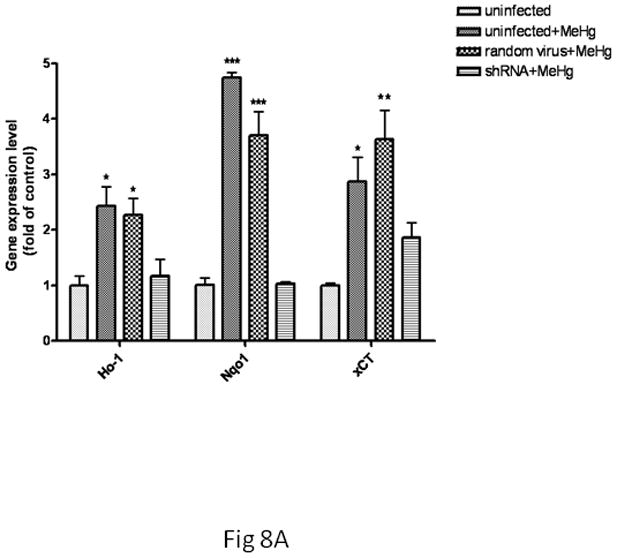
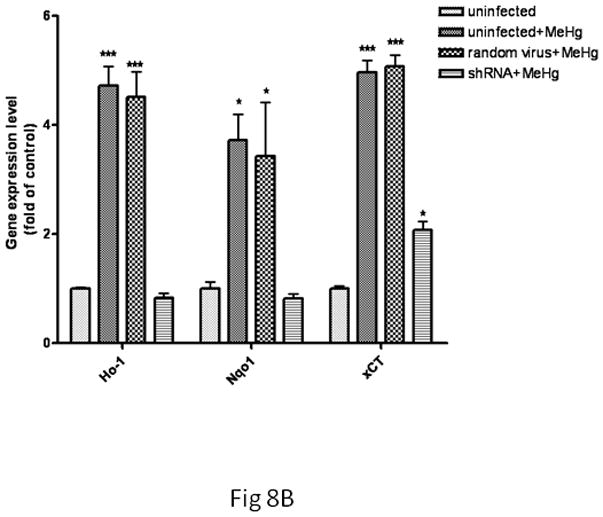
The effect of Nrf2 knockdown on Ho1, Nqo1 and xCT expression in MeHg-treated microglia and astrocytes. Both cell types were infected with lentivirus for 24 hr. Next, 5 μM MeHg was added for 30 min in microglia (A) and for 6 hr in astrocytes (B). Uninfected cells in the absence of MeHg treatment were used to measure the basal gene expression level. The mRNA levels of Ho1, Nqo1 and xCT were measured by real-time PCR. The difference in the average threshold cycle (ΔCt) value was determined and normalized to the expression of β-actin. Values are expressed as the mean ± SEM derived from three independent experiments. ★ P<0.05, ★ ★ P<0.01, ★ ★ ★ P<0.001
Nrf2 Protects Microglia and Astrocytes against MeHg Toxicity
To further evaluate the cytoprotective function of Nrf2 against MeHg-induced cell death, we assessed cell viability upon MeHg treatment in Nrf2 knockdown cells. As shown in Fig. 9, compared to uninfected microglia (in the absence of MeHg treatment), both uninfected cells and random virus-infected cells, exhibited a significant decrease in cell viability (P<0.001) after treatment with 5μM MeHg for 6 hr (assessed by the MTT assay). Notably, Nrf2 knockdown further decreased cell viability after the same treatment (p<0.001). In astrocytes, treatment with MeHg (5μM) for 6 hr did not significantly reduce cell viability in either uninfected or random virus-infected cells. However, Nrf2 knockdown caused a significant decrease (P<0.001) in astrocyte viability after the same treatment.
Fig 9.
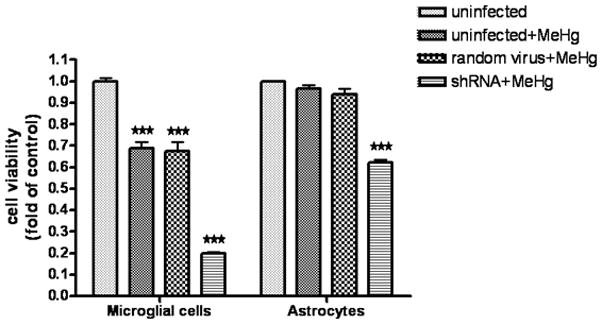
The effect of Nrf2 knockdown on cell viability in microglia and astrocytes. Cell viability was assessed with the MTT assay. Both cell types were first infected for 24 hr with lentivirus and then treated with 5 μM MeHg for 6 hr. The uninfected cells in the absence of MeHg treatment were used to determine the maximal cell viability. Values are expressed as the mean ± SEM derived from three independent experiments. ★ P<0.05, ★ ★ P<0.01, ★ ★ ★ P<0.001
Astrocytes and Microglia Show Differences in Intracellular Mercury Concentrations and GSH Levels
To further address the distinctive vulnerabilities of microglia and astrocytes in response to MeHg, we measured intracellular mercury (Hg) concentrations and basal GSH levels in each cell type. As shown in Fig. 10, MeHg (≥1 μM) treatment in microglia led to a significant increase in Hg accumulation as early as 1 min post-treatment (1 μM, p<0.05; 5 μM, p<0.01). The intracellular microglial Hg concentration reached its peak after treatment with 5 μM MeHg for 1 hr. In contrast, the astrocytic Hg concentration remained unchanged after treatment with both 0.1 μM and 1 μM MeHg for up to 6 hr. Only the highest concentration of MeHg (5 μM) increased the intracellular Hg concentration, commencing at 10 min post-treatment. Notably, the intracellular Hg concentration in astrocytes at each time point was significantly lower compared to the microglial concentration (p<0.01). It should be noted that these differences may not be explained by the inability of astrocytes to internalize MeHg. As shown in Fig. 10, the intracellular Hg level in astrocytes increased after treatment with 5μM MeHg for 1 hr. Furthermore, we also observed the accumulation of Hg in astrocytes after 6 hr, 16 hr and 24 hr. Consistent with our observations, previous reports have corroborated efficient MeHg uptake in primary astrocytes (Aschner et al., 1990).
Fig 10.
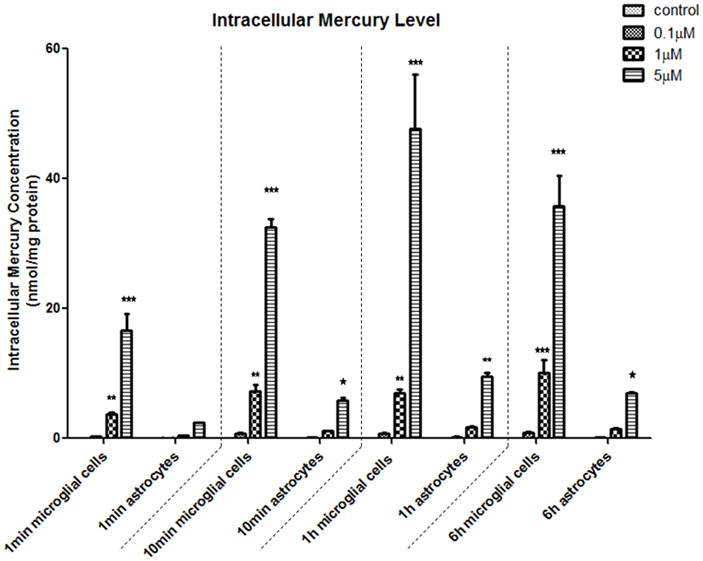
Intracellular mercury (Hg) concentration in microglia and astrocytes. Both cell types were treated with a mixture of 14C-MeHg and non-radioactive MeHg (volume ratio of 1:1000) at for 1 min, 10 min, 1 hr and 6 hr. The radioactivity was measured, and intracellular Hg levels were calculated and normalized to the protein concentrations. Notably, astrocytes had consistently lower intracellular Hg levels compared to microglia. Values are expressed as the mean ± SEM derived from three independent experiments. ★ P<0.05, ★ ★ P<0.01, ★ ★ ★ P<0.001
As noted above, MeHg caused rapid GSH reduction and ROS generation in microglia, but not in astrocytes. Given that GSH is the major free radical detoxifier, we sought to determine if microglia have a smaller GSH pool (vs. astrocytes) to cope with the increased intracellular levels of both MeHg and ROS. The intracellular basal GSH level was measured by HPLC. As shown in Fig. 11, the basal GSH level in microglia was 26.7±3.9 nmol/mg protein, a level which was significantly lower compared to astrocytes (93.4±16.6 nmol/mg protein) (p<0.001).
Fig 11.
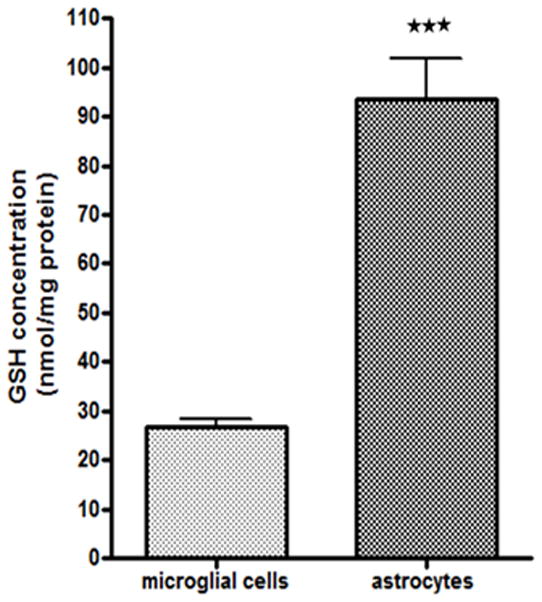
Basal levels of GSH in microglia and astrocytes. GSH levels were measured by HPLC. Basal GSH levels in astrocytes (93.43±16.62nmol/mg protein) were approximately 4-fold higher compared to microglia (26.71±3.85 nmol/mg protein). Values are expressed as the mean ± SEM derived from three independent experiments. ★ P<0.05, ★ ★ P<0.01, ★ ★ ★ P<0.001
Discussion
To our knowledge, this is the first study to systematically compare responses in primary microglia and astrocytes upon treatments with physiologically relevant concentrations of MeHg (Akagi et al., 1998). Several measurements of responsiveness to MeHg have established that microglia respond to this organometal more rapidly and robustly than astrocytes. For example, MeHg (≤1μM) treatment led to rapid ROS generation and GSH depletion in microglia, commencing as early as 1 min after treatment, well before the 6 hr time point when analogous changes were detected in astrocytes treated with 5 μM MeHg (Figs. 3 and 4). Consistent with these observations, comparative studies in cultured cells treated with trimethyltin (TMT) also found significantly higher sensitivity in microglia compared to astrocytes (Monnet-Tschudi et al., 1995).
The distinct sensitivities of microglia and astrocytes likely indicate different roles for the two cell types along a temporal axis in response to MeHg. Indeed, Nrf2 expression exhibited distinct upregulation kinetics after MeHg treatment in microglia vs. astrocytes. Consistent with previous observations (Ni et al., 2010), the upregulation of microglial Nrf2 occurred as early as 1 min after MeHg treatment (Fig. 6), with Nrf2 undergoing nuclear translocation 10 min post-treatment. In contrast, comparable changes in astrocytes were evident only after treatment with the highest concentration of MeHg (5μM) for the longest time point (6 hr) (Figs. 5 and 6). Consistent with the difference in Nrf2 expression kinetics in the two cell types, the temporal expression of genes downstream of Nrf2 was also distinctly regulated. The expression of Ho1, Nqo1 and xCT rapidly increased in microglia, but the increase was delayed in astrocytes (Figs. 7 and 8). The difference in the kinetics of Nrf2 activation could reflect the temporal difference in the activation of these two cell types. The time scale of the changes is consistent with earlier reports. For example, Long and colleagues reported that microglia responded to titanium dioxide (TiO2; ≥60ppm) with a rapid (1–5 min) release of H2O2 (Long et al., 2007). In contrast, 1mM dibutyryl cAMP and 1μg/ml Lipopolysaccharide (LPS) led to astrocytic activation after 6 hr of treatment (LaDu et al., 2000). The faster activation of microglia in comparison to astrocytes was also evident in vivo upon TMT treatment. Reactive microglia in the rat brain were noted as early as 2 days after TMT treatment, while astrocytosis was not evident until 14 days after TMT treatment (Kuhlmann and Guilarte, 2000).
From a molecular point of view, the differences between microglial and astrocytic responsiveness to MeHg appear to be related, at least in part, to differences in their respective cellular thiol statuses. This viewpoint is based on three important events: (i) microglia accumulate higher levels of Hg (Fig. 10), which interact with and oxidize thiols; (ii) microglia contain a lower level of GSH (Fig. 11), the major molecule to maintain the normal cellular thiol status; and (iii) Nrf2 activation is regulated by oxidative modifications of its cysteine thiol groups, as well as by thiol oxidation in Keap1 (He and Ma 2009). The cytoprotective effect of GSH in MeHg-induced toxicity is a well known phenomenon (Mullaney et al., 1994; Mullaney et al., 1993). GSH readily binds to MeHg via its sulfhydryl groups, and the conjugated products are actively pumped out of the cells by multi-drug resistance proteins, leading to a decrease in intracellular MeHg and, by inference, its ensuing toxicity (Konig et al., 1999). In addition, GSH prevents the interaction of Hg with protein thiols (Farina et al., 2009) and detoxifies ROS generated by MeHg to maintain the redox status in the cell (Das et al., 2006). As shown in Fig. 11, a greater than four-fold higher basal GSH level was noted in astrocytes compared to microglia. Taking into account the fact that Nrf2 activation is critically regulated by thiol oxidation (He and Ma, 2009), it is reasonable to assume that the lower GSH content in microglia reflects the more rapid Nrf2 and downstream gene activation in this cell type. The differential thiol status in microglia and astrocytes also explains the observed changes in ROS levels and the GSH/GSSG ratio during MeHg exposure, where microglial GSH was depleted faster given its lower basal levels. Intracellular MeHg has been reported to be exported out of cells as the GSH complex (Heggland et al., 2009); thus, it is also possible that higher GSH levels in astrocytes facilitate the extrusion of Hg from these cells at a faster rate compared with the microglia (Fig. 10). Notably, the basal level of astrocytic GSH was reported to be 80±10nmol/mg protein (Wang et al., 2002), which is consistent with our results.
MeHg not only directly activates glial cells, but also alters normal CNS function via molecules released by glial cells. For example, upon activation, microglia produce free radicals (Figs. 3 and 4) (Long et al., 2007) and release proinflammatory cytokines, such as interleukin 6 (IL-6) (Chang, 2007). IL-6 induces astrogliosis associated with MeHg-induced microglial clusters (Eskes et al., 2002). Interestingly, as a proinflammatory factor, IL-6 may have also a neuroprotective function. IL-6 co-administered with MeHg has been shown to prevent the MeHg-induced degeneration of the neuronal cytoskeleton (Eskes et al., 2002). Similar protective effects of IL-6 against the toxic effects of glutamate have also been previously described (Yamada and Hatanaka, 1994). In contrast, astrocytic dysfunction might mediate MeHg toxicity at later stages of exposure. For example, Yin et al. reported disrupted amino acid homeostasis stemming from astrocyte-mediated MeHg toxicity (Yin et al., 2009). MeHg inhibits astrocytic glutamate uptake while stimulating glutamate efflux (Aschner et al., 1993), resulting in an excessive concentration of synaptic glutamate, which ultimately leads to neuronal excitotoxicity and cell death (Mutkus et al., 2006). Astrocytes also appear to dampen microglial activation under physiological conditions (Thomas, 1992). Therefore, MeHg-induced astrocytic dysfunction may influence microglial function at later stages of MeHg exposure.
In summary, the results presented herein demonstrate different response kinetics in astrocytes and microglia upon MeHg treatment. Microglia exhibited a faster and more robust response to MeHg compared to astrocytes. The microglial response to MeHg reflects a significantly greater accumulation of Hg in these cells vs. astrocytes, as well as a lower basal GSH pool for detoxifying ROS generated by MeHg and direct binding to MeHg itself. The faster microglia activation of Nrf2 and its downstream genes is likely related to its lower thiol status. Collectively, these studies suggest that microglia and astrocytes assume different roles on a protracted time scale, with microglia representing the early responders and astrocytes taking on a similar role at a later stage following MeHg treatment. A better understanding of the distinctive roles of these cells in mediating MeHg toxicity under in vivo conditions is clearly warranted. Indeed, additional insight gained from future studies offers tremendous promise for the identification and development of potential therapeutic modalities to ameliorate MeHg-induced CNS damage.
Acknowledgments
This study was supported by the National Institute of Environmental Health Sciences NIEHS 07331 to Dr. Michael Aschner.
References
- Akagi H, Grandjean P, Takizawa Y, Weihe P. Methylmercury dose estimation from umbilical cord concentrations in patients with Minamata disease. Environ Res. 1998;77(2):98–103. doi: 10.1006/enrs.1997.3822. [DOI] [PubMed] [Google Scholar]
- Alarcon R, Fuenzalida C, Santibanez M, von Bernhardi R. Expression of scavenger receptors in glial cells. Comparing the adhesion of astrocytes and microglia from neonatal rats to surface-bound beta-amyloid. J Biol Chem. 2005;280(34):30406–15. doi: 10.1074/jbc.M414686200. [DOI] [PubMed] [Google Scholar]
- Allen JW, Shanker G, Tan KH, Aschner M. The consequences of methylmercury exposure on interactive functions between astrocytes and neurons. Neurotoxicology. 2002;23(6):755–9. doi: 10.1016/S0161-813X(01)00076-6. [DOI] [PubMed] [Google Scholar]
- Aschner M, Du YL, Gannon M, Kimelberg HK. Methylmercury-induced alterations in excitatory amino acid transport in rat primary astrocyte cultures. Brain Res. 1993;602(2):181–6. doi: 10.1016/0006-8993(93)90680-l. [DOI] [PubMed] [Google Scholar]
- Aschner M, Eberle NB, Goderie S, Kimelberg HK. Methylmercury uptake in rat primary astrocyte cultures: the role of the neutral amino acid transport system. Brain Res. 1990;521(1–2):221–8. doi: 10.1016/0006-8993(90)91546-s. [DOI] [PubMed] [Google Scholar]
- Chang JY. Methylmercury causes glial IL-6 release. Neurosci Lett. 2007;416(3):217–20. doi: 10.1016/j.neulet.2007.01.076. [DOI] [PubMed] [Google Scholar]
- Chen W, Sun Z, Wang XJ, Jiang T, Huang Z, Fang D, Zhang DD. Direct interaction between Nrf2 and p21(Cip1/WAF1) upregulates the Nrf2-mediated antioxidant response. Mol Cell. 2009;34(6):663–73. doi: 10.1016/j.molcel.2009.04.029. [DOI] [PMC free article] [PubMed] [Google Scholar]
- Das GC, Bacsi A, Shrivastav M, Hazra TK, Boldogh I. Enhanced gamma-glutamylcysteine synthetase activity decreases drug-induced oxidative stress levels and cytotoxicity. Mol Carcinog. 2006;45(9):635–47. doi: 10.1002/mc.20184. [DOI] [PubMed] [Google Scholar]
- Dorea JG. Persistent, bioaccumulative and toxic substances in fish: human health considerations. Sci Total Environ. 2008;400(1–3):93–114. doi: 10.1016/j.scitotenv.2008.06.017. [DOI] [PubMed] [Google Scholar]
- EPA. Mercury Study Report to Congress, Office of Air Quality Planning & Standards and Office of Research and Development. Health Effects of Mercury and Mercury Compounds. 1997;V EPA-452/R-97–007. [Google Scholar]
- Eskes C, Honegger P, Juillerat-Jeanneret L, Monnet-Tschudi F. Microglial reaction induced by noncytotoxic methylmercury treatment leads to neuroprotection via interactions with astrocytes and IL-6 release. Glia. 2002;37(1):43–52. doi: 10.1002/glia.10019. [DOI] [PubMed] [Google Scholar]
- Farina M, Campos F, Vendrell I, Berenguer J, Barzi M, Pons S, Sunol C. Probucol Increases Glutathione Peroxidase-1 Activity and Displays Long-Lasting Protection Against Methylmercury Toxicity in Cerebellar Granule Cells. Toxicol Sci. 2009 doi: 10.1093/toxsci/kfp219. [DOI] [PubMed] [Google Scholar]
- Goritz C, Thiebaut R, Tessier LH, Nieweg K, Moehle C, Buard I, Dupont JL, Schurgers LJ, Schmitz G, Pfrieger FW. Glia-induced neuronal differentiation by transcriptional regulation. Glia. 2007;55(11):1108–22. doi: 10.1002/glia.20531. [DOI] [PubMed] [Google Scholar]
- Griffiths MR, Gasque P, Neal JW. The multiple roles of the innate immune system in the regulation of apoptosis and inflammation in the brain. J Neuropathol Exp Neurol. 2009;68(3):217–26. doi: 10.1097/NEN.0b013e3181996688. [DOI] [PubMed] [Google Scholar]
- Hamilton JA, Hillard CJ, Spector AA, Watkins PA. Brain uptake and utilization of fatty acids, lipids and lipoproteins: application to neurological disorders. J Mol Neurosci. 2007;33(1):2–11. doi: 10.1007/s12031-007-0060-1. [DOI] [PubMed] [Google Scholar]
- He X, Ma Q. NRF2 cysteine residues are critical for oxidant/electrophile-sensing, Kelch-like ECH-associated protein-1-dependent ubiquitination-proteasomal degradation, and transcription activation. Mol Pharmacol. 2009;76(6):1265–78. doi: 10.1124/mol.109.058453. [DOI] [PMC free article] [PubMed] [Google Scholar]
- Heggland I, Kaur P, Syversen T. Uptake and efflux of methylmercury in vitro: comparison of transport mechanisms in C6, B35 and RBE4 cells. Toxicol In Vitro. 2009;23(6):1020–7. doi: 10.1016/j.tiv.2009.06.018. [DOI] [PubMed] [Google Scholar]
- Heneka MT, Rodriguez JJ, Verkhratsky A. Neuroglia in neurodegeneration. Brain Res Rev. 2010;63(1–2):189–211. doi: 10.1016/j.brainresrev.2009.11.004. [DOI] [PubMed] [Google Scholar]
- Hernandez JM, Bui MH, Han KR, Mukouyama H, Freitas DG, Nguyen D, Caliliw R, Shintaku PI, Paik SH, Tso CL, et al. Novel kidney cancer immunotherapy based on the granulocyte-macrophage colony-stimulating factor and carbonic anhydrase IX fusion gene. Clin Cancer Res. 2003;9(5):1906–16. [PubMed] [Google Scholar]
- Hwang C, Sinskey AJ, Lodish HF. Oxidized redox state of glutathione in the endoplasmic reticulum. Science. 1992;257(5076):1496–502. doi: 10.1126/science.1523409. [DOI] [PubMed] [Google Scholar]
- Irukayama K, Kai F, Kondo T, Ushigusa S, Hashiguchi M. Consideration of the Toxicity of Methylmercuric Compounds and the Causative Agent of Minamata Disease. Nisshin Igaku Jpn J Med Prog. 1963;50:491–505. [PubMed] [Google Scholar]
- Itoh K, Wakabayashi N, Katoh Y, Ishii T, Igarashi K, Engel JD, Yamamoto M. Keap1 represses nuclear activation of antioxidant responsive elements by Nrf2 through binding to the amino-terminal Neh2 domain. Genes Dev. 1999;13(1):76–86. doi: 10.1101/gad.13.1.76. [DOI] [PMC free article] [PubMed] [Google Scholar]
- Jensen S, Jernelov A. Biological methylation of mercury in aquatic organisms. Nature. 1969;223(5207):753–4. doi: 10.1038/223753a0. [DOI] [PubMed] [Google Scholar]
- Kensler TW, Wakabayashi N. Nrf2: Friend or Foe for Chemoprevention? Carcinogenesis. 2009 doi: 10.1093/carcin/bgp231. [DOI] [PMC free article] [PubMed] [Google Scholar]
- Konig J, Nies AT, Cui Y, Leier I, Keppler D. Conjugate export pumps of the multidrug resistance protein (MRP) family: localization, substrate specificity, and MRP2-mediated drug resistance. Biochim Biophys Acta. 1999;1461(2):377–94. doi: 10.1016/s0005-2736(99)00169-8. [DOI] [PubMed] [Google Scholar]
- Kuhlmann AC, Guilarte TR. Cellular and subcellular localization of peripheral benzodiazepine receptors after trimethyltin neurotoxicity. J Neurochem. 2000;74(4):1694–704. doi: 10.1046/j.1471-4159.2000.0741694.x. [DOI] [PubMed] [Google Scholar]
- LaDu MJ, Shah JA, Reardon CA, Getz GS, Bu G, Hu J, Guo L, van Eldik LJ. Apolipoprotein E receptors mediate the effects of beta-amyloid on astrocyte cultures. J Biol Chem. 2000;275(43):33974–80. doi: 10.1074/jbc.M000602200. [DOI] [PubMed] [Google Scholar]
- Li W, Kong AN. Molecular mechanisms of Nrf2-mediated antioxidant response. Mol Carcinog. 2009;48(2):91–104. doi: 10.1002/mc.20465. [DOI] [PMC free article] [PubMed] [Google Scholar]
- Long TC, Tajuba J, Sama P, Saleh N, Swartz C, Parker J, Hester S, Lowry GV, Veronesi B. Nanosize titanium dioxide stimulates reactive oxygen species in brain microglia and damages neurons in vitro. Environ Health Perspect. 2007;115(11):1631–7. doi: 10.1289/ehp.10216. [DOI] [PMC free article] [PubMed] [Google Scholar]
- Monnet-Tschudi F, Zurich MG, Pithon E, van Melle G, Honegger P. Microglial responsiveness as a sensitive marker for trimethyltin (TMT) neurotoxicity. Brain Res. 1995;690(1):8–14. doi: 10.1016/0006-8993(95)00509-o. [DOI] [PubMed] [Google Scholar]
- Morken TS, Sonnewald U, Aschner M, Syversen T. Effects of methylmercury on primary brain cells in mono- and co-culture. Toxicol Sci. 2005;87(1):169–75. doi: 10.1093/toxsci/kfi227. [DOI] [PubMed] [Google Scholar]
- Mullaney KJ, Fehm MN, Vitarella D, Wagoner DE, Jr, Aschner M. The role of -SH groups in methylmercuric chloride-induced D-aspartate and rubidium release from rat primary astrocyte cultures. Brain Res. 1994;641(1):1–9. doi: 10.1016/0006-8993(94)91808-2. [DOI] [PubMed] [Google Scholar]
- Mullaney KJ, Vitarella D, Albrecht J, Kimelberg HK, Aschner M. Stimulation of D-aspartate efflux by mercuric chloride from rat primary astrocyte cultures. Brain Res Dev Brain Res. 1993;75(2):261–8. doi: 10.1016/0165-3806(93)90030-e. [DOI] [PubMed] [Google Scholar]
- Mutkus L, Aschner JL, Syversen T, Shanker G, Sonnewald U, Aschner M. Mercuric chloride inhibits the in vitro uptake of glutamate in GLAST- and GLT-1-transfected mutant CHO-K1 cells. Biol Trace Elem Res. 2006;109(3):267–80. doi: 10.1385/BTER:109:3:267. [DOI] [PubMed] [Google Scholar]
- Ni M, Aschner M. Neonatal Rat Primary Microglia: Isolocation, Culturing and Selected Applications. Current Protocol in Toxicology(12.17) 2010;16 doi: 10.1002/0471140856.tx1217s43. [DOI] [PMC free article] [PubMed] [Google Scholar]
- Ni M, Li X, Yin Z, Jiang H, Sidoryk-Wegrzynowicz M, Milatovic D, Cai J, Aschner M. Methylmercury Induces Acute Oxidative Stress, Altering Nrf2 Protein Level in Primary Microglial Cells. Toxicol Sci Epub April. 2010;26 doi: 10.1093/toxsci/kfq126. [DOI] [PMC free article] [PubMed] [Google Scholar]
- Prestera T, Holtzclaw WD, Zhang Y, Talalay P. Chemical and molecular regulation of enzymes that detoxify carcinogens. Proc Natl Acad Sci U S A. 1993;90(7):2965–9. doi: 10.1073/pnas.90.7.2965. [DOI] [PMC free article] [PubMed] [Google Scholar]
- Prestera T, Talalay P. Electrophile and antioxidant regulation of enzymes that detoxify carcinogens. Proc Natl Acad Sci U S A. 1995;92(19):8965–9. doi: 10.1073/pnas.92.19.8965. [DOI] [PMC free article] [PubMed] [Google Scholar]
- Sakamoto M, Miyamoto K, Wu Z, Nakanishi H. Possible involvement of cathepsin B released by microglia in methylmercury-induced cerebellar pathological changes in the adult rat. Neurosci Lett. 2008;442(3):292–6. doi: 10.1016/j.neulet.2008.07.019. [DOI] [PubMed] [Google Scholar]
- Tamm C, Duckworth J, Hermanson O, Ceccatelli S. High susceptibility of neural stem cells to methylmercury toxicity: effects on cell survival and neuronal differentiation. J Neurochem. 2006;97(1):69–78. doi: 10.1111/j.1471-4159.2006.03718.x. [DOI] [PubMed] [Google Scholar]
- Thomas WE. Brain macrophages: evaluation of microglia and their functions. Brain Res Brain Res Rev. 1992;17(1):61–74. doi: 10.1016/0165-0173(92)90007-9. [DOI] [PubMed] [Google Scholar]
- Verkhratsky A. Physiology of neuronal-glial networking. Neurochem Int. 2010 doi: 10.1016/j.neuint.2010.02.002. [DOI] [PubMed] [Google Scholar]
- Vernadakis A. Neuron-glia interrelations. Int Rev Neurobiol. 1988;30:149–224. [PubMed] [Google Scholar]
- Wang L, Jiang H, Yin Z, Aschner M, Cai J. Methylmercury toxicity and Nrf2-dependent detoxification in astrocytes. Toxicol Sci. 2009;107(1):135–43. doi: 10.1093/toxsci/kfn201. [DOI] [PMC free article] [PubMed] [Google Scholar]
- Wang Z, Li DD, Liang YY, Wang DS, Cai NS. Activation of astrocytes by advanced glycation end products: cytokines induction and nitric oxide release. Acta Pharmacol Sin. 2002;23(11):974–80. [PubMed] [Google Scholar]
- Yamada M, Hatanaka H. Interleukin-6 protects cultured rat hippocampal neurons against glutamate-induced cell death. Brain Res. 1994;643(1–2):173–80. doi: 10.1016/0006-8993(94)90023-x. [DOI] [PubMed] [Google Scholar]
- Yin Z, Albrecht J, Syversen T, Jiang H, Summar M, Rocha JB, Farina M, Aschner M. Comparison of alterations in amino acids content in cultured astrocytes or neurons exposed to methylmercury separately or in co-culture. Neurochem Int. 2009;55(1–3):136–42. doi: 10.1016/j.neuint.2009.01.015. [DOI] [PMC free article] [PubMed] [Google Scholar]
- Yin Z, Jiang H, Syversen T, Rocha JB, Farina M, Aschner M. The methylmercury-L-cysteine conjugate is a substrate for the L-type large neutral amino acid transporter. J Neurochem. 2008;107(4):1083–90. doi: 10.1111/j.1471-4159.2008.05683.x. [DOI] [PMC free article] [PubMed] [Google Scholar]
- Yin Z, Milatovic D, Aschner JL, Syversen T, Rocha JB, Souza DO, Sidoryk M, Albrecht J, Aschner M. Methylmercury induces oxidative injury, alterations in permeability and glutamine transport in cultured astrocytes. Brain Res. 2007;1131(1):1–10. doi: 10.1016/j.brainres.2006.10.070. [DOI] [PMC free article] [PubMed] [Google Scholar]
- Yuan Y, Atchison WD. Methylmercury-induced increase of intracellular Ca2+ increases spontaneous synaptic current frequency in rat cerebellar slices. Mol Pharmacol. 2007;71(4):1109–21. doi: 10.1124/mol.106.031286. [DOI] [PubMed] [Google Scholar]