Punctate fluorescein staining is an important sign in ocular surface disease but its basis is controversial. The common view is that the spots reflect small epithelial defects. In this study, clinicocytologic and histopathologic correlation of punctate stains in dry eye disease was performed. The hyperfluorescent spots were traced from slit lamp examination to confocal microscopy of tissue to reveal that fluorescent superficial epithelial cells are basis of punctate staining.
Abstract
Purpose.
The basis of fluorescein-associated superficial punctate staining in dry eyes is controversial. Prior explanations include fluorescein pooling in surface erosive defects, intercellular trapping of fluorescein, and intracellular staining in dead cells. In this study, the hypothesis that punctate erosions are individual cells with enhanced fluorescence was tested.
Methods.
Ten impression cytology membrane materials were compared, to optimize cellular yield in buccal mucosa and cornea. Clinicocytologic correlation of punctate fluorescent spots was performed in four dry eye patients. Individual punctate spots were localized by fiducial marks in photographs, before and after removal with impression membranes, and were traced in fluorescence microscopy and cytologic staining. Two-way contingency table analysis was used to determine the correlation of punctate spots with cells removed by the membrane. Clinicopathologic correlation of punctate spots was performed in 10 corneas removed in dry eye patients by transplantation for concurrent diseases. Punctate fluorescence was tracked in specimens by fiducial marks and epifluorescence. The distribution of fluorescent spots in specific cell layers of the cornea was determined by confocal microscopy.
Results.
Cellular yield was greatest with impressions from polytetrafluoroethylene (PTFE [Teflon]; BioPore; Millipore, Billerica, MA) membrane compared with its closest rival (P = 0.019). Punctate fluorescent spots, most of which disappeared after impression cytology (71%), correlated with cells on the membranes (P = 0.009). The punctate spots were more frequent in the superficial cell layers of the cornea (80%) compared with the deepest two layers (0%) (P < 0.00049).
Conclusions.
Punctate epithelial erosions correspond to enhanced fluorescence in epithelial cells predominantly in superficial layers of the cornea and would be more aptly named fluorescent epithelial cells (FLECs).
Definitions of dry eye and estimation of the severity often include the quantity and distribution of fluorescent punctate stains of the cornea.1–3 The phenomenon, superficial punctate fluorescence, is found in apparently normal subjects,4–8 contact lens wearers,9,10 and dry eyes.11–14 Synonymous terms, such as punctate epithelial erosions and punctate epithelial defects, imply loss of epithelial cells, but the anatomic basis is controversial and unproven.6,15,16
Punctate staining can be transient, appearing and disappearing over a matter of hours.17,18 Superficial punctate staining can be reduced by a high-humidity atmosphere, punctal plugging, artificial tears, and anti-inflammatory treatments.9,19–25 There is a strong correlation between the distribution of punctate stains in both eyes of a single individual, suggesting a systemic or environmental etiology, rather than a strictly local cause.18,19 Smoking, hormone changes, and medications have all been linked to changes in punctate corneal staining.26–29
The main hypothesis for punctate staining has several components. First, intercellular gaps, created by loss of tight junction integrity allow deep penetration and trapping of fluorescein between cells6,18,30–33; second, fluorescein stains desquamating, damaged, or dead cells19,30,34,35; third, surface irregularities or defects left by an absence of cells cause fluorescein to pool in punctate areas.13,18,36–39 However, irrigation does not easily remove the fluorescent punctate stains, and so pooling over surface irregularities is unlikely.40,41
Studies in rabbits and humans suggest that both living and dead cells take in fluorescein, although not all cells with fluorescein uptake are visible under the slit lamp microscope.35,42,43 The evidence that uptake is intracellular was based solely on the size and shape of the fluorescein staining spots, because organelle stains were not used.35,40
The goal of this study was to investigate the cellular basis of punctate staining by using confocal microscopy in conjunction with optimized impression cytology techniques.
Methods
Subject Enrollment
This study was performed in accordance with the Institutional Review Board of the University of California, Los Angeles. Written informed consent was obtained from all subjects involved, after explanation of the nature and possible consequences of the study. The research adhered to the tenets of the Declaration of Helsinki.
All prospective subjects completed a dry eye examination including an Ocular Surface Disease Index Questionnaire,44 slit lamp examination with conjunctival rose bengal and corneal fluorescein staining, determination of tear break-up time, and Schirmer's test with anesthesia. Dry eye severity was defined by the DEWS criteria.1
For experiments to lift punctate stains by corneal impression cytology, six patients were enrolled: age range, 49 to 74 years; three men and three women, all with a dry eye severity grade of at least 3. For the confocal microscopic localization of punctate stains in corneal specimens, 10 subjects were enrolled: age range, 49 to 91 years; seven men and three women, with dry eye severity grades from 2 to 4. The clinical diagnoses were corneal scar (three patients) and corneal graft failure (seven patients).
Impression Cytology Membrane Calibration for Cell Removal from Buccal Mucosa
Buccal mucosa impression cytology was performed on two healthy volunteers to test cell retrieval with different membranes. Ten impression materials were chosen for experiments (Table 1) based on a literature review. The pore sizes of 0.4 to 0.45 μm were selected for synthetic membranes to obtain a high cellular yield without compromised cellular morphology.45,46
Table 1.
Impression Cytology Membrane Identifiers and Properties
| Membrane (Alternate Names), Company | Pore Size (μm) | Porosity (%) | Thickness |
|---|---|---|---|
| Glass (German Glass), EMS* | NA† | NA | 160–190 μm |
| Cellulose acetate plastic (CA plastic), EMS | NA | NA | 1570 μm |
| Rinzl (clear vinyl), EMS | NA | NA | 280 μm |
| Thermanox (TMX, polyolefin polymer), EMS | NA | NA | 200 μm |
| Polycarbonate (Isopore), Millipore | 0.4 | 5–20 | 7–22 μm |
| Polyvinylidene fluoride (PVDF, Durapore), Millipore | 0.45 | 75 | 125 μm |
| Polyethersulfone (PES, Express PLUS), Millipore | 0.45 | 60–80 | 130–155 μm |
| Polytetrafluoroethylene (PTFE, Omnipore, Biopore, Teflon), Millipore | 0.45 | 80 | 65 μm |
| Mixed cellulose ester (MCE, MF filter), Millipore | 0.45 | 79 | 180 μm |
| Surfactant-free mixed cellulose ester (SF MCE, Immobilon-NC membrane, Triton-free), Millipore | 0.45 | 79 | 180 μm |
Electron Microscopy Sciences (EMS, Hatfield, PA) and Millipore (Billerica, MA).
Coverslip materials not characterized by pore sizes or hydrophilicity (NA).
From each subject repeated impression samples were taken from nonoverlapping areas of the buccal mucosa. Each membrane was placed against the buccal mucosa with sterile forceps for 3 to 5 seconds, removed, and immediately fixed in 95% ethanol. The membranes were subsequently stained with hematoxylin and eosin and immediately mounted and coverslipped.
The cells were counted by light microscopy at 400× magnification. A coverslip with a photoetched grid pattern of 600-μm squares (Electron Microscopy, Hatfield, PA) was used to calculate mean cellular yield per unit area.
Impression Cytology Membrane Calibration for Cell Removal from Corneas
The four membranes with the greatest cellular yield in the buccal mucosa experiments (polycarbonate, PVDF, polyethersulfone, and PTFE) were used in impressions of normal corneas. Impression cytology was performed four times for each membrane on two eyes of a healthy volunteer to determine whether cellular yield of buccal mucosa correlates with the cellular yield of normal cornea. Each membrane was gently placed against the cornea with sterile forceps for three to five seconds and subsequently lifted and immediately air dried for fixation. The membranes were subsequently stained with an aqueous staining solution (Diff Quik; Richard Allan Scientific, Kalamazoo, MI) and immediately mounted and coverslipped.
Tracking Punctate Spots Lifted from Dry Eye Patients by Impression Cytology
To test the hypothesis that punctate spots are fluorescein stained superficial cells, PTFE membranes were applied to 108 punctate fluorescent spots in four patients with dry eye syndrome.
Fluorescein punctate stains observed by slit lamp examination were photographed. A PTFE membrane strip was applied with sterile forceps to an area with punctate spots for 3 to 5 seconds. The membrane was removed, and the cornea was rephotographed under cobalt blue light. Another drop of fluorescein was then instilled, and the eye was reimaged. The impressed membrane was air dried and examined by epifluorescence microscopy (Fluoview Fv1000a microscope with 10× objective, UMNIBA3 narrow IF blue filter, excitation bandpass filter 470–490 nm, emission bandpass filter BA 510–550, dichroic mirror 505; Olympus, Lake Success, NY). The membrane was then stained and mounted in aqueous medium as described earlier (Diff-Quik; Richard Allan Scientific). Air drying permitted visualization of fluorescent cells by epifluorescence microscopy.
Individual punctate spots were localized to the membranes by aligning patient landmarks on digital images with the fiducial marks on the membrane.
Confocal Microscopy Three-Dimensional Localization of Punctate Spots in Cornea Specimens
Ten corneas removed from transplant patients with punctate keratopathy and dry eye syndrome were examined by confocal microscopy. Fifteen punctate spots were individually examined.
Fluorescein dye was applied to the cornea immediately before the surgery and photographed. The cornea was carefully hydrated with balanced salt solution (BSS; Alcon, Fort Worth, TX). A peripherally placed 10-0 nylon suture served as a fiducial. Time from fluorescein installation to removal of cornea tissue was less than 15 minutes. The corneal button was placed in 0.3 to 1.0 mL of a tear mimetic buffer (10 mM Tris buffer [pH 7.3], 130 mM NaCl, 24 mM KCl, 0.8 mM, CaCl2, and 0.61 mM MgCl2) and transported to the laboratory on ice within 3 minutes.
The corneal button was oriented under a blue light with a stereomicroscope and carefully bisected so that the punctate spots on the cornea could be viewed in a customized chamber, both en face and in cross section. Fluorescent punctate spots were imaged with a confocal laser scanning microscope equipped with emission dichroic mirrors for each laser and a galvanometer diffraction grating for 2-nm wavelength emission resolution (Fluoview FV1000a; Olympus). The cornea was counterstained with DAPI, propidium iodide, or a red nucleic acid stain (Syto 61; Invitrogen, Carlsbad, CA) for 6 minutes and washed six times in tear mimetic buffer. The area of interest was sequentially scanned at λex /λem = 488/519 nm (fluorescein), 405/461 nm (DAPI) 559/619 nm (propidium iodide), and 635/645 nm (Syto 61). The scanned images were manipulated with image-analysis software (for cellular fluorescein localization; Volocity or Fluoview software; Olympus).
Fluorescein Staining and Photography
A wet fluorescein strip containing 0.6 mg of dye (Ful-Glo strip; Akorn Pharmaceuticals, Inc., Buffalo Grove, IL) was applied to the inferior fornix, according to the manufacturer's instructions. After 3 minutes, the cornea was photographed under a cobalt blue light source (BQ900; Haag Streit, Köniz, Switzerland) at 10× to 16× magnification. Manual camera settings for slit lamp or operating microscope photography were ISO 100, 1/8, F2.9, VR, tungsten light, no flash, fine 13 m, 2-second delay, yellow gel filter no. 312 (Coolpix p6000; Nikon, Tokyo, Japan), with a slit lamp adapter (Zarf Enterprises, Spokane, WA). Camera settings for macro photography without the slit lamp were identical, except a macro close-up setting and yellow filter were used (Wratten 12; Eastman Kodak, Rochester, NY).
Statistical Analysis
Comparison of cellular yield for various impression cytology membranes was performed with a Student's two tailed t-test. To determine whether punctate spots on the cornea that disappeared with impression cytology correlated to cells observed at expected locations on the membrane, a two-way contingency table was constructed and analyzed by Fisher's exact test. The distribution of punctate spots in the five layers of corneal epithelium was analyzed with the sign test under the hypothesis that punctate spots would distribute equally in the superficial versus the lower layers, with a population median in cell layer three.
Results
Cellular Yield Comparison on Membranes of Varied Composition
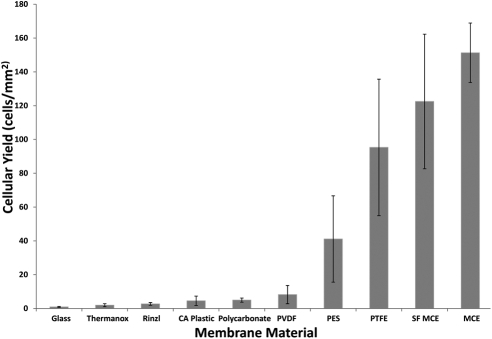
Cellular yield from the buccal mucosa varied with membrane composition (Fig. 1). Mixed cellulose ester membranes and PTFE showed the greatest yield. Coverslip materials yielded the fewest cells. There were statistically significant differences in yield between most membranes (Table 2).
Figure 1.
Cells per unit area of various membranes from impression cytology of buccal mucosa. The data represent the mean (±SD) cellular yield from seven independent experiments. Statistical results are shown in Table 2.
Table 2.
P Values Comparing Cellular Yield from Buccal Mucosa for Various Membranes in Figure 1
| Membrane (Cellular Yield Means) | Thermanox | Rinzl | CA Plastic | Polycarbonate | PVDF | PES | PTFE | SF MCE | MCE (151.3 cells/mm2) |
|---|---|---|---|---|---|---|---|---|---|
| Glass (0.96 cells/mm2) | 0.0156 | 0.0009 | 0.004 | 0.0001 | 0.003 | 0.001 | 0.0002 | 9 × 10⁻⁵ | 3 × 10⁻⁵ |
| Thermanox (1.95 cells/mm2) | 0.149 | 0.023 | 0.001 | 0.007 | 0.002 | 0.0002 | 9 × 10⁻⁵ | 3 × 10⁻⁵ | |
| Rinzl (2.72 cells/mm2) | 0.080 | 0.008 | 0.013 | 0.002 | 0.0003 | 9 × 10⁻⁵ | 3 × 10⁻⁵ | ||
| CA Plastic (4.54 cells/mm2) | 0.856 | 0.090 | 0.003 | 0.0003 | 0.0001 | 3 × 10⁻⁵ | |||
| Polycarbonate (4.96 cells/mm2) | 0.092 | 0.003 | 0.0003 | 0.0001 | 3 × 10⁻⁵ | ||||
| PVDF (8.22 cells/mm2) | 0.005 | 0.0004 | 0.0001 | 4 × 10⁻⁵ | |||||
| PES (41.13 cells/mm2) | 0.009 | 0.001 | 0.0001 | ||||||
| PTFE (95.31 cells/mm2) | 0.264 | 0.040 | |||||||
| SF MCE (122.5 cells/mm2) | 0.312 |
The membranes differed in handling and staining characteristics. Mixed cellulose ester membranes were stiff and fragile, which made them difficult to cut into small sizes. Polycarbonate membranes clung to the mucosal surface, which resulted in more uniform and consistent apposition of all areas to surfaces. After staining, the coverslips remained transparent, whereas synthetic membranes varied in background intensity. The two cellulose ester membranes stained very darkly with Giemsa and hematoxylin, thereby complicating staining and analysis by light microscopy.
Coverslip materials (low yield) and mixed cellulose ester membranes (dark staining) were excluded from subsequent experiments that compared cellular yield from the corneal surface.
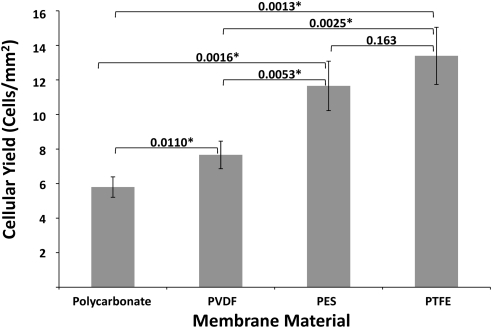
The results for comparison of cellular yield from polycarbonate, PVDF, polyethersulfone, and PTFE membranes on normal corneas are shown in Figure 2. PTFE provided the greatest cellular yield, followed by polyethersulfone, PVDF, and polycarbonate. The relative order was the same as that found with buccal mucosa. PTFE had both minimum background staining and excellent cellular yield and was considered optimal for the clinicocytologic correlation of punctate spots.
Figure 2.
Cells per unit area of various membranes from impression cytology of control corneas. The data represent the mean (±SD) cellular yield from four independent experiments. P values from cellular yield comparisons, by Student's t-test, appear above the brackets. *P < 0.05.
Impression Cytology from Dry Eye Patients with Punctate Fluorescein Staining
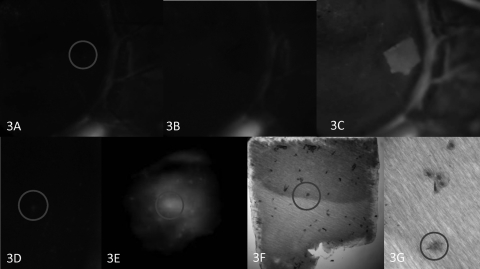
Impression cytology on corneas using PTFE membranes successfully lifted 81 of the 108 punctate fluorescent spots tested in four patients (Table 3). An example is shown in Figure 3. After impression cytology, fluorescein was reapplied to the cornea, and a fluorescein staining membrane outline was observed that matched the size and shape of the membrane (Fig. 3C). This outline provided fiducials for tracking membrane–ocular surface contact positions by light microscopy. A magnified view of the membrane in the position of the original punctate stain revealed a single cell (Fig. 3G).
Table 3.
Two-Way Contingency Table Correlating a Punctate Stain to a Cell at a Precise Location
| Punctate Stain Removed by Impression Cytology | Punctate Stain Not Removed by Impression Cytology | |
|---|---|---|
| Cell present on membrane | 77 | 21 |
| Cell not present on membrane | 4 | 6 |
Figure 3.
Impression cytology of a punctate spot. (A) Clinical photograph of limbal area exhibits a hyperfluorescence spot, encircled. Linear limbal fluorescence provided fiducials. (B) Disappearance of the punctate spot after impression cytology. (C) After repeat instillation of fluorescein, a hyperfluorescent outline of the membrane remains. (D) Enlargement of the punctate spot encircled in (A) and the corresponding spot on the impression membrane, viewed with epifluorescence (E). The hyperfluorescent spot localized to a cell (circle) after rapid, air-dried staining of the membrane (F), which features less distinct cytoplasmic and nuclear borders than do the adjacent cells (G). Original magnification: (A–D) ×10; (E, F) ×100; (G) ×400.
The two-way contingency table permitted statistical correlation of the clinically identified spots with the cells on the cytology membrane (Table 3). Punctate spots that disappeared from the cornea after membrane impression positively correlated with cells in the expected positions cytologically (P = 0.015). Of the 81 lifted punctate spots, 77 could be traced to a particular cell on the membrane. Only four of the spots that disappeared were not correlated to cells. Twenty-one spots remained on the cornea after membrane cytology, but cells could still be identified in the location of the original punctate stains. Six punctate spots remained on the cornea after impression, and no cells were identified in the expected location on the membrane. Impression membranes, however, failed to remove 27 of the 81 punctate fluorescein spots, raising the possibility of a location inaccessible to the membrane.
Removal of Deep Epithelial Punctate Fluorescent Spots by Impression Cytology
The hypothesis that the spots remaining after membrane cytology are deep in the epithelium was tested by extending the time the membrane contacted the cornea to remove multilayered sheets of epithelium. In two dry eye patients, the membrane was applied for approximately 20 to 30 seconds, which created some areas where multiple epithelial cell layers were removed (Figs. 4, 5). In these areas, 55 (100%) punctate spots were removed by impression cytology. In other areas, where only one cell layer was removed, 27% of the spots disappeared. Thus, removal of multiple cell layers of epithelium correlated with the removal of all punctate spots (P < 0.0001).
Figure 4.
Complete loss of punctate spots in an area of multicell layer removal. Clinical photograph of fluorescein staining with the membrane outlined in red (A). Clinical photograph after impression cytology (B). Appearance after repeat fluorescein instillation showing intense staining in the area where multiple layers of epithelial cells were removed and less intense staining superiorly outlining the remaining sites of membrane contact (C). Results after rapid staining are shown in Figure 5. Original magnification, ×16.
Figure 5.
Rapid-stained membrane contained an area where multiple epithelial cell layers were removed (corresponding to Fig. 4, clinical photographs). Magnification: (A) ×40; (B) ×100; (C, D) ×400.
Confocal Microscopy of Punctate Fluorescent Spots after Penetrating Keratoplasty
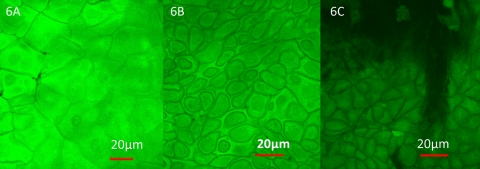
Fluorescein dye, applied before surgery, was retained within cells after corneal transplantation. This fortuitous observation permitted visualization of the corneal epithelial cellular architecture by confocal microscopy of the specimen. Fluorescein dye appeared to penetrate most epithelial cells. Relative negative staining of intercellular spaces and nuclei revealed the distinctive corneal cytoarchitecture that allowed three-dimensional localization (Fig. 6).
Figure 6.
Axial confocal microscopy of cornea. Control corneal button, without clinical punctate staining. Confocal z-stack scans were taken at various depths from the surface: (A) 5 μm; (B) 25 μm; (C) 45 μm. Original magnification, ×600.
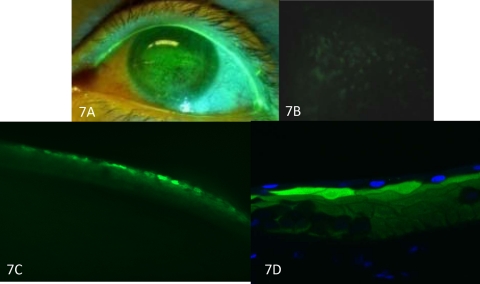
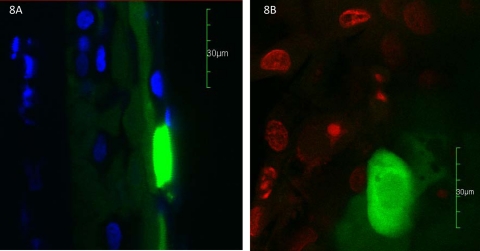
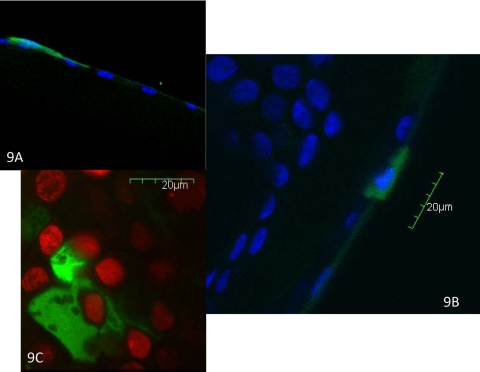
Areas of more intense fluorescence localized to the same position as the fluorescent punctate spots seen clinically. The intense fluorescence of the punctate spots appeared to be within the cytoplasm of the epithelial cells (Figs. 7). Nuclei were often seen as a relatively hypointense area within these cells and in some cases were not visible (Fig. 8). The spots were also identified via confocal microscopy after nuclear staining (Fig. 9). The three-dimensional reconstruction from cross-sectional and axial scans for 15 punctate fluorescence spots showed that 7 (47%) spots distributed to the superficial most layer of the cornea. Five (33%) punctate spots localized to the second layer of superficial cells, and three (20%) localized to the first wing cell layer. None was found in the two most basal layers. The predilection for distribution in the superficial epithelial layers was significant (P < 0.00049).
Figure 7.
Confocal microscopy of punctate spots. Clinical photograph of punctate spots immediately before corneal transplantation (A). Epifluorescence photograph of the corneal button demonstrates punctate stains. Preoperative fluorescein was still present in the tissue (B). Punctate staining of cornea in cross section (C). After DAPI staining, punctate stains appeared in the second cell layer (D). Original magnification: (A) none; (B) ×100; (C) ×100; (D) ×600.
Figure 8.
Confocal microscopy images of punctate staining. Cross section of punctate stain with DAPI nuclear staining (A). Axial view of punctate stain with nuclear staining (red; B). Original magnification, ×600.
Figure 9.
Confocal microscopy of punctate staining cells. Nucleus stained with DAPI (A, B) or propidium iodide (C). Original magnification, ×600.
Discussion
This study had two key findings. First, cellular yield in impression cytology is highly membrane dependent, with PTFE membranes providing the highest cellular yield while retaining cytologic visibility after staining. Second, fluorescent punctate spots in the cornea in dry eye disease derive from fluorescein within the cytoplasm of cells in the superficial epithelial layers.
Impression Cytology
Studies of ocular surface impression cytology have explored various materials from cellophane tape and photographic film to various synthetic filters (Duralon; Polyvic and Mitex; both by Millipore), plastic or glass coverslips and even glue.47–53 Some studies of cellular yield by membranes are limited to a single membrane material and only give semiquantitative information, such as cell coverage,45,46 in regard to pore size. Another compared two types of membranes but did not provide a standard measure such as cells per unit area.54 Although Biopore (Omnipore, Teflon PTFE; Millipore) has been touted as the optimal membrane for cytology, a direct statistical comparison of cellular yield with a large panel of membranes is lacking.55,56
One of the rare reports of quantitative cell yield compared three different plastic membrane materials in patients with conjunctivitis.51 The results showed more cells lifted per square millimeter with autofluorescence coverslips (1.3 ± 0.37; Thermanox; EMS, Hatfield, PA) than plastic polyethylene terephthalate (0.79 ± 0.24) and plastic cellulose acetate (CA) membranes (0.76 ± 0.28). By comparison, we found a similar yield for Thermanox and slightly more for CA (Fig. 1) from buccal mucosa. The difference may be attributable to differences in impression technique and the large number of inflammatory cells in their samples from inflamed conjunctiva. In any case the yield was significantly lower than with PTFE.
The four membranes identified from the buccal mucosa cytology experiments as optimal gave similar cell yields in the cornea. One exception is that the difference between PTFE and polyethersulfone was not statistically significant in the cornea but was statistically significant in the buccal mucosa. This result may reflect the small sample size for the cornea.
The effect of membrane pore size,45,46 presence or absence of surfactant,46,57,58 and directionality (dull versus shiny side) of membranes59 (Yoshiaki K, et al. IOVS 1991;32:ARVO Abstract 342) on cytologic characteristics have been compared. The low yield of polycarbonate is not explained by pore size (0.4 μm) but may be related to the density of the pores (porosity Table 1). Polycarbonate membranes have been used as an alternative to mixed cellulose esters,43 specifically for air-dried rapid stains (Diff Quik; Richard Allen Scientific) because there is less background color, but cellular yield was reported to be lower.43
The effect of surfactant on cellular yield has been controversial.46,57,58 One membrane used in this series was a surfactant-free membrane (SF MCE), but it showed no statistically significant difference in cellular yield compared with the surfactant-containing alternative (MCE).
Cellulose acetate membrane has been compared with PTFE for ease of application to the conjunctiva. The thin PTFE membrane has been noted to roll during specimen collection.54 In the present study, we found flexibility of PTFE advantageous to apply to the corneal surface but the stiffness of cellulose ester membranes and coverslip materials vitiated uniform contact.
Impression cytology has been used in several different applications. PTFE membranes are preferred for immunohistochemistry, ELISA, and the study of neoplasms of the ocular surface.53,60–62 Issues of cost have led some investigators to consider other alternatives—for example, glass slides—as a more cost-effective way of performing impression cytology.50 The focus of this study was quantitative differences of cellular yield. However, the choice of membrane must ultimately be tailored to the specific application and situation.
Punctate Staining
Similar to previous work, most corneal epithelial cells showed uptake of fluorescein (Fig. 6).43 With the slit lamp equipped with cobalt blue filters, only brightly stained cells were discernible as punctate spots. The fluorescence intensity of the punctate spots permitted tracking of the isolated cells. Although some punctate spots were removed with impression cytology, some spots remained, suggesting an origin from a deeper epithelial layer that was inaccessible to the membrane. This notion is supported by the observation that longer residence time of the membrane resulted in lifting more layers of the epithelium and more punctate spots.
However, some punctate spots disappeared after membrane impression, but could not be traced to the corresponding locations on the membrane. Possible explanations include poor adherence to the membrane during the application, dislodgement of cells during membrane fixation and staining, disruption of intact cells, or diffusion of the dye. Alternatively, this minority of fluorescent punctate spots may not originate from cells.
One might argue that punctate staining cells are exfoliating epithelia that are more easily collected by the membrane, especially in light of the morphologic appearance of some lifted cells (Fig. 3G). However, punctate stained cells were not the only cells removed; more than half of the cells removed were not related to punctate spots. Furthermore, many punctate spots could not be removed by impression cytology. A fluorescent cell in the second or third cell layers would not be accessible to the membrane. Other evidence against punctate spots as exfoliating cells is the lack of disappearance with irrigation.40,41
The presence of concurrent corneal diseases of these transplant specimens was a clear but unavoidable limitation of this study. Seven of 10 of the transplanted corneas had concomitant bullous keratopathy, which is known to have pronounced exfoliation of epithelium.63 Since the distribution of staining in these cases showed fluorescence in the deeper layers of epithelium it is likely that exfoliation does not account for the spots.
Fluorescent punctate spots cannot be attributed to deposition of fluorescein in intercellular spaces because of the relative negative staining of the intercellular spaces (Fig. 6). Punctate spots were localized to the epithelium in every case. Specifically, the cells distributed to the first three cell layers. Thus, superficial and wing cells are the cells responsible for punctate spots. Although similar data are not available in humans, others have demonstrated that fluorescein stains normal rabbit corneal epithelial cells and that punctate spots are the size and shape of epithelial cells.35,40
Localization of the punctate spot constitutes the first step in determining the etiology. The greater intensity of fluorescence may reflect differences in the intracellular concentration of fluorescein or fluorescence lifetime. Since high concentrations of fluorescein can result in self-quenching,15,32,64 the relative intensity of the punctate staining may not reflect an increased concentration.
An abnormal epithelial cell, such as a cell undergoing apoptosis with loss of membrane integrity, could interact differently with fluorescein than might the surrounding cells. Alternatively, an external factor, such as a mucin defect could result in loss of a protective barrier.65–67 Mucin abnormalities have been linked with corneal punctate staining in atopic disease.68 MUC1 and -16 are produced by superficial epithelial cells, a location consistent with the topographic distribution of punctate spots in our data.63,66,69 Conjunctival expression of MUC16 is reduced in dry eye.70 Breaches in the MUC16 glycocalyx are found in bullous keratopathy63; identical histologic findings are reported with concomitant dry eye disease.71 A rendition of punctate spots can be created by impression cytology, possibly by removal of mucins.43 Alternatively, the membrane impression technique may disrupt cells. Further study of this model is needed.
Punctate staining is an important sign of dry eye disease and ocular surface irritation. These fluorescent spots have been considered toxic,72–74 infiltrative, and even infectious events.74,75 Compromised tight junction integrity,6,35 increased epithelial permeability,76 and cell death have been invoked as causes.34,39 Because in this study the so-called punctate epithelial erosions corresponded to enhanced fluorescence in superficial epithelial cells of the cornea, the simple term fluorescent epithelial cells (FLECs) seems more suitable. In any case, the pathophysiologic events leading to the hyperfluorescence of these cells can now be the cynosure.
Footnotes
Supported by National Institutes of Health (NIH) Grant EY11224, The Edith and Lew Wasserman Endowed Professorship in Ophthalmology, and NIH Grant T32 EY007026.
Disclosure: M. Mokhtarzadeh, None; R. Casey, None; B.J. Glasgow, None
References
- 1. The definition and classification of dry eye disease: report of the Definition and Classification Subcommittee of the International Dry Eye WorkShop. (2007). Ocul Surf. 2007;5:75–92 [DOI] [PubMed] [Google Scholar]
- 2. Behrens A, Doyle JJ, Stern L, et al. Dysfunctional tear syndrome: a Delphi approach to treatment recommendations. Cornea. 2006;25:900–907 [DOI] [PubMed] [Google Scholar]
- 3. Vitali C, Bombardieri S, Jonsson R, et al. Classification criteria for Sjogren's syndrome: a revised version of the European criteria proposed by the American-European Consensus Group. Ann Rheum Dis. 2002;61:554–558 [DOI] [PMC free article] [PubMed] [Google Scholar]
- 4. Korb DR, Korb JM. Corneal staining prior to contact lens wearing. J Am Optom Assoc. 1970;41:228–232 [PubMed] [Google Scholar]
- 5. Korb DR, Herman JP. Corneal staining subsequent to sequential fluorescein instillations. J Am Optom Assoc. 1979;50:361–367 [PubMed] [Google Scholar]
- 6. Norn MS. Micropunctate fluorescein vital staining of the cornea. Acta Ophthalmol (Copenh). 1970;48:108–118 [DOI] [PubMed] [Google Scholar]
- 7. Dundas M, Walker A, Woods RL. Clinical grading of corneal staining of non-contact lens wearers. Ophthalmic Physiol Opt. 2001;21:30–35 [PubMed] [Google Scholar]
- 8. Schwallie JD, McKenney CD, Long WD, Jr, McNeil A. Corneal staining patterns in normal non-contact lens wearers. Optom Vis Sci. 1997;74:92–98 [DOI] [PubMed] [Google Scholar]
- 9. Orsborn GN, Zantos SG. Corneal desiccation staining with thin high water content contact lenses. CLAO J. 1988;14:81–85 [PubMed] [Google Scholar]
- 10. Young GCS. Poorly fitting soft lenses affect ocular integrity. CLAO J. 2001;27:68–74 [PubMed] [Google Scholar]
- 11. Lemp MA. Report of the National Eye Institute/Industry workshop on Clinical Trials in Dry Eyes. CLAO J. 1995;21:221–232 [PubMed] [Google Scholar]
- 12. Yokoi N, Takehisa Y, Kinoshita S. Correlation of tear lipid layer interference patterns with the diagnosis and severity of dry eye. Am J Ophthalmol. 1996;122:818–824 [DOI] [PubMed] [Google Scholar]
- 13. Liu Z, Pflugfelder SC. Corneal surface regularity and the effect of artificial tears in aqueous tear deficiency. Ophthalmology. 1999;106:939–943 [DOI] [PubMed] [Google Scholar]
- 14. Bourcier T, Acosta MC, Borderie V, et al. Decreased corneal sensitivity in patients with dry eye. Invest Ophthalmol Vis Sci. 2005;46:2341–2345 [DOI] [PubMed] [Google Scholar]
- 15. Ward KW. Superficial punctate fluorescein staining of the ocular surface. Optom Vis Sci. 2008;85:8–16 [DOI] [PubMed] [Google Scholar]
- 16. Morgan PB, Maldonado-Codina C. Corneal staining: do we really understand what we are seeing? Cont Lens Anterior Eye. 2009;32:48–54 [DOI] [PubMed] [Google Scholar]
- 17. Garofalo RJ, Dassanayake N, Carey C, Stein J, Stone R, David R. Corneal staining and subjective symptoms with multipurpose solutions as a function of time. Eye Contact Lens. 2005;31:166–174 [DOI] [PubMed] [Google Scholar]
- 18. Caffery BE, Josephson JE. Corneal staining after sequential instillations of fluorescein over 30 days. Optom Vis Sci. 1991;68:467–469 [DOI] [PubMed] [Google Scholar]
- 19. Kikkawa Y. Normal corneal staining with fluorescein. Exp Eye Res. 1972;14:13–20 [DOI] [PubMed] [Google Scholar]
- 20. Slusser TG, Lowther GE. Effects of lacrimal drainage occlusion with nondissolvable intracanalicular plugs on hydrogel contact lens wear. Optom Vis Sci. 1998;75:330–338 [DOI] [PubMed] [Google Scholar]
- 21. Dursun D, Ertan A, Bilezikci B, Akova YA, Pelit A. Ocular surface changes in keratoconjunctivitis sicca with silicone punctum plug occlusion. Curr Eye Res. 2003;26:263–269 [DOI] [PubMed] [Google Scholar]
- 22. Noecker RJ. Comparison of initial treatment response to two enhanced-viscosity artificial tears. Eye Contact Lens. 2006;32:148–152 [DOI] [PubMed] [Google Scholar]
- 23. Christensen MT, Cohen S, Rinehart J, et al. Clinical evaluation of an HP-guar gellable lubricant eye drop for the relief of dryness of the eye. Curr Eye Res. 2004;28:55–62 [DOI] [PubMed] [Google Scholar]
- 24. Marsh P, Pflugfelder SC. Topical nonpreserved methylprednisolone therapy for keratoconjunctivitis sicca in Sjogren syndrome. Ophthalmology. 1999;106:811–816 [DOI] [PubMed] [Google Scholar]
- 25. Aragona P, Stilo A, Ferreri F, Mobrici M. Effects of the topical treatment with NSAIDs on corneal sensitivity and ocular surface of Sjogren's syndrome patients. Eye (Lond). 2005;19:535–539 [DOI] [PubMed] [Google Scholar]
- 26. Altinors DD, Akca S, Akova YA, et al. Smoking associated with damage to the lipid layer of the ocular surface. Am J Ophthalmol. 2006;141:1016–1021 [DOI] [PubMed] [Google Scholar]
- 27. Smith JA, Vitale S, Reed GF, et al. Dry eye signs and symptoms in women with premature ovarian failure. Arch Ophthalmol. 2004;122:151–156 [DOI] [PubMed] [Google Scholar]
- 28. Nichols KK, Mitchell GL, Simon KM, Chivers DA, Edrington TB. Corneal staining in hydrogel lens wearers. Optom Vis Sci. 2002;79:20–30 [DOI] [PubMed] [Google Scholar]
- 29. Fujishima H, Shimazaki J, Yagi Y, Tsubota K. Improvement of corneal sensation and tear dynamics in diabetic patients by oral aldose reductase inhibitor, ONO-2235: a preliminary study. Cornea. 1996;15:368–375 [DOI] [PubMed] [Google Scholar]
- 30. Bergmanson JP, Ruben M, Chu LW. Corneal epithelial response of the primate eye to gas permeable corneal contact lenses: a preliminary report. Cornea. 1984;3:109–113 [PubMed] [Google Scholar]
- 31. Josephson JE, Caffery BE. Corneal staining after instillation of topical anesthetic (SSII). Invest Ophthalmol Vis Sci. 1988;29:1096–1099 [PubMed] [Google Scholar]
- 32. Romanchuk KG. Fluorescein. Physiochemical factors affecting its fluorescence. Surv Ophthalmol. 1982;26:269–283 [DOI] [PubMed] [Google Scholar]
- 33. Tabery HM. Micropunctate fluorescein staining of the human corneal surface: microerosions or cystic spaces?—a non-contact photomicrographic in vivo study. Acta Ophthalmol Scand. 1997;75:134–136 [DOI] [PubMed] [Google Scholar]
- 34. Tabery HM. Dual appearance of fluorescein staining in vivo of diseased human corneal epithelium: a non-contact photomicrographic study. Br J Ophthalmol. 1992;76:43–44 [DOI] [PMC free article] [PubMed] [Google Scholar]
- 35. Feenstra RP, Tseng SC. Comparison of fluorescein and rose bengal staining. Ophthalmology. 1992;99:605–617 [DOI] [PubMed] [Google Scholar]
- 36. Bergmanson JP. Histopathological analysis of the corneal epithelium after contact lens wear. J Am Optom Assoc. 1987;58:812–818 [PubMed] [Google Scholar]
- 37. Millar TJ, Papas EB, Ozkan J, Jalbert I, Ball M. Clinical appearance and microscopic analysis of mucin balls associated with contact lens wear. Cornea. 2003;22:740–745 [DOI] [PubMed] [Google Scholar]
- 38. Ladage PM, Petroll WM, Jester JV, Fisher S, Bergmanson JP, Cavanagh HD. Spherical indentations of human and rabbit corneal epithelium following extended contact lens wear. CLAO J. 2002;28:177–180 [DOI] [PubMed] [Google Scholar]
- 39. Barr JT, TL Corneal epithelium 3 and 9 o'clock staining studied with the specular microscope. Int Contact Lens Clin. 1994;21:105–111 [Google Scholar]
- 40. Wilson G, Ren H, Laurent J. Corneal epithelial fluorescein staining. J Am Optom Assoc. 1995;66:435–441 [PubMed] [Google Scholar]
- 41. Wilson G, Schwallie JD, Bauman RE. Comparison by contact lens cytology and clinical tests of three contact lens types. Optom Vis Sci. 1998;75:323–329 [DOI] [PubMed] [Google Scholar]
- 42. McNamara NA, Polse KA, Fukunaga SA, Maebori JS, Suzuki RM. Soft lens extended wear affects epithelial barrier function. Ophthalmology. 1998;105:2330–2335 [DOI] [PubMed] [Google Scholar]
- 43. Thinda S, Sikh PK, Hopp LM, Glasgow BJ. Polycarbonate membrane impression cytology: evidence for fluorescein staining in normal and dry eye corneas. Br J Ophthalmol. 2010;94:406–409 [DOI] [PMC free article] [PubMed] [Google Scholar]
- 44. Walt JG, Rowe MM, Stern KL. Evaluating the functional impact of dry eye: the Ocular Surface Disease Index. Drug Inf J. 1997;31:1436 [Google Scholar]
- 45. Martinez AJ, Mills MB, Jaceldo KB, et al. Standardization of conjunctival impression cytology. Cornea. 1995;14:515–522 [PubMed] [Google Scholar]
- 46. Vadrevu VL, Fullard RJ. Enhancements to the conjunctival impression cytology technique and examples of applications in a clinico-biochemical study of dry eye. CLAO J. 1994;20:59–63 [PubMed] [Google Scholar]
- 47. Egbert PR, Lauber S, Maurice DM. A simple conjunctival biopsy. Am J Ophthalmol. 1977;84:798–801 [DOI] [PubMed] [Google Scholar]
- 48. Tunc M, Yildirim U, Yuksel H, Cheng X, Humayun M, Ratner B. Conjunctival impression cytology by using a thermosensitive adhesive: polymerized N-isopropyl acrylamide. Cornea. 2009;28:770–773 [DOI] [PubMed] [Google Scholar]
- 49. Thatcher RW, Darougar S, Jones BR. Conjunctival impression cytology. Arch Ophthalmol. 1977;95:678–681 [DOI] [PubMed] [Google Scholar]
- 50. Zaidman GW, Billingsley A. Corneal impression test for the diagnosis of acute rabies encephalitis. Ophthalmology. 1998;105:249–251 [DOI] [PubMed] [Google Scholar]
- 51. Hershenfeld S, Kazdan JJ, Mancer K, Feugas P, Basu PK, Avaria M. Impression cytology in conjunctivitis. Can J Ophthalmol. 1981;16:76–78 [PubMed] [Google Scholar]
- 52. Nelson JD, Havener VR, Cameron JD. Cellulose acetate impressions of the ocular surface: dry eye states. Arch Ophthalmol. 1983;101:1869–1872 [DOI] [PubMed] [Google Scholar]
- 53. Pflugfelder SC, Huang AJ, Feuer W, Chuchovski PT, Pereira IC, Tseng SC. Conjunctival cytologic features of primary Sjogren's syndrome. Ophthalmology. 1990;97:985–991 [DOI] [PubMed] [Google Scholar]
- 54. Baudouin C, Haouat N, Brignole F, Bayle J, Gastaud P. Immunopathological findings in conjunctival cells using immunofluorescence staining of impression cytology specimens. Br J Ophthalmol. 1992;76:545–549 [DOI] [PMC free article] [PubMed] [Google Scholar]
- 55. Calonge M, Diebold Y, Saez V, et al. Impression cytology of the ocular surface: a review. Exp Eye Res. 2004;78:457–472 [DOI] [PubMed] [Google Scholar]
- 56. Lopin E, Deveney T, Asbell PA. Impression cytology: recent advances and applications in dry eye disease. Ocul Surf. 2009;7:93–110 [DOI] [PubMed] [Google Scholar]
- 57. Refaat RF, Allan D. Optimal surface for impression cytology. Br J Ophthalmol. 1990;74:254. [DOI] [PMC free article] [PubMed] [Google Scholar]
- 58. Tseng SC. Staging of conjunctival squamous metaplasia by impression cytology. Ophthalmology. 1985;92:728–733 [DOI] [PubMed] [Google Scholar]
- 59. Anshu, Munshi MM, Sathe V, Ganar A. Conjunctival impression cytology in contact lens wearers. Cytopathology. 2001;12:314–320 [DOI] [PubMed] [Google Scholar]
- 60. Thiel MA, Bossart W, Bernauer W. Improved impression cytology techniques for the immunopathological diagnosis of superficial viral infections. Br J Ophthalmol. 1997;81:984–988 [DOI] [PMC free article] [PubMed] [Google Scholar]
- 61. Garcher C, Bron A, Baudouin C, Bildstein L, Bara J. CA 19–9 ELISA test: a new method for studying mucus changes in tears. Br J Ophthalmol. 1998;82:88–90 [DOI] [PMC free article] [PubMed] [Google Scholar]
- 62. Tole DM, McKelvie PA, Daniell M. Reliability of impression cytology for the diagnosis of ocular surface squamous neoplasia employing the Biopore membrane. Br J Ophthalmol. 2001;85:154–158 [DOI] [PMC free article] [PubMed] [Google Scholar]
- 63. Glasgow BJ, Gasymov OK, Casey RC. Exfoliative epitheliopathy of bullous keratopathy with breaches in the MUC16 glycocalyx. Invest Ophthalmol Vis Sci. 2009;50:4060–4064 [DOI] [PMC free article] [PubMed] [Google Scholar]
- 64. Williams RT, Bridges JW. Fluorescence of solutions: A Review. J Clin Pathol. 1964;17:371–394 [DOI] [PMC free article] [PubMed] [Google Scholar]
- 65. Mantelli F, Argueso P. Functions of ocular surface mucins in health and disease. Curr Opin Allergy Clin Immunol. 2008;8:477–483 [DOI] [PMC free article] [PubMed] [Google Scholar]
- 66. Gipson IK, HY, Argueso P. Character of ocular surface mucins and their alteration in dry eye disease. Ocul Surf. 2004;2:131–148 [DOI] [PubMed] [Google Scholar]
- 67. Argueso P, Tisdale A, Spurr-Michaud S, Sumiyoshi M, Gipson IK. Mucin characteristics of human corneal-limbal epithelial cells that exclude the rose bengal anionic dye. Invest Ophthalmol Vis Sci. 2006;47:113–119 [DOI] [PMC free article] [PubMed] [Google Scholar]
- 68. Dogru M, Okada N, Asano-Kato N, et al. Alterations of the ocular surface epithelial mucins 1, 2, 4 and the tear functions in patients with atopic keratoconjunctivitis. Clin Exp Allergy. 2006;36:1556–1565 [DOI] [PubMed] [Google Scholar]
- 69. Gipson IK, Yankauckas M, Spurr-Michaud SJ, Tisdale AS, Rinehart W. Characteristics of a glycoprotein in the ocular surface glycocalyx. Invest Ophthalmol Vis Sci. 1992;33:218–227 [PubMed] [Google Scholar]
- 70. Argueso P, Spurr-Michaud S, Russo CL, Tisdale A, Gipson IK. MUC16 mucin is expressed by the human ocular surface epithelia and carries the H185 carbohydrate epitope. Invest Ophthalmol Vis Sci. 2003;44:2487–2495 [DOI] [PubMed] [Google Scholar]
- 71. Glasgow BJ, Gasymov OK, Abduragimov AR, Engle JJ, Casey RC. Tear lipocalin captures exogenous lipid from abnormal corneal surfaces. Invest Ophthalmol Vis Sci. 2010;51:1981–1987 [DOI] [PMC free article] [PubMed] [Google Scholar]
- 72. Lebow KA, Schachet JL. Evaluation of corneal staining and patient preference with use of three multi-purpose solutions and two brands of soft contact lenses. Eye Contact Lens. 2003;29:213–220 [DOI] [PubMed] [Google Scholar]
- 73. Pritchard N, Young G, Coleman S, Hunt C. Subjective and objective measures of corneal staining related to multipurpose care systems. Cont Lens Anterior Eye. 2003;26:3–9 [DOI] [PubMed] [Google Scholar]
- 74. Carnt N, Jalbert I, Stretton S, Naduvilath T, Papas E. Solution toxicity in soft contact lens daily wear is associated with corneal inflammation. Optom Vis Sci. 2007;84:309–315 [DOI] [PubMed] [Google Scholar]
- 75. Szczotka-Flynn L, Debanne SM, Cheruvu VK, et al. Predictive factors for corneal infiltrates with continuous wear of silicone hydrogel contact lenses. Arch Ophthalmol. 2007;125:488–492 [DOI] [PubMed] [Google Scholar]
- 76. Miyata K, Amano S, Sawa M, Nishida T. A novel grading method for superficial punctate keratopathy magnitude and its correlation with corneal epithelial permeability. Arch Ophthalmol. 2003;121:1537–1539 [DOI] [PubMed] [Google Scholar]


