BACKGROUND
The importance of ethnicity recording in the UK
The reduction of ethnic health inequalities has been a priority for government health policy in the UK since the introduction of the Race Relations (Amendment) Act in 2000.1 This Act places a duty on all public bodies to consider the race-equality implications in all of the policies that shape their operations. The UK is one of the few European countries that officially recognises the need for ethnicity data to support service-monitoring purposes and places no restrictions on the collection of such data; this is in contrast to France and Germany, for example, where restrictions on collecting such data do exist.2
For general practice this means developing robust counts of ethnicity at practice level and using the data to monitor access and service utilisation. This is particularly important in urban areas, which tend to be most ethnically diverse and where population mobility is greatest. At the local level, one of the primary purposes of collecting ethnic-category data about patients is to establish whether services are meeting the needs of different ethnic groups in the community and to assist future planning of service provision. In addition, reductions in the disparity in health service utilisation and outcomes by different ethnic groups can be used as a key service quality marker in any health system.3
To date, ethnicity recording at the general practice level in the UK has been low.2,4 To bolster data quality and recording levels in primary care, the NHS has introduced financially incentivised targets for ethnicity recording in general practice through the Quality and Outcomes Framework (QOF); however, this is limited to new registrations.5
Defining and categorising ethnicity
The legal definition of ‘ethnic group’, as adopted by the House of Lords, states that a long, shared history and common cultural tradition are essential characteristics. In addition, a common geographical origin, language, literature, or religion may also be present.6 The UK-Census definition of ethnicity is based on the theoretical concept of self-assigned ethnicity, which encompasses the patient’s sense of belonging to a specific cultural group at that point in time. For example, immigrants to the UK from the Indian subcontinent may be British nationals but members of a particular ethnic group, such as Sikh Punjabis. Their children who have been born in the UK are members of their parent’s ethnic group but may perceive their own ethnicity to be less specific and may, for example, consider themselves to be simply Indian, Asian, or black. They may also perceive themselves to have an additional ethnic identity relating to the host community (such as British, Irish, or Scottish).
This approach, using self-assigned ethnicity, is widely used in social research and is believed to provide meaningful categorisation, especially in relation to health inequalities.7 Self-reported ethnicity stands in contrast to externally allocated ethnicity, which solely addresses place of birth or origin, regardless of how individuals identify themselves.
The ethnicity data collected at practice level are self-reported by the patient at registration or during consultation, and coded based on the two categorisation hierarchies of the 1991 and 2001 UK Censuses. Typically, for the purposes of research and service development, the 16+1 (the plus one is ‘not stated’) categories of the 2001 Census will be collapsed into groupings. The most common contraction includes four categories (white, South Asian, black African/Caribbean, other) plus ‘mixed ethnicity’, plus ‘not stated’ (4+1+1); however, the justification for any amalgamation needs to be stated and it may be necessary to lump or split categories differently depending on the type of project being undertaken.8
The impact of ethnicity on health
The use of country of origin may prove inadequate for investigating ethnic inequalities in health, as incidence rates of some diseases for migrant populations tend to revert to those of the host country rather than the country of origin, particularly among later generations.7,9However, some major chronic diseases — such as diabetes, hypertension, and ischaemic heart disease (IHD) — have significantly different prevalence according to ethnic group. In addition, patients may benefit from treatment that is adjusted according to knowledge regarding their ethnic group. Rates of diabetes and IHD are much higher among individuals of South Asian origin; however, while there are higher rates of diabetes, hypertension, and stroke among black African and Caribbean people, levels of IHD are lower in comparison to the white population.10,11
Developing reliable methods of recording ethnicity at general practice level is an essential first stage in identifying disparities in service provision, and this information can help provider organisations develop local health policy for ethnically diverse populations.12–14
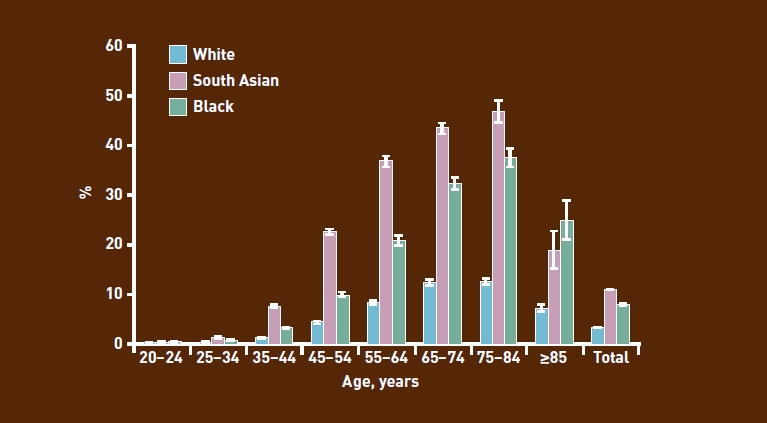
Using the registers of individuals with diabetes from practices with over 95% ethnicity recording as numerator, and GLA age-banded estimates of ethnic populations as denominator, it was possible to illustrate the early onset and high rates of diabetes in the populations of South Asian and black ethnic groups in the three inner east London PCTs of Newham, Tower Hamlets, and City & Hackney (Figure 1).13
Figure 1.

Prevalence of diabetes by age and aggregated ethnic groups.
Recording methods and their limitations
In the UK, the primary healthcare commissioners, currently primary care trusts (PCTs), have an important role in monitoring practice performance and working with practices to improve quality. This may involve estimating the predicted prevalence of chronic diseases by practice, by referring to the demographic characteristics of general practice populations. In the absence of the ‘gold standard’ of self-reported ethnicity at individual patient level, other methods have been used to estimate the ethnicity of practice populations.
The most common recording method used is the attribution of population characteristics based on data from the Census. Such census-attribution estimates can, however, prove unreliable as population-wide characteristics are, erroneously, assumed to be observed at the individual practice level. For example, if a practice has a registered population of 500 people from a super output area (SOA — a census-associated geographic area with 1000–1500 residents) and the Census records 30% of the population in the SOA as being of white ethnicity, 30% of those 500 people will be recorded as white.9 Although this may be an accurate reflection in an area where there is a dispersed population and little choice of practice registration, it is much more problematic in multi-ethnic urban areas where practice boundaries overlap and patients can exercise some choice over the practice with which they register. In such cases, considerations such as language or having a practitioner from a similar culture may override geographic location as the primary driver of registration, thereby invalidating geographically bound population-based estimates. The error is even greater when larger areas such as local-authority wards are used as the area basis for census attribution.
Census-attributed ethnicity is not always comparable to self-reported ethnicity collected in the practice and, even at relatively low (20–50%) overall levels of practice recording, practice estimates are more robust than census-attribution methods.1 This is due to the fact that ethnicity-recording rates appear to be independent of characteristics such as practice size and ethnic composition of the practice population. Other sources of practice-population ethnicity data include hospital-episode statistics; these link each hospital episode to a practice code, regardless of which hospital the patient attends. Recording of ethnicity is not complete, but is improving; for 2005–2006 around 80% of finished consultant episodes had a valid ethnicity recorded. These align more closely to practice-based estimates of minority ethnic populations than census-attribution methods; however, the ‘gold standard’ remains self-reported ethnicity at the practice.1
Ethnicity reporting in east London
Data-entry templates for routine recording of self-reported ethnicity were first introduced in Tower Hamlets in 2001 for people on chronic disease registers. This initiative was extended to the entire general practice population in April 2005 via a local enhanced service to extend and improve the quality of practice-based, self-reported ethnicity across the three east London PCTs of Tower Hamlets, Newham, and City & Hackney. In 2005, the service covered all 139 practices and a total population of 777 481 patients.
At the outset of the scheme, 95% of participating practices received a facilitated visit to discuss it, data-entry templates, and use of ethnic-category information. This included how to convert ethnicity codes based on the 1991 Census to those based on the 2001 Census, as well as the fundamental principle of self-classified ethnicity. The scheme emphasised not only the provision of adequate guidance to practices regarding the collection of ethnicity data and why it might be an emotive issue for patients, but also provided information on how such data could potentially be used. Practices received an annual year-end payment based on the percentage of their population for which ethnicity and language were recorded. Other strategies to increase recording included incorporating data fields for ethnicity and language in all chronic disease management templates, along with data capture on the need for, and use of, interpreting and advocacy services.
Ethnicity, along with other practice-based data, are collected by the Clinical Effectiveness Group in a chronic disease management audit conducted in April of every year.15 As ethnicity recording in general practice continues to improve, the question arises as to when practice-based recording methods will be sufficient to supplant the use of census-attribution methods in determining population denominators.
METHOD
To investigate agreement between the census-estimated population and direct measurement of ethnicity at general practices, the age-banded practice-population estimates were compared for white, black, and South Asian groups with those from the Greater London Authority (GLA).16 The GLA provides estimates of ethnic populations by age band, which are adjusted from the Office for National Statistics’ (ONS) mid-year estimates. Although the ONS data are considered accurate for London overall, they conceal under-counting for some inner-London boroughs, such as Newham, due to internal migration between localities.
The GLA produces ‘high’ and ‘low’ population estimates, both of which produced similar results; this report uses the low estimate as population denominator. For the purposes of this project, ethnicity was condensed into four main categories and mixed groups were included in the parent minority ethnic group:
white (British, Irish, other white);
black (black African, black Caribbean, black British, other black, and mixed black);
South Asian (Bangladeshi, Pakistani, Indian, Sri Lankan, British Asian, other South Asian, or mixed Asian);
other (Chinese, other ethnic groups, other mixed groups); and
not stated.
At baseline in 2005, practice-based ethnicity recording was 38% across the general practice population and ranged between 74% and 83% on the major chronic disease registers. Data were extracted from practice computers using MIQUEST software. Over 5 years, total self-reported ethnicity recording increased from 38% to 80% in the general population and to 98% on the chronic disease registers (Table 1).
Table 1.
Ethnicity recording in east London, 2005–2010
| 2005 | 2006 | 2007 | 2008 | 2009 | 2010 | |
|---|---|---|---|---|---|---|
| East London registered populationa | 757 481 | 802 689 | 817 927 | 843 910 | 843 724 | 894 579 |
| Total ethnicity recording, % | 38 | 48 | 62 | 70 | 78 | 80 |
| IHD register, % | 79 | 85 | 91 | 96 | 97 | 98 |
| COPD register, % | 74 | 84 | 99 | 96 | 98 | 98 |
| Diabetes register, % | 83 | 88 | 94 | 98 | 98 | 98 |
| Hypertension register, % | n/a | n/a | 75b | 86 | 96 | 99 |
City & Hackney, Newham, and Tower Hamlets only
Tower Hamlets only. COPD = chronic obstructive pulmonary disease. IHD = ischaemic heart disease.
The data used for this analysis were collected in April 2009 and covered the period from 1 January 2008 until 31 March 2009. In 2008–2009, there were 146 practices in the three east London PCTs of City & Hackney, Newham, and Tower Hamlets, which had a combined list size of 843 724 patients. For technical reasons, data from one of the practices could not be extracted for the 2009 audit. Practice-list size ranged from 847 to 14 262, with a mean list size of 5819 patients. Census data was taken from the 2008 GLA ‘low’ population estimates for Tower Hamlets, Newham, and City & Hackney.16 Bland-Altman plots were used to compare age-banded estimates of ethnicity from the GLA with self-reported estimates from general practices in east London.
RESULTS
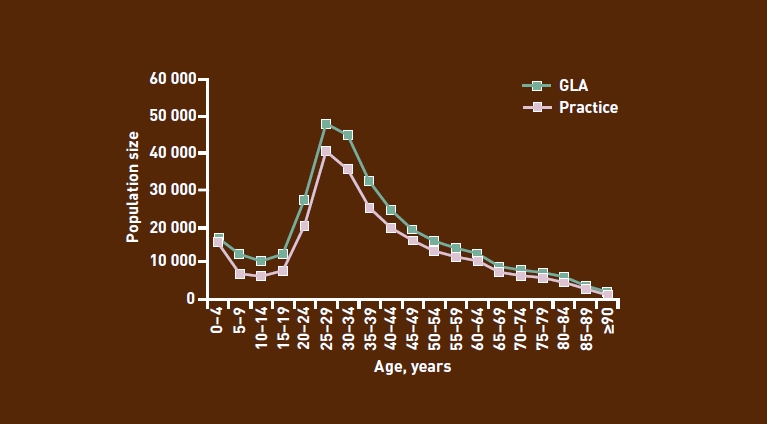
The ethnicity breakdown of the population in the three boroughs of City & Hackney, Newham, and Tower Hamlets is given in Table 2. The comparison of population size shows almost perfect agreement with the GLA estimates for patients of white, black, and South Asian ethnicity aged >60 years. For patients categorised as being white, the GLA has higher estimates of the population size for younger groups, particularly those aged between 20 and 40 years (Figure 2). This may reflect practice under-recording of ethnicity in younger white patients.
Table 2.
East London population ethnicity compared to estimates of Greater London and England
| Registered GP population in east London 2009 | GLA estimates of east London populationa | England populationb | |
|---|---|---|---|
| Total | 843 724 | 714 123 | 51 092 000 |
| White (%) | 30.6 | 45.8 | 92.1 |
| South Asian (%) | 24.2 | 28.8 | 4.1 |
| Black (%) | 15.1 | 19.5 | 2.6 |
| Other (%) | 4.9 | 5.9 | 1.2 |
| Not recorded (%) | 25.2 | – | – |
GLA = Greater London Authority.
GLA estimates of east London population taken fromthe GLA 2008 low estimates of the boroughs of Newham, Tower Hamlets, and City & Hackney
England population take fromthe mid-2007 estimates of England Population (Office of National Statistics).
Figure 2.

Comparison of GLA and east London GP registered population for white ethnicity recording, by age group (2009).
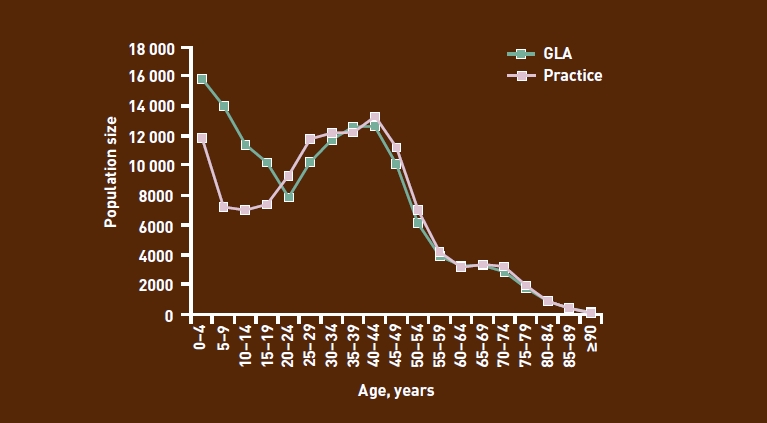
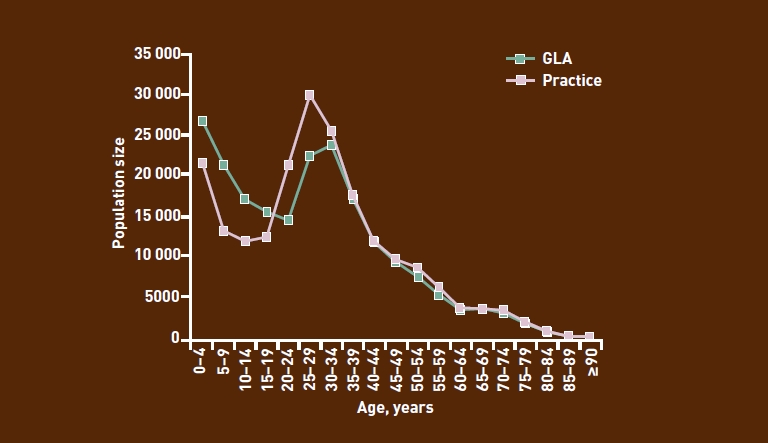
For patients of black (Figure 3) and South Asian (Figure 4) ethnicity, the pattern is different: compared with practice estimates, the GLA estimates are much higher for patients aged <20 years, and then slightly lower for those aged 20–35 years.
Figure 3.

Comparison of GLA and east London GP registered population for black ethnicity recording, by age group (2009).
Figure 4.

Comparison of GLA and east London GP registered population for South Asian ethnicity recording, by age group (2009).
Lower rates of practice-ethnicity recording among children may explain the practice deficit in the population aged <20 years. Above this age, practices record larger populations than suggested by the Census; this may reflect internal migration from other London boroughs along with other mobile populations not captured by the Census.
The Bland-Altman plots (not shown) confirmed the trend shown in the graphs, namely that there was excellent agreement between the GLA and practice-population sizes for all ethnic groups for patients aged ≥35 years, but weaker agreement among the groups of younger patients.
Finding that practice-based recording of black and South Asian ethnicity diverged from the GLA estimates for patients aged <60 years, this discrepancy was investigated by quantifying how much the practice counts diverge from population estimates. As suggested in Figures 2–4, recording was most complete for patients aged >60 years and least complete for those aged <20 years (Table 3).
Table 3.
Gaps in practice-based ethnicity recording by age group (2009)
| Age group, years | Total population, n | Ethnicity recorded, n | Not stated/not recorded, % |
|---|---|---|---|
| 0–4 | 66 250 | 53 542 | 19 |
| 5–9 | 54 386 | 29 496 | 46 |
| 10–14 | 50 169 | 27 162 | 46 |
| 15–19 | 50 286 | 29 858 | 41 |
| 20–24 | 72 594 | 54 731 | 25 |
| 25–29 | 106 630 | 88 739 | 17 |
| 30–34 | 97 636 | 79 154 | 19 |
| 35–39 | 77 562 | 59 126 | 24 |
| 40–44 | 64 275 | 47 744 | 26 |
| 45–49 | 52 797 | 39 173 | 26 |
| 50–54 | 39 995 | 30 626 | 23 |
| 55–59 | 29 921 | 23 530 | 21 |
| 60–64 | 23 140 | 18 640 | 19 |
| 65–69 | 17 358 | 15 119 | 13 |
| 70–74 | 15 190 | 13 669 | 10 |
| 75–79 | 11 435 | 10 258 | 10 |
| 80–84 | 7542 | 6721 | 11 |
| 85–59 | 4340 | 3818 | 12 |
| ≥90 | 1701 | 1418 | 17 |
| Total | 843 700 | 632 524 | 25 |
DISCUSSION
Among east London general practices ethnicity recording in the general population has increased annually to levels of 80% in 2010. Recording levels in chronic disease registers have reached a plateau at values of 98%.
The enhanced service to improve ethnicity recording throughout east London has contributed to these excellent results, with overall ethnicity recording increasing by nearly 40% since 2005. However, in order for progress to continue, areas for improvement need to be identified and targeted for future work. Recording deficits among the youngest age groups still remain. Further improvements to ethnicity recording may require the provision of financial incentives and practice feedback to target higher achievement rates for recording those under 60 years of age.
UK-wide improvements to ethnicity recording could be accelerated by including additional indices of ethnicity recording and measures of social deprivation in the QOF. This could also be used as a tool to contribute towards a health-equity surveillance framework for general practice.
Where practice-based ethnicity recording exceeds 50%, practice-based data should be used in preference to census-attribution methods when estimates of practice minority ethnic groups are required for planning or predictive purposes.
The comparability of practice-recorded ethnicity with GLA Census estimates, particularly among adults, indicates that self-reported ethnicity recording is a credible measure of population make-up. This provides a valuable new method for: estimating projections of disease prevalence by ethnicity; examining the management of conditions, by ethnicity, based on primary care population data; monitoring the equity of service provision; and teasing out some of the confounding between social deprivation and ethnicity in service utilisation and health outcomes.
Acknowledgments
We thank the staff at the Clinical Effectiveness Group for collating the practice data, as well as the Tower Hamlets PCT ethnicity working group, K Boomla, M Caulfield, A Livingstone, and M Falshaw, for developing a local enhanced service to promote ethnicity recording.
Funding
This work was supported by the Barts and the London Renal Research Fund, and by the Health Foundation. All authors are independent from the funding bodies.
Competing interests
The authors have declared no competing interests.
REFERENCES
- 1.Hull SA, Rivas C, Bobby J, et al. Hospital data may be more accurate than census data in estimating the ethnic composition of general practice populations. Inform Prim Care. 2009;17(2):67–78. doi: 10.14236/jhi.v17i2.718. [DOI] [PubMed] [Google Scholar]
- 2.Raleigh VS. Collection of data on ethnic origin in England. BMJ. 2008;337:a1107. doi: 10.1136/bmj.a1107. [DOI] [PubMed] [Google Scholar]
- 3.Fiscella K, Franks P, Gold MR, Clancy CM. Inequality in quality: addressing socioeconomic, racial, and ethnic disparities in health care. JAMA. 2000;283(19):2579–2584. doi: 10.1001/jama.283.19.2579. [DOI] [PubMed] [Google Scholar]
- 4.Pringle M, Rothera I. Practicality of recording patient ethnicity in general practice: descriptive intervention study and attitude survey. BMJ. 1996;312(7038):1080–1082. doi: 10.1136/bmj.312.7038.1080. [DOI] [PMC free article] [PubMed] [Google Scholar]
- 5.Kumarapeli P, Stepaniuk R, de Lusignan S, et al. Ethnicity recording in general practice computer systems. J Public Health (Oxf) 2006;28(3):283–287. doi: 10.1093/pubmed/fdl044. [DOI] [PubMed] [Google Scholar]
- 6. Mandla v Dowell Lee [1983] 2 AC 548, (1983)
- 7.Aspinall PJ. Operationalising the collection of ethnicity data in studies of the sociology of health and illness. Sociol Health Illn. 2001;23(6):829–862. [Google Scholar]
- 8.Senior PA, Bhopal R. Ethnicity as a variable in epidemiologic research. BMJ. 1994;309(6950):327–330. doi: 10.1136/bmj.309.6950.327. [DOI] [PMC free article] [PubMed] [Google Scholar]
- 9.Jack RH, Linklater KM, Hofman D, et al. Ethnicity coding in a regional cancer registry and in Hospital Episode Statistics. BMC Public Health. 2006;6:281. doi: 10.1186/1471-2458-6-281. [DOI] [PMC free article] [PubMed] [Google Scholar]
- 10.McKeigue PM, Shah B, Marmot MG. Relation of central obesity and insulin resistance with high diabetes prevalence and cardiovascular risk in South Asians. Lancet. 1991;337(8738):382–386. doi: 10.1016/0140-6736(91)91164-p. [DOI] [PubMed] [Google Scholar]
- 11.National Institute for Health and Clinical Excellence. London: National Institute for Health and Clinical Excellence; 2006. Hypertension: management of hypertension in adults in primary care. http://guidance.nice.org.uk/CG34 (accessed 23 Mar 2011) [Google Scholar]
- 12.Majeed A. Sources, uses, strengths and limitations of data collected in primary care in England. Health Stat Q. 2004;(21):5–14. [PubMed] [Google Scholar]
- 13.Dreyer G, Hull S, Aitken Z, et al. The effect of ethnicity on the prevalence of diabetes and associated chronic kidney disease. QJM. 2009;102(4):261–269. doi: 10.1093/qjmed/hcn177. [DOI] [PubMed] [Google Scholar]
- 14.Mathur R, Hull SA, Badrick E, Robson J. Cardiovascular multimorbidity: the effect of ethnicity on prevalence and risk factor management. Br J Gen Pract. 2011 doi: 10.3399/bjgp11X572454. DOI: 10.3399/bjgp11X572454. [DOI] [PMC free article] [PubMed] [Google Scholar]
- 15.Clinical Effectiveness Group. CEG Annual Report: Recognising Improvement January 2010. http://www.icms.qmul.ac.uk/chs/Docs/28445.pdf (accessed 5 Apr 2011)
- 16. Greater London Authority. GLA 2008 Round Demographic Projections. http://legacy.london.gov.uk/gla/publications/factsandfigures/DMAG-briefing2009-02-round-projections.pdf (accessed 5 Apr 2011) [Google Scholar]


