

Abstract
Background
Understanding variation in the normal electrical activity of the heart, assessed by the electrocardiogram (ECG), may provide a starting point for studies of susceptibility to serious arrhythmias, such as sudden cardiac death during myocardial infarction or drug therapy. Recent genetic association studies of one ECG trait, the QT interval, have identified common variation in European-descent populations, but little is known about the genetic determinants of ECG traits in populations of African-descent.
Methods and Results
To identify genetic risk factors, we have undertaken a candidate gene study of ECG traits in collaboration with the Jackson Heart Study (JHS), a longitudinal study of 5,301 African Americans ascertained from the Jackson, Mississippi area. Nine quantitative ECG traits were evaluated: P, PR, QRS, QT, and QTc durations, heart rate and P, QRS and T axes. We genotyped 72 variations in the predominant sodium channel gene expressed in heart, SCN5A, encoding the Nav1.5 voltage-gated sodium channel in 4,558 subjects. Both rare and common variants in this gene have previously been associated with inherited arrhythmia syndromes and variable conduction. Adjusting for age, sex, and European ancestry, we performed tests of association in 3,054 unrelated participants and identified 14 significant associations (p<1.0×10⁻⁴), of which 13 are independent based upon linkage disequilibrium. These variants explain up to 2% of the variation in ECG traits in the JHS.
Conclusions
These results suggest that SCN5A variation contributes to ECG trait distributions in African Americans and these same variations may be risk or protective factors associated with susceptibility to arrhythmias.
Keywords: electrocardiography, arrhythmia, genetics, ion channels, cardiovascular diseases
INTRODUCTION
Many factors are known to influence electrocardiograph (ECG) measurements, including underlying heart disease such as coronary heart disease or hypertension, drug therapy, body mass index, and age. These factors, however, do not explain the majority of the trait variance observed in ECG traits, and a large portion of the variance remains unknown1, 2. Studies in twins and populations have reported that >35% of the variance observed for specific ECG traits is heritable3–8. Given the heritability of ECG traits, it is possible that common genetic variation in genes that modulate the electrical activity of the heart can explain a proportion of the unknown trait variance observed in the general population. Insights into such normal variability may in turn provide the starting point for predicting serious cardiovascular events such as drug-induced arrhythmias or Sudden Cardiac Death (SCD)4–7. SCD accounts for 10–20% of all deaths in adults, and risk factors include underlying heart disease and a family history of SCD5–7.
The opening of sodium channels is responsible for initiating and propagating action potentials in cardiac and other excitable cells8–17. Sodium channels are encoded by nine pore-forming alpha subunit genes8, and each channel consists of a single pore-forming α-subunit and a variable number of function-modifying β-subunits and other interacting proteins9. The NAv1.5 sodium channel α subunit (encoded by SCN5A) is the predominant α-subunit expressed in cardiac muscle11, 12. Mutations in SCN5A have been identified in cardiac conduction disease, long QT syndrome, Brugada syndrome, and other life threatening arrhythmias10, 16–18.
In addition to rare variants, other studies have implicated common variants in SCN5A with arrhythmia susceptibility or with variable ECG traits13, 15, 19–21. One non-synonymous SCN5A variant, rs7626962, (S1103Y, which is sometimes reported as S1102Y depending whether the reference sequence includes a common splice variant that eliminates a single residue)22 is common in African populations and rare in others. This SNP has been implicated in susceptibility to SCD, drug-induced arrhythmias, and SIDS in African American populations23–25. With this exception, however, there is very little information on ion channel variation in African Americans. This lack of data cannot be underscored as epidemiologic studies have demonstrated that the risk factor burden for CVD differs across race/ethnicities, with African Americans typically having a greater burden compared with European and Mexican Americans26. The rural south region of the US, which has the largest African American population, has a higher rate CVD compared to other regions27, 28.
This disparity of CVD in African Americans is an emergent concern to clinicians and epidemiologists. Admixed populations such as Hispanics and African Americans have different genetic backgrounds due to the mixture of distinct of ancestral populations29, 30 and patterns of linkage disequilibrium (LD) compared with European-descent populations31. Thus, it is possible that genetic determinants associated with ECG traits can vary depending on the ancestral populations. Given these potential differences, we genotyped 72 common single nucleotide polymorphisms (SNPs) in the SCN5A gene in 4,558 African Americans from the Jackson Heart Study (JHS) to test for an association with nine ECG traits: P, PR, QT, QTc and QRS durations, heart rate, and the P, QRS and T axes. We identified 14 significant associations at p<1.0×10⁻⁴, 13 of which have not been described in populations of European-descent. Overall, SCN5A variations reported here explains up to 2% of the variation in ECG traits. This study represents an important first step in the identification and characterization of genetic variants associated with ECG traits in African-descent populations.
METHODS
Population characteristics and ECG measurements
The Jackson Heart Study (JHS) was developed to help resolve the disparity of cardiovascular disease among African Americans32. The JHS is a longitudinal study established in 2000 to characterize the determinants of CVD in 5,301 African Americans ascertained in Jackson, Mississippi33. For the purpose of genetic analysis, consenting family members age 21 or older were ascertained32. The participants’ ages ranged from 21–85 years old at the time of ascertainment (Supplementary Figure 1), and 62% of the participants were female. Each participant received a clinical examination and interview on CVD status and other environmental factors during enrollment. ECG measurements were collected during the clinical examination using the Marquette MAC/PC digital electrocardiograph34. All measurements were documented and sent by phone to the Electrocardiographic Reading Center (ECGRC) in Minnesota. The Minnesota Code Modular ECG Analysis System (MC-MEANS) computer program was used by the ECGRC to generate representative averaged measurements of ECG waves simultaneously over all leads. Population demographics and summary statistics of ECG measurements are given in Table 1.
Table 1.
Study population demographics and ECG trait descriptive statistics for the unrelated (n= 3,054) JHS participants.
| Study Population Characteristics (n=3,054) | ||
|---|---|---|
| Variable | Mean or % | Standard Deviation (minimum, maximum) |
| Age (yrs) | 56.5 | ±11.73 (21, 85) |
| % Female | 62 | - |
| % Cardiovascular disease | 11 | - |
| P duration (msec) | 118.5 | ±13.08 (80, 170) |
| PR duration (msec) | 171.6 | ±33.02 (0,338) |
| QRS duration (msec) | 92.3 | ±10.12 (64, 120) |
| QT duration (msec) | 414.7 | ±27.64 (290, 580) |
| QTc duration (msec) | 426.4 | ±27.64 (334, 594) |
| P axis (degrees) | 48 | ±21.06 (−136, 151) |
| QRS axis (degrees) | 16.9 | ±31.18 (−137, 157) |
| T axis (degrees) | 30.6 | ±40.03 (−179, 179) |
| Heart rate (beats/min) | 64.6 | ±10.72 (30, 118) |
Genotyping
Blood samples were collected from consented individuals during enrollment for future genetic analysis. DNA was isolated from blood samples and genotyped for 72 single nucleotide polymorphisms (SNPs) using the Sequenom iPlex Gold assay on the MassARRAY platform (San Diego, CA). SNPs were selected based on the linkage disequilibrium patterns in African Americans31. The location of the genotyped SNPs, minor allele, minor allele frequencies, Hardy-Weinberg p-values, and genotyping call rates are given in Supplementary Table 1.
Statistical analysis
The JHS in this analysis is comprised of 3,071 unrelated participants and 1,487 related participants from 263 families selected for genotyping. Unrelated individuals from 263 pedigrees with two or more successfully genotyped relatives were randomly selected and analyzed. Individuals selected by this random algorithm had to have all phenotype information and have at least 95% genotyping efficiency for targeted SNPs. In two families, only one participant was genotyped; as a result, these participants were always selected. We repeated the random selection several times, and data suggest that our results are robust to the random selection process (data not shown).
To determine if ECG traits were strongly correlated (i.e., redundant), we calculated pairwise correlations for 11 ECG traits (Supplementary Table 2). Prolonged QRS duration (>120 m/sec) is an indication of congestive heart failure. Patients with abnormal QRS duration measurements (>120 m/sec) were excluded from the QRS analysis (n = 169; Supplementary Figure 2A); however, these patients were included in subsequent analysis with the other ECG traits. The exclusion of these patients in the analysis of QRS duration or other ECG traits yielded similar results compared with the inclusion of these patients (data not shown) due to the relatively small sample size of patients with prolonged QRS duration compared with the overall sample size. Of all ECG traits, T and QT durations and PR duration in leads II and VI were highly correlated (r2=0.93 and 0.87 respectively). To minimize redundancy, we chose to analyze QT duration instead of both QT and T durations and PR in lead II instead of both PR in leads II and VI. Although modest, a correlation was also observed for P wave and PR durations, QTc and QT duration, as well as QTc and heart rate (r2 >0.40, Supplementary Table 1). All of these moderately correlated traits were retained for subsequent analyses.
For the analysis, we excluded SNPs with a minor allele frequency (MAF) <0.05, genotyping efficiency <95% or Hardy Weinberg equilibrium (HWE) p-value <0.0001. Using these criteria, seven SNPs were excluded from the analysis. We also excluded 280 DNA samples due to poor genotyping efficiency, resulting in a total study population of 3,054 participants.
Global admixture estimates were calculated35 to determine the amount European ancestry using ANCESTRYMAP Version 2.036 and expressed as “mean percent European ancestry” based on a probabilistic term representing the genome-wide mean percentage of European ancestry as determined from markers on the autosomes. European ancestry was associated with durations (P, QTc, and QRS) and T axes (p<0.05).
We calculated skewness and kurtosis and performed formal tests of normality for all ECG traits. For QRS duration, the skewness (0.34) and kurtosis (2.4) suggested that this ECG trait is normally distributed. However, QRS duration failed a formal test of normality while all other ECG traits followed a normal distribution. Based on these results, we performed tests of association for QRS duration untransformed and log transformed (data not shown). Because the results did not differ between the untransformed and transformed analyses, we chose to present the untransformed results for ease of interpretation.
Using linear regression, we performed single SNP tests of association assuming an additive genetic model for 65 SNPs that passed QC in the unrelated sample with nine ECG traits using PLINK37. Analyses were performed unadjusted and adjusted for age, sex, and European ancestry, and results were plotted using Synthesis-View 38. To account for multiple testing, we employed a significance threshold of p<1.0 ×10⁻⁴. We also performed unadjusted family-based tests of association for all ECG traits using the QFAM procedure from PLINK37. This method uses traditional linear regression but uses permutation to correct for family structure. We employed this method with all genotyped samples that passed quality control [5 families (n=19) were removed due to Mendelian errors] and tested for an association with each SNP for all ECG traits. The results from this analysis are consistent with results from the unrelated samples (data not shown). To determine the amount of the variance in ECG traits explained by each SNP, R2 was computed using STATA version 10. Linkage disequilibrium (r2) was calculated using Haploview 39.
RESULTS
ECG interval durations
The P, PR, QRS, QT and QTc durations were tested for an association with 65 SNPs in SCN5A that passed quality control measures. Overall there were 14 significant associations (p<1.0 ×10⁻⁴) amongst 65 SNPs for P, PR, QRS and QT durations. PR duration had the most significant SNP associations, with eight SNPs significantly associated with decreased PR duration: nonsynonymous rs7626962 (S1103Y) and seven intronic SNPs (Table 2). Three intronic SNPs were associated with increased PR duration but not with any other ECG trait. Four SNPs were associated with decreased P wave duration, one with decreased QRS duration. A single intronic SNP was associated with increased QRS duration, but no other ECG trait. Unique to QT duration, rs9311195 was associated with decreased QT duration (Table 2). There were no significant associations observed with QTc duration at p<1.0×10⁻⁴ (Supplementary Table 3).
Table 2.
Beta coefficients and p-values for significant SNPs associated with at least one ECG trait in unrelated JHS participants. Linear regression adjusting for age, sex, and European ancestry was performed for 65 SNPs assuming an additive model for nine quantitative ECG traits (for QRS duration only patients with <120 msec were included, n= 2,878). Fifteen significant SNPs that met our significance threshold were associated with at least one ECG trait and are listed above. In bold are significant associations at p< 1.0×10⁻⁴.
| SNP | Location | P duration | QRS duration | PR lead II | QT duration | ||||
|---|---|---|---|---|---|---|---|---|---|
| β (95% CI) | p-value | β (95% CI) | p-value | β (95% CI) | p-value | β (95% CI) | p-value | ||
| rs11129796 | Intron | −0.81 (−1.6, 0.7) | 1.8E-1 | −1.1 (−1.6, −0.3) | 2.5E-3 | −3.5 (−5.0, −0.2) | 2.4E-4 | −1.4 (−4.1, 0.3) | 2.3E-1 |
| rs13084981 | Intron | 1.6 (−0.0, 2.9) | 2.7E-2 | 1.4 (0.4, 2.2) | 9.4E-4 | 3.5 (0.8, 6.5) | 1.1E-2 | −0.61 (−3.1, 2.1) | 6.5E-1 |
| rs3922844 | Intron | 1.5 (0.4, 2.0) | 6.3E-4 | 1.3 (0.8, 1.8) | 7.5E-8 | 4.7 (3.1, 6.4) | 3.9E-9 | −0.68 (−2.3, 0.8) | 3.9E-1 |
| rs6763048 | Intron | −1.7 (−2.5, 0.6) | 6.6E-4 | −0.91 (−1.3, −0.2) | 1.4E-3 | −4.3 (−6.1, −2.3) | 3.5E-6 | −0.54 (−2.8, 1.4) | 5.5E-1 |
| rs6768664 | Intron | 0.60 (−0.2, 1.5) | 1.8E-1 | 0.67 (0.2, 1.2) | 9.5E-3 | 3.0 (1.5, 4.9) | 2.3E-4 | 2.4 (0.46, 3.7) | 4.0E-3 |
| rs7373102 | Intron | 0.81 (−0.2, 1.6) | 8.1E-2 | 0.71 (0.13, 1.2) | 1.1E-2 | 2.8 (1.5, 5.1) | 1.4E-4 | 2.1 (−0.1, 3.3) | 2.1E-2 |
| rs7374138 | Intron | −1.5 (−2.3, −0.4) | 3.6E-3 | −1.3 (−1.8, −0.6) | 6.2E-6 | −4.0 (−6.0, −2.1) | 2.4E-5 | −0.73 (−3.5, 0.1) | 4.4E-1 |
| rs7374605 | Intron | 1.1 (−0.4,1.6) | 3.6E-2 | 0.76 (0.2, 1.4) | 9.9E-3 | 4.0 (2.0, 6.0) | 3.3E-5 | −1.4 (−3.0, 0.7) | 1.3E-1 |
| rs7626962 | Ser->Tyr | −3.3 (−4.9, −1.8) | 2.5E-5 | −1.4 (−2.2, −0.4) | 2.3E-3 | −6.9 (−9.9, −4.0) | 2.5E-6 | −0.74 (−3.1, 2.6) | 6.1E-1 |
| rs7627552 | Intron | −2.2 (−2.9, −0.8) | 5.8E-5 | −1.0 (−1.7, −0.5) | 1.5E-3 | −6.4 (−3.7, −5.5) | 4.6E-10 | −2.1 (3.5, 0.5) | 3.6E-2 |
| rs7629265 | Intron | −3.2 (−4.6, −1.6) | 7.5E-5 | −1.5 (−2.4, −0.6) | 1.8E-3 | −7.8 (−10, −4.4) | 2.4E-7 | −1.3 (−3.2, 2.5) | 3.8E-1 |
| rs7637849 | Intron | −1.7 (−2.9, −0.9) | 1.1E-3 | −0.76 (−1.2, 0.0) | 1.2E-2 | −4.2 (−6.1, −2.1) | 2.3E-5 | −0.43 (−1.9, 1.9) | 6.6E-1 |
| rs9311195 | Intron | 0.29 (−0.5, 1.7) | 6.2E-1 | 0.21 (−0.6, 0.7) | 5.3E-1 | −0.58 (−2.5, 2.0) | 6.0E-1 | −3.5 (−5.0, −0.7) | 1.6E-4 |
| rs9832586 | Intron | −1.3 (−2.6,0.59) | 1.1E-1 | −0.58 (−1.5, 0.3) | 2.1E-1 | −5.2 (−7.8, −1.4) | 7.3E-4 | −2.9 (−7.4, −1.5) | 4.8E-2 |
Heart Rate
Of the SCN5A SNPs tested for an association with heart rate, none of the associations survived the significance threshold of p<1.0 ×10⁻⁴. Two SNPs that were also associated with decreased P and PR duration trended towards significance with increased heart rate: SNPs rs7629265 (β= 0.97, p= 0.04) and rs7626962 (β= 0.91, p= 0.05) (Supplementary Table 3). These two SNPs are in high linkage disequilibrium (LD) with one another (r2=0.87); thus, these associations are not independent.
ECG axes
In addition to ECG durations, the P, QRS and T axes were also tested for an association with the same 65 SNPs. There were no significant associations with our SNPs and ECG axes measurements using a significance threshold of p<1.0×10⁻⁴ (Supplementary Table 3). One SNP that was associated with decreased PR duration trended towards significance with P axis (β= 1.95, p= 0.05).
SNPs associated with multiple ECG traits
Intronic SNP rs3922844 was associated with increased P, PR, and QRS. SNPs rs7374138, rs7626962, rs76229265, rs7637849, rs7627552, and rs6763048 consistently trended towards decreased PR, QRS and P wave durations (Figure 1). Although most SNPs did not survive our significance threshold for QRS duration, SNPs that were associated with PR and P wave duration trended towards significance with QRS duration compared with other ECG traits.
Figure 1. Significant associations across ECG traits.
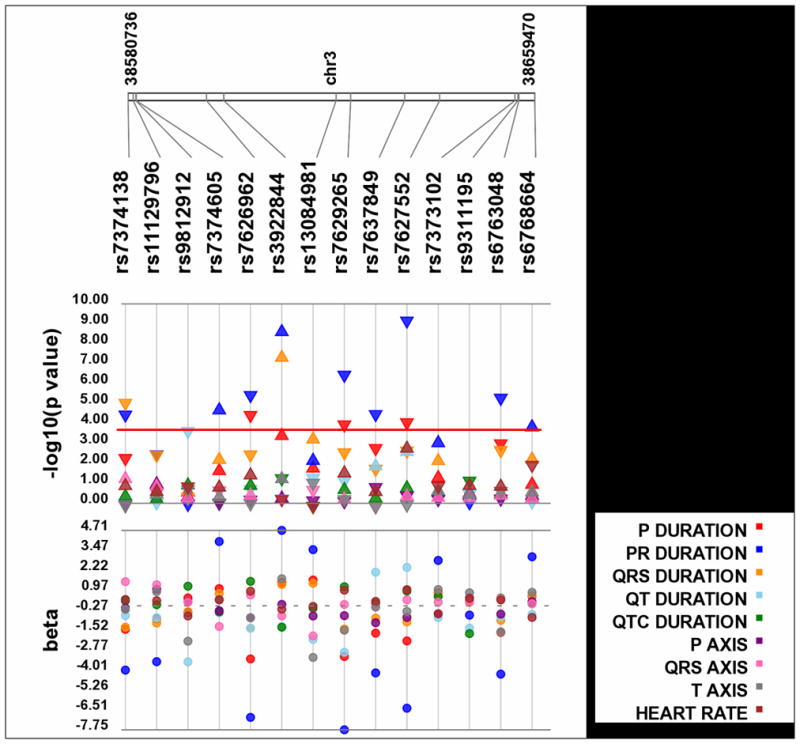
Each SNP was tested for an association with each ECG trait assuming an additive genetic model adjusted for age, sex, and European ancestry. P-values are log10 transformed along the y-axis and corresponding location for each SNP is located on the x-axis. Each point represents a p-value for each trait indicated by color (see legend). The direction of the arrows corresponds to the direction of the beta coefficient. The exact beta coefficients are reported on the bottom panel. The significance threshold is indicated by the red bar at p= 1.0×10⁻⁴.
DISCUSSION
Using a candidate gene approach, we sought to identify genetic variations within SCN5A associated with ECG measurements in African Americans from the Jackson Heart Study. We were able to detect both previously known as well as novel genetic associations with four ECG measurements (Table 2). Notably, to our knowledge, we are the first to report an association with the genetic variant S1103Y and atrial ECG traits, PR and P wave durations. We were also able to detect novel associations between intronic rs3922844 and QRS, P wave, and PR durations. SNP rs3922844 explains approximately 2% of the variability in these traits. Consistent with previous studies, no other SNP explained greater than 2% of variance for any ECG trait40.
To minimize redundancy in our results, we calculated linkage disequilibrium (LD) among SNPs in the unrelated participants (Supplemental Figure 3). Of the 14 significant associations, 13 SNPs represent independent associations. Correlated SNPs rs7626962/rs7627552 are in high LD with each other (r2= 0.87), and each likely represents the same effect. SNP pairs rs6793245/rs3935472 and rs9833086/rs4130467 are also in LD; however, they were not significantly associated with any ECG trait.
Several genome-wide association studies (GWAS) have been published for the ECG traits in populations of non-African descent. For example, two studies report associations within SCN5A and the QT interval 41–44. A recent GWAS in the isolated Kosrae population from the Federated States of Micronesia identified an association between rs7638909, a SNP located in intron 27 of SCN5A, and the PR interval, P wave duration and PR segment40. Other GWAS studies on ECG traits report an association with rs7638909 (or correlated SNPs rs12053903, rs1805126 and rs1805124) with the QT interval, PR interval, and QRS duration in Icelandic and European populations42, 45. We tested for these associations and all ECG traits in the JHS but failed to replicate these findings. The lack of replication across studies is perhaps not surprising given the different linkage disequilibrium patterns and allele frequencies in these populations. The SNPs we choose for genotyping for this study are common in African Americans such as rs7626962 and rs7629265 but are monomorphic or rare in other populations. GWAS for ECG traits in African-descent populations has yet to be reported in the literature.
Unlike previous studies, we were unable to detect an association between S1103Y and ventricular related traits QRS, T, and QT durations at our significance threshold. Given previous studies, we had expected to detect a strong association with S1103Y (rs7626962) and our ECG traits. The effect of 1103Y and QTc duration is consistent with previous studies (β = 1.53, p = 0.20; Supplementary Table 2), but given the minor allele frequency of this SNP (0.08), our study was underpowered to detect this association (20%). In our study population, there were only 20 homozygotes for the 1103Y allele; thus, it is not surprising that mean QTc is not associated with S1103Y genotype (data not shown). S1103Y was associated with P wave and PR durations (p<1.0×10⁻⁵), but there was no other association at p<1.0×10⁻⁴ with other ECG traits. A significant effect was also observed with rs7629265, with is in LD with S1103Y (r2= 0.87). Intronic rs7629265 ranked higher than S1103Y in four ECG traits: PR duration, QRS duration, QT duration, and heart rate (Table 2, Supplementary Table 3). Because of the strong LD, the association with intronic rs7629265 could be a capturing the effect of S1103Y.
As opposed to mutations, the effects of common variation are less clear. Our most significant finding, rs7627552, is in LD with rs7626962 (S1103Y), a nonsynonymous missense mutation that changes the amino acid serine to tyrosine. Studies of this variant in heterologous expression systems have reported differences between variant and wild-type channels especially under stress conditions such as low pH23, 24. The other significant SCN5A SNPs from the present study are all located in the 3′ region of the gene. While none of them have obvious function, it is noteworthy that this gene region is highly conserved with mouse. Also, it may be that these associated SNPs are in linkage disequilibrium with the “causal” or functional SNPs not genotyped in this study. However, examination of the Yoruba International HapMap data in this region (100kb upstream and downstream of rs7627552) revealed only one SNP with minor allele frequency >1% in LD at r2>0.20 in this region (rs7629265).
CONCLUSIONS
Genetic variation in the normal electrical activity of the heart, assessed by the ECG, may provide a starting point for studies of genetic susceptibility to serious arrhythmias, such as SCD during myocardial infarction or drug therapy. We identified several novel associations between SCN5A common genetic variants and the ECG traits in African Americans, and we report here the direction and magnitude of effect for all tests of association. Of the 14 significant associations, rs7627552, which is in LD with a common missense mutation (S1103Y) observed in African Americans previously associated with arrhythmia susceptibility, was the SNP most strongly associated with ECG traits P wave and PR durations. We were also able to identify 13 novel associations, one of which (rs3922844) explains as much as 2% of the variance in P wave, QRS and PR durations. Collectively, these data suggest that multiple SNPs rather than one (S1103Y) in SCN5A have an effect on ECG traits. The results of this study may offer insight relevant to future genetic studies of cardiac diseases in African-descent populations.
Supplementary Material
Acknowledgments
We would like to thank the participants of the Jackson Heart Study and data collection staff. The Vanderbilt University Center for Human Genetics Research, Computational Genomics Core provided computational and/or analytical support for this work. Genotyping was performed by the Vanderbilt DNA Resources Core.
FUNDING SOURCES
This work was funded in part by the National Institutes of Health (NIH) Pharmacogenetics Research Network U01 HL65962. The Jackson Heart Study is supported by NIH contracts N01-HC-95170, N01-HC-95171, and N01-HC-95172 that are provided by the National Heart, Lung, and Blood Institute and the National Center on Minority Health and Health Disparities.
Footnotes
CONFLICT OF INTEREST DISCLOSURES
DMR, ALG, DCC, and HAT are funded by NIH to perform the work described here. ALG has served as a consultant for Allergan, Inc. HAT has received an honorarium from the International Society on Hypertension in Blacks (ISHIB).
Reference List
- 1.Zheng ZJ, Croft JB, Giles WH, Mensah GA. Sudden cardiac death in the United States, 1989 to 1998. Circulation. 2001 October 30;104:2158–63. doi: 10.1161/hc4301.098254. [DOI] [PubMed] [Google Scholar]
- 2.Roberts WC, Day PJ. Electrocardiographic observations in clinically isolated, pure, chronic, severe aortic regurgitation: analysis of 30 necropsy patients aged 19 to 65 years. Am J Cardiol. 1985 February 1;55:432–8. doi: 10.1016/0002-9149(85)90389-3. [DOI] [PubMed] [Google Scholar]
- 3.Akylbekova EL, Crow RS, Johnson WD, Buxbaum SG, Njemanze S, Fox E, Sarpong DF, Taylor HA, Newton-Cheh C. Clinical correlates and heritability of QT interval duration in blacks: the Jackson Heart Study. Circ Arrhythm Electrophysiol. 2009 August;2:427–32. doi: 10.1161/CIRCEP.109.858894. [DOI] [PMC free article] [PubMed] [Google Scholar]
- 4.Kao WH, Arking DE, Post W, Rea TD, Sotoodehnia N, Prineas RJ, Bishe B, Doan BQ, Boerwinkle E, Psaty BM, Tomaselli GF, Coresh J, Siscovick DS, Marban E, Spooner PM, Burke GL, Chakravarti A. Genetic Variations in Nitric Oxide Synthase 1 Adaptor Protein Are Associated With Sudden Cardiac Death in US White Community-Based Populations. Circulation. 2009 February 9; doi: 10.1161/CIRCULATIONAHA.108.791723. [DOI] [PMC free article] [PubMed] [Google Scholar]
- 5.Friedlander Y, Siscovick DS, Weinmann S, Austin MA, Psaty BM, Lemaitre RN, Arbogast P, Raghunathan TE, Cobb LA. Family history as a risk factor for primary cardiac arrest. Circulation. 1998 January 20;97:155–60. doi: 10.1161/01.cir.97.2.155. [DOI] [PubMed] [Google Scholar]
- 6.Jouven X, Desnos M, Guerot C, Ducimetiere P. Predicting sudden death in the population: the Paris Prospective Study I. Circulation. 1999 April 20;99:1978–83. doi: 10.1161/01.cir.99.15.1978. [DOI] [PubMed] [Google Scholar]
- 7.Dekker LRC, Bezzina CR, Henriques JPS, Tanck MW, Koch KT, Alings MW, Arnold AER, de Boer MJ, Gorgels APM, Michels HR, Verkerk A, Verheugt FWA, Zijlstra F, Wilde AAM. Familial Sudden Death Is an Important Risk Factor for Primary Ventricular Fibrillation: A Case-Control Study in Acute Myocardial Infarction Patients. Circulation. 2006 September 12;114:1140–5. doi: 10.1161/CIRCULATIONAHA.105.606145. [DOI] [PubMed] [Google Scholar]
- 8.George AL., Jr Inherited disorders of voltage-gated sodium channels. J Clin Invest. 2005 August;115:1990–9. doi: 10.1172/JCI25505. [DOI] [PMC free article] [PubMed] [Google Scholar]
- 9.Abriel H, Kass RS. Regulation of the voltage-gated cardiac sodium channel Nav1.5 by interacting proteins. Trends Cardiovasc Med. 2005 January;15:35–40. doi: 10.1016/j.tcm.2005.01.001. [DOI] [PubMed] [Google Scholar]
- 10.Bezzina C, Veldkamp MW, van den Berg MP, Postma AV, Rook MB, Viersma JW, van Langen IM, Tan-Sindhunata G, Bink-Boelkens MT, Der Hout AH, Mannens MM, Wilde AA. A single Na(+) channel mutation causing both long-QT and Brugada syndromes. Circ Res. 1999 December 3;85:1206–13. doi: 10.1161/01.res.85.12.1206. [DOI] [PubMed] [Google Scholar]
- 11.Gellens ME, George AL, Jr, Chen LQ, Chahine M, Horn R, Barchi RL, Kallen RG. Primary structure and functional expression of the human cardiac tetrodotoxin-insensitive voltage-dependent sodium channel. Proc Natl Acad Sci. 1992;89:554–8. doi: 10.1073/pnas.89.2.554. [DOI] [PMC free article] [PubMed] [Google Scholar]
- 12.George AL, Jr, Iyer GS, Kleinfield R, Kallen RG, Barchi RL. Genomic organization of the human skeletal muscle sodium channel gene. Genomics. 1993 March;15:598–606. doi: 10.1006/geno.1993.1113. [DOI] [PubMed] [Google Scholar]
- 13.Gouas L, Nicaud V, Chaouch S, Berthet M, Forhan A, Tichet J, Tiret L, Balkau B, Guicheney P. Confirmation of associations between ion channel gene SNPs and QTc interval duration in healthy subjects. Eur J Hum Genet. 2007 September;15:974–9. doi: 10.1038/sj.ejhg.5201866. [DOI] [PMC free article] [PubMed] [Google Scholar]
- 14.Gouas L, Nicaud V, Berthet M, Forhan A, Tiret L, Balkau B, Guicheney P. Association of KCNQ1, KCNE1, KCNH2 and SCN5A polymorphisms with QTc interval length in a healthy population. Eur J Hum Genet. 2005 November;13:1213–22. doi: 10.1038/sj.ejhg.5201489. [DOI] [PubMed] [Google Scholar]
- 15.Probst V, Wilde AAM, Barc J, Sacher F, Babuty D, Mabo P, Mansourati J, Le Scouarnec S, Kyndt F, Le Caignec C, Guicheney P, Gouas L, Albuisson J, Meregalli PG, Le Marec H, Tan HL, Schott JJ. SCN5A Mutations and the Role of Genetic Background in the Pathophysiology of Brugada Syndrome. Circ Cardiovasc Genet. 2009 December 1;2:552–7. doi: 10.1161/CIRCGENETICS.109.853374. [DOI] [PubMed] [Google Scholar]
- 16.Schott JJ, Alshinawi C, Kyndt F, Probst V, Hoorntje TM, Hulsbeek M, Wilde AA, Escande D, Mannens MM, Le Marec H. Cardiac conduction defects associate with mutations in SCN5A. Nat Genetics. 1999 September 23;:20–1. doi: 10.1038/12618. [DOI] [PubMed] [Google Scholar]
- 17.Wang Q, Shen J, Splawski I, Atkinson D, Li Z, Robinson JL, Moss AJ, Towbin JA, Keating MT. SCN5A mutations associated with an inherited cardiac arrhythmia, long QT syndrome. Cell. 1995 March 10;80:805–11. doi: 10.1016/0092-8674(95)90359-3. [DOI] [PubMed] [Google Scholar]
- 18.Chen QY, Kirsch GE, Zhang DM, Brugada R, Brugada J, Brugada P, Potenza D, Moya A, Borggrefe M, Breithardt G, Ortizlopez R, Wang Z, Antzelevitch C, Obrien RE, Schulzebahr E, Keating MT, Towbin JA, Wang Genetic basis and molecular mechanism for idiopathic ventricular fibrillation. Nature. 1998 March;392:293–6. doi: 10.1038/32675. [DOI] [PubMed] [Google Scholar]
- 19.Gouas L, Nicaud V, Berthet M, Forhan A, Tiret L, Balkau B, Guicheney P. Association of KCNQ1, KCNE1, KCNH2 and SCN5A polymorphisms with QTc interval length in a healthy population. Eur J Hum Genet. 2005 November;13:1213–22. doi: 10.1038/sj.ejhg.5201489. [DOI] [PubMed] [Google Scholar]
- 20.Bezzina CR, Shimizu W, Yang P, Koopmann TT, Tanck MW, Miyamoto Y, Kamakura S, Roden DM, Wilde AA. Common sodium channel promoter haplotype in Asian subjects underlies variability in cardiac conduction. Circulation. 2006 January 24;113:338–44. doi: 10.1161/CIRCULATIONAHA.105.580811. [DOI] [PubMed] [Google Scholar]
- 21.Tan BH, Valdivia CR, Rok BA, Ye B, Ruwaldt KM, Tester DJ, Ackerman MJ, Makielski JC. Common human SCN5A polymorphisms have altered electrophysiology when expressed in Q1077 splice variants. Heart Rhythm. 2005 July;2:741–7. doi: 10.1016/j.hrthm.2005.04.021. [DOI] [PubMed] [Google Scholar]
- 22.Makielski JC, Ye B, Valdivia CR, Pagel MD, Pu J, Tester DJ, Ackerman MJ. A ubiquitous splice variant and a common polymorphism affect heterologous expression of recombinant human SCN5A heart sodium channels. Circ Res. 2003 October 31;93:821–8. doi: 10.1161/01.RES.0000096652.14509.96. [DOI] [PubMed] [Google Scholar]
- 23.Splawski I, Timothy KW, Tateyama M, Clancy CE, Malhotra A, Beggs AH, Cappuccio FP, Sagnella GA, Kass RS, Keating MT. Variant of SCN5A sodium channel implicated in risk of cardiac arrhythmia. Science. 2002 August 23;297:1333–6. doi: 10.1126/science.1073569. [DOI] [PubMed] [Google Scholar]
- 24.Plant LD, Bowers PN, Liu Q, Morgan T, Zhang T, State MW, Chen W, Kittles RA, Goldstein SA. A common cardiac sodium channel variant associated with sudden infant death in African Americans, SCN5A S1103Y. J Clin Invest. 2006 February;116:430–5. doi: 10.1172/JCI25618. [DOI] [PMC free article] [PubMed] [Google Scholar]
- 25.Van Norstrand DW, Tester DJ, Ackerman MJ. Overrepresentation of the proarrhythmic, sudden death predisposing sodium channel polymorphism S1103Y in a population-based cohort of African-American sudden infant death syndrome. Heart Rhythm. 2008 May;5:712–5. doi: 10.1016/j.hrthm.2008.02.012. [DOI] [PMC free article] [PubMed] [Google Scholar]
- 26.Ford ES, Li C, Zhao G, Pearson WS, Capewell S. Trends in the prevalence of low risk factor burden for cardiovascular disease among United States adults. Circulation. 2009 September 29;120:1181–8. doi: 10.1161/CIRCULATIONAHA.108.835728. [DOI] [PubMed] [Google Scholar]
- 27.Rosamond WD, Chambless LE, Folsom AR, Cooper LS, Conwill DE, Clegg L, Wang CH, Heiss G. Trends in the incidence of myocardial infarction and in mortality due to coronary heart disease, 1987 to 1994. N Engl J Med. 1998 September 24;339:861–7. doi: 10.1056/NEJM199809243391301. [DOI] [PubMed] [Google Scholar]
- 28.Crook ED, Taylor H. Traditional and nontraditional risk factors for cardiovascular and renal disease in African Americans (Part 2): a project of the Jackson Heart Study investigators. Am J Med Sci. 2003 June;325:305–6. doi: 10.1097/00000441-200306000-00001. [DOI] [PubMed] [Google Scholar]
- 29.Reich DE, Cargill M, Bolk S, Ireland J, Sabeti PC, Richter DJ, Lavery T, Kouyoumjian R, Farhadian SF, Ward R, Lander ES. Linkage disequilibrium in the human genome. Nature. 2001 May 10;411:199–204. doi: 10.1038/35075590. [DOI] [PubMed] [Google Scholar]
- 30.Lohmueller KE, Indap AR, Schmidt S, Boyko AR, Hernandez RD, Hubisz MJ, Sninsky JJ, White TJ, Sunyaev SR, Nielsen R, Clark AG, Bustamante CD. Proportionally more deleterious genetic variation in European than in African populations. Nature. 2008 February 21;451:994–7. doi: 10.1038/nature06611. [DOI] [PMC free article] [PubMed] [Google Scholar]
- 31.Bush WS, Crawford DC, Alexander C, George AL, Jr, Roden DM, Ritchie MD. Genetic variation in the rhythmonome: ethnic variation and haplotype structure in candidate genes for arrhythmias. Pharmacogenomics. 2009 June;10:1043–53. doi: 10.2217/pgs.09.67. [DOI] [PMC free article] [PubMed] [Google Scholar]
- 32.Wilson JG, Rotimi CN, Ekunwe L, Royal CD, Crump ME, Wyatt SB, Steffes MW, Adeyemo A, Zhou J, Taylor HA, Jr, Jaquish C. Study design for genetic analysis in the Jackson Heart Study. Ethn Dis. 2005;15:S6–37. [PubMed] [Google Scholar]
- 33.Campbell-Jenkins BW, Addison CC, Young L, Anugu P, Wilson G, Sarpong D. Development of the Jackson Heart Study Coordinating Center. Int J Environ Res Public Health. 2009 May;6:1597–608. doi: 10.3390/ijerph6051597. [DOI] [PMC free article] [PubMed] [Google Scholar]
- 34.Carpenter MA, Crow R, Steffes M, Rock W, Heilbraun J, Evans G, Skelton T, Jensen R, Sarpong D. Laboratory, reading center, and coordinating center data management methods in the Jackson Heart Study. Am J Med Sci. 2004 September;328:131–44. doi: 10.1097/00000441-200409000-00001. [DOI] [PubMed] [Google Scholar]
- 35.Deo RC, Reich D, Tandon A, Akylbekova E, Patterson N, Waliszewska A, Kathiresan S, Sarpong D, Taylor HA, Jr, Wilson JG. Genetic differences between the determinants of lipid profile phenotypes in African and European Americans: the Jackson Heart Study. PLoS Genet. 2009 January;5:e1000342. doi: 10.1371/journal.pgen.1000342. [DOI] [PMC free article] [PubMed] [Google Scholar]
- 36.Patterson N, Hattangadi N, Lane B, Lohmueller KE, Hafler DA, Oksenberg JR, Hauser SL, Smith MW, O’Brien SJ, Altshuler D, Daly MJ, Reich D. Methods for high-density admixture mapping of disease genes. Am J Hum Genet. 2004 May;74:979–1000. doi: 10.1086/420871. [DOI] [PMC free article] [PubMed] [Google Scholar]
- 37.Purcell S, Neale B, Todd-Brown K, Thomas L, Ferreira MA, Bender D, Maller J, Sklar P, de Bakker PI, Daly MJ, Sham PC. PLINK: a tool set for whole-genome association and population-based linkage analyses. Am J Hum Genet. 2007 September;81:559–75. doi: 10.1086/519795. [DOI] [PMC free article] [PubMed] [Google Scholar]
- 38.Pendergrass SA, Dudek S, Crawford DCC, Ritchie M. Synthesis-View: visualization and interpretation of SNP association results for multi-cohort, multi-phenotype data and meta-analysis. BioData Mining. 2010 doi: 10.1186/1756-0381-3-10. In press. [DOI] [PMC free article] [PubMed] [Google Scholar]
- 39.Barrett JC, Fry B, Maller J, Daly MJ. Haploview: analysis and visualization of LD and haplotype maps. Bioinformatics. 2005 January 15;21:263–5. doi: 10.1093/bioinformatics/bth457. [DOI] [PubMed] [Google Scholar]
- 40.Smith JG, Lowe JK, Kovvali S, Maller JB, Salit J, Daly MJ, Stoffel M, Altshuler DM, Friedman JM, Breslow JL, Newton-Cheh C. Genome-wide association study of electrocardiographic conduction measures in an isolated founder population: Kosrae. Heart Rhythm. 2009 May;6:634–41. doi: 10.1016/j.hrthm.2009.02.022. [DOI] [PMC free article] [PubMed] [Google Scholar]
- 41.Newton-Cheh C, Guo CY, Wang TJ, O’Donnell CJ, Levy D, Larson MG. Genome-wide association study of electrocardiographic and heart rate variability traits: the Framingham Heart Study. BMC Med Genet. 2007;8(Suppl 1):S7. doi: 10.1186/1471-2350-8-S1-S7. [DOI] [PMC free article] [PubMed] [Google Scholar]
- 42.Newton-Cheh C, Eijgelsheim M, Rice KM, de Bakker PI, Yin X, Estrada K, Bis JC, Marciante K, Rivadeneira F, Noseworthy PA, Sotoodehnia N, Smith NL, Rotter JI, Kors JA, Witteman JC, Hofman A, Heckbert SR, O’Donnell CJ, Uitterlinden AG, Psaty BM, Lumley T, Larson MG, Stricker BH. Common variants at ten loci influence QT interval duration in the QTGEN Study. Nat Genet. 2009 April;41:399–406. doi: 10.1038/ng.364. [DOI] [PMC free article] [PubMed] [Google Scholar]
- 43.Newton-Cheh C, Guo CY, Larson MG, Musone SL, Surti A, Camargo AL, Drake JA, Benjamin EJ, Levy D, D’Agostino RB, Sr, Hirschhorn JN, O’Donnell CJ. Common genetic variation in KCNH2 is associated with QT interval duration: the Framingham Heart Study. Circulation. 2007 September 4;116:1128–36. doi: 10.1161/CIRCULATIONAHA.107.710780. [DOI] [PubMed] [Google Scholar]
- 44.Newton-Cheh C, Shah R. Genetic determinants of QT interval variation and sudden cardiac death. Curr Opin Genet Dev. 2007 June;17:213–21. doi: 10.1016/j.gde.2007.04.010. [DOI] [PubMed] [Google Scholar]
- 45.Holm H, Gudbjartsson DF, Arnar DO, Thorleifsson G, Thorgeirsson G, Stefansdottir H, Gudjonsson SA, Jonasdottir A, Mathiesen EB, Njolstad I, Nyrnes A, Wilsgaard T, Hald EM, Hveem K, Stoltenberg C, Lochen ML, Kong A, Thorsteinsdottir U, Stefansson K. Several common variants modulate heart rate, PR interval and QRS duration. Nat Genet. 2010 February;42:117–22. doi: 10.1038/ng.511. [DOI] [PubMed] [Google Scholar]
Associated Data
This section collects any data citations, data availability statements, or supplementary materials included in this article.