

Abstract
Background and Aims
The size and composition of seed reserves may reflect the ecological strategy and evolutionary history of a species and also temporal variation in resource availability. The seed mass and composition of seed reserves of 19 co-existing tree species were studied, and we examined how they varied among species in relation to germination and seedling growth rates, as well as between two years with contrasting precipitation (652 and 384 mm).
Methods
Seeds were collected from a tropical deciduous forest in the northwest of Mexico (Chamela Biological Station). The seed dry mass, with and without the seed coat, and the concentrations of lipids, nitrogen and non-structural carbohydrates for the seed minus seed coat were determined. The anatomical localization of these reserves was examined using histochemical analysis. The germination capacity, rate and lag time were determined. The correlations among these variables, and their relationship to previously reported seedling relative growth rates, were evaluated with and without phylogenetic consideration.
Key Results
There were interannual differences in seed mass and reserve composition. Seed was significantly heavier after the drier year in five species. Nitrogen concentration was positively correlated with seed coat fraction, and was significantly higher after the drier year in 12 species. The rate and lag time of germination were negatively correlated with each other. These trait correlations were also supported for phylogenetic independent contrasts. Principal component analysis supported these correlations, and indicated a negative association of seedling relative growth rate with seed size, and a positive association of germination rate with nitrogen and lipid concentrations.
Conclusions
Nitrogen concentration tended to be higher after the drier year and, while interannual variations in seed size and reserve composition were not sufficient to affect interspecific correlations among seed and seedling traits, some of the reserves were related to germination variables and seedling relative growth rate.
Keywords: Germination, seed reserves, seedling growth, tropical deciduous forest
INTRODUCTION
The size and composition of seed reserves are expected to vary among species in relation to their ecological strategies for seed dispersal and seedling establishment (Fenner and Thompson, 2006). Seed reserves may also play a role in the seed's permanence in soil banks and its susceptibility to predation (Hoshizaki and Miguchi, 2005; Rajjou and Debeaujon, 2008). Young seedlings depend on the availability of stored reserves in seeds, such as carbohydrate, lipids, storage protein and other mineral nutrients, until seedlings become established (Fenner, 1983; Kitajima, 2002; Hanley et al., 2004; Kitajima and Myers, 2008). While many workers have explored the relationships of seed size to seed dispersal and seedling recruitment strategies (e.g. Moles and Westoby, 2006), seed reserve composition has been quantified for only a small number of species in relation to ecological characteristics (Levin, 1974; Ichie et al., 2001; Finkelstein and Grubb, 2002). The composition of these maternally endowed resources may vary in relation to the environmental conditions experienced by the mother plant (Gutterman, 1980); little is known about how environmental conditions can affect multiple co-existing species (Violle et al., 2009). Furthermore, little is known about how seed reserves are distributed within seeds, even though such information could be useful in taxonomical identification and help to understand water imbibition characteristics of the embryo (Shepherd et al., 2005).
Seed size may reflect various aspects of plant life histories and reproductive ecology (Marañon and Grubb, 1993; Fenner and Thompson, 2006; Moles and Leishman, 2008). Seed size is considered to be traded-off with seed number in relation to the relative importance of seedling establishment vs. dispersal (Ezoe, 1998; Muller-Landau, 2010). The advantage of seed size for seedling establishment has been shown repeatedly in shaded environments (Poorter and Rose, 2005), but seed size advantage for survival in a dry environment is equivocal (Leishman and Westoby, 1994). Seed size is often negatively correlated with seedling relative growth rate (RGR) across species (e.g. Fenner, 1983; Huante et al., 1995; Paz et al., 2005; Poorter and Rose, 2005), but not necessarily within species. Furthermore, seedling morphology, cotyledon functions and biomass allocation patterns also affect seedling growth rates (e.g. Marañon and Grubb, 1993; Kitajima, 1994; Baraloto and Forget, 2007). All these traits are known to exhibit significant phylogenetic signals and constraints (Ibarra-Manríquez et al., 2001; Zanne et al., 2005). Patterns of utilizing different components of seed reserves also need to be considered in relation to germination strategies and early seedling growth (Suda and Giorgini, 2000; Ichie et al., 2001).
Carbohydrates, lipids and storage proteins represent the bulk of seed reserves. Early nitrogen (N) mobilization from storage protein is necessary to meet the amino acid demands during the initial stages of germination. Among mineral nutrients, N is the first to become depleted from the seed (Fenner, 1983; Kitajima, 2002). In most species, seed N concentration has been related to protein concentration (Ezeagu et al., 2002), with the mass ratio of protein to amino acid typically ranging between 4 and 6 in plants (Pate et al., 1986; Ezeagu et al., 2002; Rajjou and Debeaujon, 2008). However, for most non-crop species, it is not known whether enrichment of lipids and N may be distributed unevenly between the embryo and surrounding nutritional tissues (endosperm and perisperm if present).
Lipids, structural carbohydrates, and non-structural carbohydrates (NSCs) are critical in supporting seedling growth until the seedlings become established (Levin, 1974; Ichie et al., 2001; Kitajima, 2002). Each of these reserves provides a different energetic contribution to seedling development (Kitajima and Myers, 2008). On a per mass basis, lipids contain more than twice the energy stored in NSCs or proteins, but they pose a significant risk of oxidation and loss of seed viability (McDonald, 2004) and are less efficient for energy retrieval through mitochondrial respiration (Kitajima, 1996). Furthermore, lipids and N make seeds more attractive to potential seed predators, and thus could lead to evolution of enhanced protection with a hard seed coat (Grubb et al., 1998; Finkelstein and Grubb, 2002).
The size and composition of seed reserves also vary temporally and spatially in relation to maternal environmental conditions, such as water availability, incident radiation, environmental temperature, and the amount and availability of nutrients (Gutterman, 1980; Drenovsky and Richards, 2005). Seasonal ecosystems, such as tropical deciduous forests (TDFs), experience strong seasonal and interannual variations in precipitation, which affect photosynthetic production and other ecosystem processes. For example, wet-season precipitation affects soil moisture and the amount of nutrients released from litter decomposition (García-Oliva et al., 2003). Species may be affected differently by precipitation variation from year to year (Bullock and Solis-Magallanes, 1990).
Due to the importance in the life of a plant, seed and seedling traits have been considered part of their overall life history strategy (Moles and Leishman, 2008). To understand the role of seed reserves in the first stages of life history, 19 co-existing tree species from a highly seasonal TDF on the northwest coast of Mexico were studied. To examine the effects of precipitation on seed size and reserve composition, seeds produced during two years with different amounts of total precipitation (652 mm in 2004 and 384 mm in 2005) were sampled. We then analysed how interspecific variations in seed size and concentration of N, lipids and NSCs are related to germination rate and lag time, and seedling RGR (previously reported by Huante et al., 1995; Huante and Rincón, 1998; González, 2002; Soriano, 2003). The aim of the study was to answer the following specific questions. (a) Do species particularly rich in N, lipids or NSCs exhibit differences in the localization of these reserves within seed? (b) Do seed dry mass and reserve concentrations (N, lipids and NSCs) differ between the two years with contrasting precipitation? (c) Are the concentrations of N, lipids and NSCs significantly correlated with the seed dry mass, the dry mass of embryo plus endosperm and/or perisperm if present, or with the seed coat mass fraction? (d) Are lag time and rate of germination related to the seed dry mass or to the composition of the reserves? (e) Is early seedling RGR (determined in earlier experiments) related to seed dry mass and reserve composition? (f) Are there significant phylogenetic effects on correlations among these seed and seedling traits?
MATERIALS AND METHODS
Plant material
Seeds were collected in 2005 and 2006 from the TDF within the Biological Station of Chamela (19°30′N, 105°03′W) on the northwest coast of Mexico. The site is characterized by a marked seasonal climate with an average annual temperature of 24·9 °C and a mean annual precipitation of 788 mm (1977–2003), 80 % of which falls between July and October (Bullock, 1986). The annual precipitation immediately prior to seed collection (2004 and 2005) was 652 and 384 mm, respectively. The mature seeds of 19 tree species (Table 1) were collected directly from at least ten trees per species during the dry season (November–May) when seeds of these, and the many other species, are dispersed (Bullock and Solis-Magallanes, 1990). The same fruiting trees were used in both years.
Table 1.
List of the studied species (nomenclature in accordance with Lott, 2002): seed storage tissue, germination speed (based on germination rate and lag time), cotyledon type and seedling light requirements.
| Species | Family | Storage tissue | Germination | Cotyledon type | Seedling light requirements |
|---|---|---|---|---|---|
| 1. Crescentia alata | Bignoniaceae | C5 | F | PEPh | SH3 |
| 2. Tabebuia rosea | Bignoniaceae | C5 | F | PEPh | SH3 |
| 3. Ceiba pentandra | Bombacaceae | C-ET5 | S | PEPh | FH1 |
| 4. Cochlospermum vitifolium | Cochlospermaceae | C-ET5 | F | PEPh | SH2 |
| 5. Ipomoea wolcottiana | Convolvulaceae | C5 | F | PEPh | SH2 |
| 6. Acacia farnesiana | Fabaceae | C | S | PEPh | SH1 |
| 7. Acacia sp. | Fabaceae | C | S | PEPh | SH3 |
| 8. Apoplanesia paniculata | Fabaceae | C5 | S | PEPh | SH2 |
| 9. Caesalpinia coriaria | Fabaceae | C | F | PEPh | SH1 |
| 10. Caesalpinia eriostachys | Fabaceae | C5 | S | PEPh | FH2 |
| 11. Caesalpinia platyloba | Fabaceae | C5 | F | PEPh | FH2 |
| 12. Enterolobium cyclocarpum | Fabaceae | C5 | S | PEPh | FH1 |
| 13. Lonchocarpus eriocarinalis | Fabaceae | C5 | S | PEPh | FH3 |
| 14. Pithecellobium dulce | Fabaceae | C | F | CrHR | FH3 |
| 15. Gyrocarpus jatrophifolius | Hernandiaceae | C | S | PEPh | FH3 |
| 16. Swietenia humilis | Meliaceae | C | F | CrHR | FH4 |
| 17. Coccoloba barbadensis | Polygonaceae | C-ET5 | S | PEPh | FH1 |
| 18. Ruprechtia fusca | Polygonaceae | C-ET5 | S | PEPh | SH1 |
| 19. Hintonia latiflora | Rubiaceae | C-ET5 | F | PEPh | SH1 |
C, cotyledon; ET, extra-embryonic tissue; F, fast; S, slow; PEPh, phanerocotylar, epigeal, photosynthetic; CrHR, cryptocotylar, hypogeal, reserve storage; SH, strict heliophyte; FH, facultative heliophyte.
1Huante et al. (1995); 2Huante and Rincón (1998); 3González (2002); 4Soriano (2003); 5Hernández (2006).
Qualitative and quantitative characterization of seed reserves
For the purpose of this study, seed is defined in the strict botanical sense: an embryo (embryonic axis and cotyledons) and extra-embryonic tissues (endosperm and/or perisperm) if present, enclosed by the seed coat. Seed mass included all these structures. The seed species of this study were enclosed only by the seed coat and not by any additional maternal tissues (J. Márquez-Guzmán, pers. obs.). Dry mass of individual seeds (n = 30 per species) was determined before and after removing the seed coat. To characterize seed structure and reserve location, a qualitative histochemical analysis was conducted following the methods of López-Curto et al. (2005) in six of the 19 species collected in 2006 (Acacia farnesiana, Acacia sp., Caesalpinia coriaria, Gyrocarpus jatrophifolius, Pithecellobium dulce and Swietenia humilis). The other 13 species had been previously studied by Hernández (2006). The presence and absence of extra-embryonic tissues and the location of protein, lipids, NSCs and structural carbohydrate were examined qualitatively after differential staining of these compounds.
To quantify N, lipids and NSCs, seed coats were removed from additional seeds, and at least 30 embryos plus extra-embryonic tissues (hereafter the combination of the two structures are referred to as EETs) were combined to make a replicate (three replicates per species per year). EET was dried at 55 °C to constant weight. The combined dry masses of EET were pulverized in a Micromill (Scienceware, Bel-Art Products, Pequannock, NJ, USA). Lipid concentration was determined by the Soxhlet extraction method, using ethylic-ether as a solvent (J. T. Baker, Phillipsburg, NJ, USA) following Ichie et al. (2001). NSC concentration was determined with the phenol–sufuric acid method (Dubois et al., 1956), using anhydrous dextrose (J. T. Baker) and the N concentration was quantified with an elemental analyser (NC 2500; Thermo Quest S.P.A., Rodanao, Milan, Italy) as described in Neagle et al. (2005). The equipment was calibrated with a standard curve obtained with sulfanilamide (C, 41·84 %; H, 4·68 %; N, 16·27 %; O, 18·58 %; and S, 18·62 %) (CE Elantech, Inc., Lakewood, NJ, USA). Reserve concentrations were expressed as the percentage of the EET dry mass.
Germination tests
To determine the germination capacity, germination rate and lag time (time to initiate germination) of each species, germination tests were conducted for seeds of the 19 species collected in 2006 (three replicates per species, 30 seeds per replicate). The seeds were germinated in a growth chamber (Lab-Line, Lab-Line Instruments, Inc., Melrose Park, IL, USA) at 25–30 °C, 12/12 h light/dark. Previous studies have shown that the highest germination percentage of tropical species is achieved in this temperature range (Orozco-Segovia and Sánchez-Coronado, 2009). Prior to germination tests, impermeable seed coats were treated with H2SO4 (98 %) to break physical dormancy, using the minimum scarification time to allow seed water uptake, which was identified in a preliminary test following the recommendation of Baskin and Baskin (1998). The minimum scarification time for each species was determined to be as follows: A. farnesiana and Acacia sp., 60 min; Enterolobium cyclocarpum, 50 min; Caesalpinia platyloba and Ipomoea wolcottiana, 30 min; Cochlospermum vitifolium, 20 min; and C. coriaria, 5 min.
Cumulative germination was fitted to exponential sigmoid curves following arcsine transformation of percentages. The maximum first derivative of the exponential sigmoid curve was considered as the germination rate. Lag time is the interval of time (on the x-axis) in which the value along the y axis was zero, the time needed to initiate germination (González-Zertuche et al., 2001; Fig. 1). Analysis of these germination variables included the values calculated for each replication.
Fig. 1.

Per species and replicate, exponential sigmoid curves were fitted to the cumulative germination plotted against time prior to arcsine transformation. Lag time is the interval of time (on the x-axis) during which the value along the y-axis was zero [the time needed to initiate germination (1)]. The maximum first derivative was considered as the germination rate (2) and the maximum germination achieved (3). Germination curve of (A) Acacia spp. and (B) Coccoloba barbadensis.
RGR values for the 19 species were taken from Huante et al. (1995), Huante and Rincón (1998), González (2002) and Soriano (2003). In all these experiments plants were sown in the growing season (May–October), using seeds collected in the Chamela Biological Station, and all seedlings were raised to similar ages (56–60 d old). In these experiments photosynthetic active radiation at midday varied between 1100 and 1200 µmol m−2 s−1, and temperature at midday varied between 35 and 33 °C. Three of these studies used the same substrate (6 g kg−1, Osmocote 14-14-14, sand) while the other used 2 g kg−1 of Osmocote 14-14-14, 2 soil:1 sand.
Data analysis
The interannual and interspecific differences in dry mass of the seed and of the EET and reserve concentrations were analysed with a two-way multivariate analysis of variance (MANOVA) with year and species as the main effects (P < 0·05). Tukey's test was used to calculate the post-hoc comparisons (P < 0·05). These statistical analyses were carried out using Statistica 6·0 (StatSoft, Tulsa, OK, USA). Differences in reserve composition (lipids, N and NSCs) between Fabaceae and non-Fabaceae species were examined with an ANOVA; species was a factor nested within the two groups in both years using JMP 8·0 (SAS Institute Inc., Cary, NC, USA). Simple linear regression analysis was used to test the relationships between germination rate and N, and RGR and EET dry mass using the program Table Curve 2D v3 (AISN, Software, Chicago, IL, USA). For dry mass of EET, lipids, seed coat and N and germination rate and lag time, we calculated phylogenetic independent contrasts (PICs) to assess phylogenetic signals (phylogenetic relatedness for trait values) and PIC correlations, using the programs PHYLOMATIC and PHYLOCOM Analysis of Trait Module (Webb et al., 2009).
A variance test was used to assess the degree of phylogenetic signal (i.e. whether trait values are more similar for closely related taxa than expected) through 1000 randomizations of traits across the tips. The significance of PIC correlations was assessed with the non-parametric sign test, because of the uniform branch length assumption. Pearson correlation was used to examine univariate relationships between the same traits analysed with PIC correlations and for the relationships of dry mass of seeds, EET and reserves between years. Graphical presentations of the relationships shown in PIC and Pearson correlation were made using Table Curve. Additionally, after log and square transformations to achieve normal distribution, principal component analysis (PCA) was used to examine multivariate relationships among EET, ratio of seed coat to EET, N concentration, ratio of lipid to NSCs (as a variable to represent relative lipid enrichment in energy reserves), and RGR. A cluster analysis was carried out using germination variables (Ward's method using Euclidean distances). These were done with the program Statistica 6·0.
RESULTS
Seed reserve location in different tissues
Histochemical examination confirmed that the cotyledons were the main storage tissues (Table 1, Fig. 2). However, C. coriaria seeds featured a remnant of EET (probably residual endosperm) around the radicle axis (Fig. 2C3). Reserves occurred mostly inside discrete cellular structures (e.g. protein bodies or lipid bodies), which were not distributed uniformly within the seed (Fig. 2). The embryonic axes tended to have a greater concentration of cytoplasmic inclusions, while cells in the cotyledons were filled with protein bodies, lipid bodies, starch and non-soluble polysaccharides. The relatively nitrogen-rich seeds of the two Acacia species and C. coriaria showed differences in the density of non-soluble polysaccharides (Fig. 2A3, B3, C2). Starch body distributions were different in size among these species and Pithecellobium (Fig. 2A3, B3, C2 and D2, respectively). Gyrocarpus seeds had polysaccharides stored in their thick cell walls (Fig. 2E3). Swietenia was the species with the highest concentration of lipids (Fig. 2F).
Fig. 2.

Seed structure (column 1) of six species, shown as longitudinal or transversal sections relative to the embryo axis. Letter labels indicate cell wall polysaccharides (CWP), cotyledonary cells (C), embryonic axis (EA), lipid bodies (LB), non-soluble polysaccharides (NSP), protein bodies (PB) and starch (S). In B1, C1, D1 and E1 the cell walls and cytoplasmic structures are stained green and red, respectively. Open ovals indicate the cotyledonary region for which the magnified images with specific staining are shown (columns 2 and 3). In A1 and F1, non-soluble polysaccharides are stained. Rows A and B show Acacia sp. and Acacia farnesiana which have relatively high N contents (Table 3) and conspicuous protein bodies (A2 and B2). In these species starch and NSP were abundant too (A3 and B3). Rows C and D show seeds of Caesalpinia coriaria and Pithecellobium dulce for which reserve bodies for starch and non-soluble polysaccharides (C2 and D2) represent their main reserve. Caesalpinia coriaria seeds showed remnants of extra-embryonic tissue around the embryonic axis (C3, expanded from the zone indicated by a rectangle in C1). Pithecellobium has lipids as a secondary reserve (D3). Row E and F show Gyrocarpus jatrophifolius and Swietenia humilis with relatively high lipid concentration (E2 and F2). Gyrocarpus has a relatively low concentration of NSCs (Table 3), but starch and cell wall polysaccharides are still clearly detectable (E3). Swietenia has one of the lowest concentrations of N, but the appearance of protein bodies (F3) was similar to species with higher N concentration (A2, B2).
Seed dry mass
Seed and EET dry mass showed significant effects of species, year and species × year interaction (Appendices 1, 2). According to the post-hoc comparison, five of the 19 species had significantly heavier seeds following the drier year (produced in 2005, and sampled in 2006), whereas the opposite was true for one species and the remaining 13 species showed no significant difference between years (Table 2, Appendix 1). Similarly, EET dry mass was higher in the drier year in three species, the opposite in one species, and non-significant for the rest (Table 2, Appendix 2). Despite significant interannual variations, seed and EET dry mass were highly correlated with each other and between the two years (log-transformed species means, Pearson correlation coefficient, r > 0·99).
Table 2.
Average dry mass (mg) of seeds and embryos plus extra-embryonic tissue (EET) in 2005 and 2006 (n = 30 seeds, means ± s.e.)
| Seeds |
EET |
|||
|---|---|---|---|---|
| Species | 2005 | 2006 | 2005 | 2006 |
| 1. Crescentia alata | 47·9 ± 1·9 | <54·2 ± 3 | 32·2 ± 0·7 | 23·5 ± 0·1 |
| 2. Tabebuia rosea | 44·6 ± 2·3 | 41·1 ± 3·1 | 35·2 ± 1·2 | 28·1 ± 1·1 |
| 3. Ceiba pentandra | 52·9 ± 4·5 | <75·2 ± 0·6 | 44·4 ± 0·7 | 47·4 ± 0·7 |
| 4. Cochlospermum vitifolium | 27·3 ± 0·7 | 35·7 ± 1·1 | 11·1 ± 0·2 | 15·4 ± 0·4 |
| 5. Ipomoea wolcottiana | 62·3 ± 1·9 | 61·4 ± 1·6 | 35·3 ± 0·8 | 30·9 ± 0·5 |
| 6. Acacia farnesiana | 75·4 ± 2·2 | 81·0 ± 2·4 | 30·3 ± 0·8 | 35·7 ± 0·7 |
| 7. Acacia sp. | 38·9 ± 2·1 | 50·9 ± 2·2 | 12·5 ± 0·3 | 20·5 ± 0·3 |
| 8. Apoplanesia paniculata | 5·0 ± 0·3 | 5·7 ± 0·1 | 2·2 ± 0·1 | 3·0 ± 0·1 |
| 9. Caesalpinia coriaria | 50·6 ±2·7 | 55·3 ± 2·4 | 20·1 ± 0·6 | 22·3 ± 0·5 |
| 10. Caesalpinia eriostachys | 246·7 ± 5·5 | 247·2 ± 7·0 | 152·0 ± 3·1 | 159·1 ± 2·9 |
| 11. Caesalpinia platyloba | 241·1 ± 6·3 | <325·4 ± 7·8 | 116·0 ± 1·8 | <145·2 ± 1·9 |
| 12. Enterolobium cyclocarpum | 717·8 ± 36·1 | <1085·0 ± 26·9 | 516·4 ± 14·7 | <543·3 ± 13·3 |
| 13. Lonchocarpus eriocarinalis | 507·3 ± 26·3 | 519·2 ± 8·9 | 234·9 ± 6·3 | <352·3 ± 9·9 |
| 14. Pithecellobium dulce | 192·0 ± 6·7 | <221·1 ± 4·3 | 123·6 ± 3·1 | 119·0 ± 2·2 |
| 15. Gyrocarpus jatrophifolius | 369·3 ± 18·2 | 357·5 ± 6·9 | 180·4 ± 4·8 | 189·5 ± 3·6 |
| 16. Swietenia humilis | 550·4 ± 7·9 | >440·2 ± 4·3 | 470·1 ± 11·1 | >423·3 ± 17·7 |
| 17. Coccoloba barbadensis | 116·1 ± 5·8 | 136·6 ± 4·3 | 49·1 ± 1·2 | 64·9 ± 2·7 |
| 18. Ruprechtia fusca | 22·2 ± 0·9 | 24 ± 0·6 | 17·3 ± 0·3 | 16·7 ± 0·3 |
| 19. Hintonia latiflora | 1·6 ± 0·1 | 1·6 ± 0·1 | 1·1 ± 0·1 | 1·3 ± 0·1 |
The signs (< or >) between the values indicate the direction of a significant difference between the two years (P < 0·05).
Seed reserve partitioning
The relative contribution of lipids, NSCs and N to EET mass varied widely and could be ordered into a continuum of differences between species (Fig. 3, Table 3). The main reserve in Enterolobium, Ruprechtia fusca and Pithecellobium was NSCs (>67 %), whereas in Ceiba pentandra, Crescentia alata and Swietenia, lipids were >40 % of the EET dry mass. Nitrogen concentration also differed greatly among species: Coccoloba barbadensis had the lowest N concentration (<1·5 %) and Acacia sp. had the highest (>11 %). Species in the Fabaceae had a somewhat elevated N concentration on average, with means for nine Fabaceae species being 6·4 and 7·3 % in 2005 and 2006, respectively, compared with means for non-Fabaceae of 4·1 and 5·0 % (P < 0·05 with the F-test). However, the concentration of N varied substantially within families and genera, and within the genus Caesalpinia, C. coriaria had a higher concentration of N than C. platyloba and C. eriostachys. The concentration of the other reserves also differed between Fabaceae and non-Fabaceae species. Species in the Fabaceae had a lower concentration of lipid (16·5 %, 2005; 17·0 %, 2006) compared with non-Fabaceae (32·0 %, 2005; 29·5 %, 2006). Lipid and NSC concentrations were negatively correlated, but independently from the concentration of N (P < 0·05).
Fig. 3.

Concentration of lipids, non-structural carbohydrates (NSCs) and nitrogen (N) in seeds of the 19 studied species, collected in (A) 2005 and (B) 2006. Species are grouped according to their lipid content in 2005. Fabaceae species are underlined. The numbers correspond to the species shown in Table 1.
Table 3.
Percentage of lipids, N and non-structural carbohydrates (NSCs) in the two years the studied lasted: the values are means of three independent determinations.
| Lipids |
N |
NSCs |
||||
|---|---|---|---|---|---|---|
| Species | 2005 | 2006 | 2005 | 2006 | 2005 | 2006 |
| 1. Crescentia alata | 47·2 | 43·8 | 5·9 | 6·3 | 19·8 | 28·5 |
| 2. Tabebuia rosea | 37·2 | 36·6 | 2·9 | <4·0 | 67·1 | 62·0 |
| 3. Ceiba pentandra | 40·2 | 41·6 | 5·7 | <6·5 | 35·4 | 29·0 |
| 4. Cochlospermum vitifolium | 40·9 | >32·1 | 4·6 | <5·7 | 43·2 | 52·8 |
| 5. Ipomoea wolcottiana | 19·3 | >13·7 | 5·8 | <6·9 | 60·5 | 56·1 |
| 6. Acacia farnesiana | 7·5 | 6·4 | 8·4 | 8·4 | 55·2 | 64·5 |
| 7. Acacia sp. | 7·8 | 6·1 | 9·2 | <11·0 | 58·1 | 54·1 |
| 8. Apoplanesia paniculata | 8·0 | 8·2 | 5·6 | 6·1 | 52·8 | 64·1 |
| 9. Caesalpinia coriaria | 6·7 | 8·9 | 8·1 | <9·9 | 48·1 | 55·9 |
| 10. Caesalpinia eriostachys | 34·9 | 33·4 | 5·2 | <6·0 | 55·1 | 55·3 |
| 11. Caesalpinia platyloba | 26·8 | <32·9 | 5·1 | <6·2 | 60·4 | >37·3 |
| 12. Enterolobium cyclocarpum | 9·8 | <3·6 | 6·3 | <7·9 | 70·3 | 73·6 |
| 13. Lonchocarpus eriocarinalis | 30·6 | 34·1 | 5·7 | 5·2 | 49·6 | 49·6 |
| 14. Pithecellobium dulce | 16·8 | 19·7 | 4·1 | <4·9 | 81·2 | 72·2 |
| 15. Gyrocarpus jatrophifolius | 33·6 | 30·7 | 6·2 | <8·3 | 38·9 | 37·5 |
| 16. Swietenia humilis | 67·7 | 67·9 | 3·1 | 2·9 | 22·8 | 29·2 |
| 17. Coccoloba barbadensis | 3·9 | 4·3 | 0·8 | 1·1 | 84·4 | >66·5 |
| 18. Ruprechtia fusca | 4·5 | 4·3 | 2·7 | <5·1 | 68·0 | 76·0 |
| 19. Hintonia latiflora | 25·5 | >19·8 | 3·4 | 3·7 | 60·0 | 60·2 |
The signs (< or >) between the values indicate the direction of a significant difference between the two years (P < 0·05).
Species, year and species × year interaction were all significant in MANOVA with concentration of N, lipids and NSCs as dependent variables (Table 4), even though seed reserve composition was highly correlated between 2005 and 2006 across species (r = 0·94 for N, r = 0·98 for lipids, r = 0·84 for NSCs). In 12 of the 19 species, seeds produced in the drier year and collected in 2006 had a significantly greater concentration of N than those collected in 2005. Four of the 19 species showed a significantly lower lipid concentration in seeds collected in 2006 than in 2005, and for one species the opposite was observed. Two of the 19 species had lower concentrations of NSC in seeds that were collected in 2006 than in 2005 (Table 3).
Table 4.
MANOVA for the two years (2005, 2006) and 19 studied species for the three reserves (lipids, N and NSCs).
| Effect | Wilks | d.f. | F | P |
|---|---|---|---|---|
| Year | 0·125 | 3 | 171·13 | <0·001 |
| Species | <0·001 | 54 | 266·72 | <0·001 |
| Year × species | 0·014 | 54 | 13·07 | <0·001 |
EET dry mass was positively correlated with lipid concentration in both studied years (Table 5, Fig. 4). No significant bivariate correlation was found between seed dry mass and N or NSCs, and EET dry mass and N or NSCs. Dry mass allocated to the seed coat in both years had a positive correlation with the N concentration (Table 5, Fig. 5).
Table 5.
Pearson correlation coefficients for 19 species means (r) and 16 phylogenetic independent contrasts (rPIC) for the relationships tested with 2006 data
| Trait pairs | r | P | rPIC | P |
|---|---|---|---|---|
| EET dry mass vs. lipids | 0·68 | 0·002 | 0·44 | <0·05 |
| Seed coat vs. N | 0·78 | <0·001 | 0·45 | <0·05 |
| Germination rate vs. lag time | –0·88 | 0·001 | –0·39 | <0·07 |
Fig. 4.

Graphical representation of embryo plus extra-embryonic tissue (EET) dry mass and lipid concentration correlation in seeds collected in (A) 2005 and (B) 2006. The tendency line is shown for the 19 species and to Fabaceae species (open circles, dotted line). The numbers correspond to the species shown in Table 1. Species 12 was categorized as an outlier by the analysis.
Fig. 5.

Graphical representation of the correlation of dry mass allocated to the seed coat and N in seeds collected in (A) 2005 and (B) 2006. The tendency line is shown for the 19 species and to Fabaceae species (open circles, dotted line). The numbers correspond to the species shown in Table 1. Species 17 was categorized as an outlier by the analysis.
Germination, EET, reserve composition and RGR
The germination ranged from 22 % (in Cochlospermum) to 100 % (in C. eriostachys, Appendix 3). Germination of 18 of the 19 species occurred during the first 14 d; the exception was Apoplanesia paniculata, which had a lag time of 63 d (Appendix 3). Germination rate and lag time were negatively correlated (Table 5, Fig. 6). Two groups were recognized by cluster analysis, namely species with fast and slow germination rates (Figs 7 and 8). In these two groups, germination rate had a positive relationship with seed N concentration (fast-germination group r2 = 0·62, P = 0·00003, n = 9; and slow-germination group r2 = 0·65, P = 0·000002, n = 9).
Fig. 6.
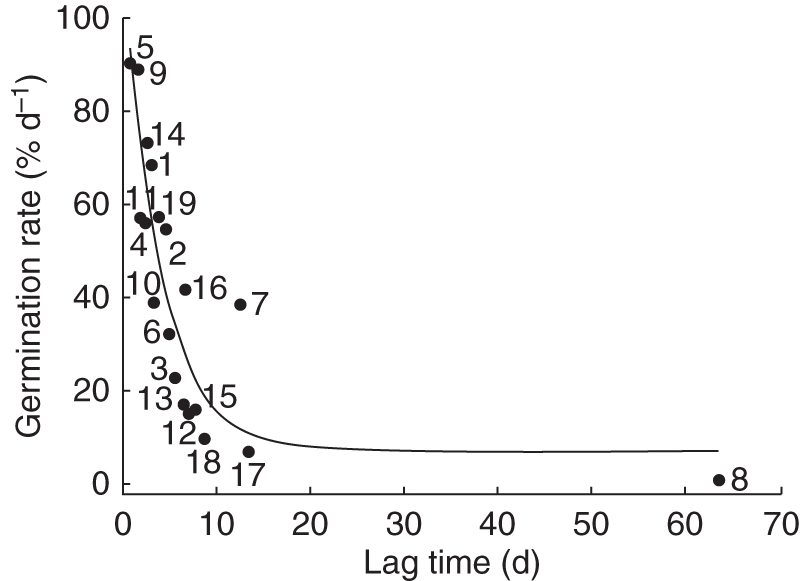
Graphical representation of correlation between germination rate and lag time for the seeds of the 19 species collected in 2006. The tendency line is shown. The numbers correspond to the species shown in Table 1.
Fig. 7.
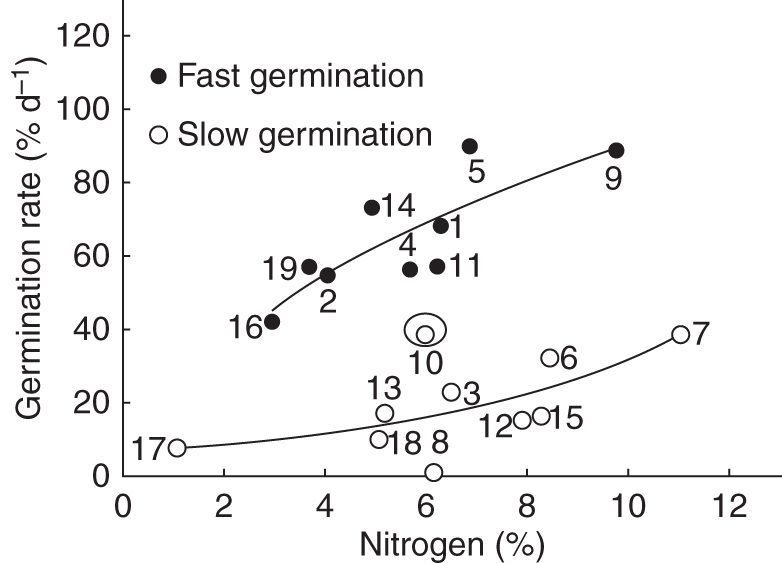
Relationship between seed nitrogen concentration and germination rate in fast-germination (y = –44·7 + 62·9x0·331) and slow-germination (y = 0·71 + 5·35 exp(–x/–5·69)) species. Species 10 was categorized as an outlier by the analysis. The data are for seeds collected in 2006. The numbers correspond to the species shown in Table 1.
Fig. 8.
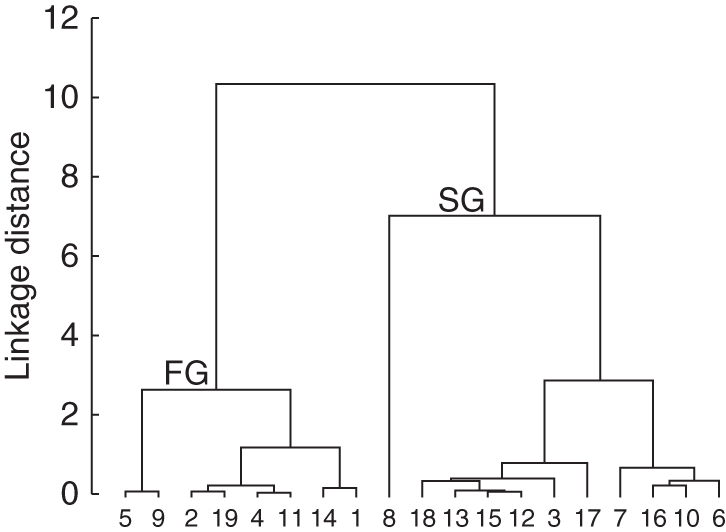
Dendogram of the cluster analysis. The cluster supports the division according to germination rate and lag time. Fast germination (FG) and slow germination (SG).
The RGR of the seedlings of the studied species had a significant negative relationship with the dry mass of EET in both years (Fig. 9A, B). However, there was no significant bivariate correlation of seedling RGR with concentration of N, lipids, NSCs, germination rate or lag time.
Fig. 9.

Relationship between log EET (2005 and 2006) and relative growth rate (RGR), (y = 0·12–0·008x and y = 0·12–0·008x in 2005 and 2006, respectively). Species 19 was considered to be an outlier by the analysis. The numbers correspond to the species shown in Table 1.
Principal component analysis showed the direction of association of EET, N, germination rate, seed coat/EET, lipids/NSCs and RGR (Fig. 10, Appendix 4). Principal component analysis factor 1 was contributed by negative loading of N concentration, seed coat to EET ratio, and seedling RGR, followed by positive loading of EET dry mass. These indicate that larger seeds tended to have a lower concentration of N, lower biomass allocation to seed coat and slower RGR. Principal component analysis factor 2 was strongly contributed by positive loading of germination rate and the lipid to NSC ratio, followed by positive loading of RGR. Thus, lipid and NSC varied independently of N concentration, and lipid-rich seeds tended to germinate faster. Principal component analysis factor 3 mainly reflected the negative loading of seed content mass, N concentration and germination rate, and the positive loading of seedling RGR.
Fig. 10.
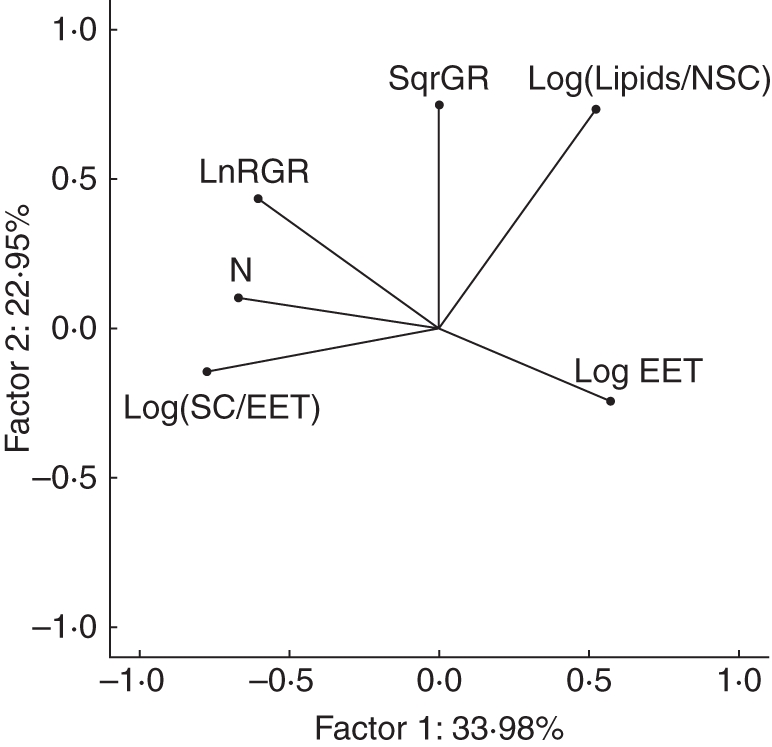
Principal component analysis showed the direction of association of embryo plus extra-embryonic tissue (EET), N, germination rate (GR), seed coat (SC)/EET, lipids/NSCs and RGR. Factor 1 was contributed by negative loading of the concentration of N, seed coat ratio and seedling RGR, followed by positive loading of EET dry mass. Factor 2 was strongly contributed by positive loading of the germination rate and lipid to NSC ratio, followed by positive loading of RGR.
Phylogenetic independent contrasts
The significant cross-species correlations between seed reserves, EET dry mass, seed coat, lag time and germination rate were also tested using PICs. The PIC correlations were weaker, but in the same direction as the corresponding non-PIC correlations (Table 5). The correlation between seed coat dry mass and N concentration, and the correlation between germination rate and lag time, remained significant (P < 0·05), while the correlation between EET dry mass and concentration of lipids was marginally significant (P < 0·07) according to the statistically conservative sign test. Among these variables, the phylogenetic signal was significant only for lipids concentration, which reflected clustering of lipid-rich taxa (Ceiba, Cochlospermum and Swietenia) and lipid-poor species (Coccoloba and Ruprechtia). Despite the previously mentioned tendency for a higher N concentration in the Fabaceae than in non-Fabaceae taxa, N concentration did not exhibit a significant phylogenetic signal across the tree.
DISCUSSION
The identity of the main source of nutrients (lipids, N and NSCs) is highly important in the life history of plant species (Fenner, 1983). The main reserves varied among species but they were stored mainly in the cotyledons, which were phanerocotylar in most species. In the studied species, cotyledons turned photosynthetic in a few days, giving an advantage in seasonal environments for seedlings to establish and grow (Kitajima, 2002). Our results showed that interannual differences in precipitation were related to differences in the composition of reserves from one year to another. Interannual differences in N concentration were negatively correlated with precipitation during the rainy season in 14 species. A higher N concentration may attract predators, and thus require defence traits to protect seeds (Grubb et al., 1998) and, in support of this, the species with a high seed concentration of N showed a proportional increase in the dry mass allocation to the seed coat. Lipids have been associated with large seeds and slow seedling RGRs, which are traits associated with stress persistence strategies including shade tolerance in tropical trees (Poorter and Rose, 2005). Our results confirm these relationships and, in addition, a significant phylogenetic signal was detected only for lipid concentration in seeds.
Qualitative analyses of seed reserves
Overall, the distribution patterns of major reserves, such as starch, proteins and lipids, showed few obvious differences among taxa. In addition, in two of the studied species, C. coriaria and Gyrocarpus, the polysaccharides present in the thick cell walls may be an important potential reserve, as has been documented for other species (Buckeridge et al., 2000). In Ruprechtia, Coccoloba, Hintonia, Cochlospermum and Ceiba, the presence of EETs has been previously reported (Hernández, 2006). The role of EETs in seed ageing and during germination and early seedling growth should be tested in the future. The main reserve contained in this tissue is starch, whose hardening has been related to loss of viability (Probert et al., 2009).
Interannual differences in seed dry mass and reserve partitioning
In TDFs, soil nutrient availability depends on the previous growing season (García-Oliva et al., 2003). There was a large difference in total precipitation in the years prior to seed collection (652 mm in 2004 and 384 mm in 2005). However, higher precipitation did not necessarily result in larger seeds. The most consistent trend in the allocation of reserves was observed for the interannual differences in seed N concentrations, which was significantly higher following the dry year in 12 of the 19 species, while lipid and NSC concentrations showed much weaker and inconsistent differences between the two years. Nitrogen is known to be an important determinant of maternal effects in seeds (Drenovsky and Richards, 2005). There may be physiological effects of drought and associated environmental factors on seed production (Breen and Richards, 2008). A post-flowering water deficit can lead to an increase in seed N concentration in maize (Takele and Farrant, 2010) and to an increase in the thickness of the seed cover in several species (Wulff, 1995).
Reserves, dry mass and seed coat
There was a positive relationship between EET dry mass and concentration of lipids in the two years of testing. Larger seeds have been related to larger seedlings and to a higher probability of seedling survival (Poorter and Rose, 2005). However, a relationship between reserves and seedling growth has rarely been reported (Ichie et al., 2001; Finkelstein and Grubb, 2002). A higher concentration of lipids may be a complementary strategy to enhance total energy availability to seedlings (Levin, 1974; Finkelstein and Grubb, 2002). The relationship between lipid concentration and EET dry mass was mainly observed in Fabaceae species; in fact, lipid concentration was the unique variable that showed a significant phylogenetic signal. In contrast, neither Fabaceae nor non-Fabaceae species showed a significant relationship between NSCs or N and EET dry mass. The functionality and the ecological role of lipids in Fabaceae species ought to be assessed with a number of other species.
As predicted by Grubb et al. (1998), greater investment in the seed coat was observed in seeds with high N contents. An investment for the protection of EET could be beneficial even if not all N in the seeds is allocated to proteins or amino acids, which are of potential value to predators (Pate et al., 1986; Grubb et al., 1998; Ezeagu et al., 2002).
In the TDF, the seeds of A. farnesiana, Acacia sp., C. coriaria and C. platyloba are dispersed at the beginning of the dry season (Bullock and Solis-Magallanes, 1990) and the seeds remain in the soil for at least 8 months (dry season). A thick and impermeable seed coat also facilitates deeper physical dormancy in these species, which might represent a strategy for longer persistence in the soil seed bank (Baskin and Baskin, 1998). The characterization of the chemical defence and rates of predation in the studied species could clarify the relationship between reserves and seed protection, as suggested by Finkelstein and Grubb (2002).
Reserve composition and germination
In 18 of the 19 species studied, germination began within the first 14 d. Short germination lag times have been considered an evolutionary response to maximize seedling growth during the short rainy season in TDFs (Garwood, 1983; Khurana and Singh, 2001). In Chamela, rapid canopy closure in the early rainy season (Bullock and Solis-Magallanes, 1990) may favour rapid germination and seedling establishment before the light availability diminishes in the understorey. Seed dry mass did not have a significant relationship with germination rate or with lag time, contrary to the positive relationship reported in the literature (Norden et al., 2009). However, the generality of the relationship between seed size and germination rate and lag time has been questioned previously (Orozco-Segovia and Sánchez-Coronado, 2009).
In this study, germination rate was negatively correlated with lag time (Fig. 6), as is the case for other species (Rodríguez et al., 2000). In the studied species, the germination rate was faster in species with higher N (Fig. 7). This may be associated with a faster mobilization rate of reserves (Lieffering et al., 1996). Furthermore, differences in reserve concentration from one year to the next may be related to differences in germination; thus, it would be helpful to explore in more detail the differences in species germination performance over the years.
RGR, seed dry mass and reserves
The EET dry mass had a negative relationship with RGR in both years, as has been previously recorded for entire seed of the species from the study area (Huante et al., 1995) and for other rain forest species (Paz et al., 2005; Poorter and Rose, 2005). This relationship was maintained when we considered the RGR values reported for the same species in different studies, such as Cochlospermum (Huante et al., 1995; Huante and Rincón, 1998; Soriano, 2003). Hintonia was an outlier in this regression analysis (Fig. 9), which suggested the need to study a greater number of species to explore the RGRs of seeds with smaller dry masses than those considered in this study.
In our study, germination rate and lag time were not good predictors of seedling RGR. A fast germination rate did not imply fast seedling growth. This observation supports the idea that species ontogenetic shifts in functional strategy occcur (Orozco-Segovia and Sanchez-Coronado, 2009).
Reserves and seedling growth
Early seedling growth should be related to cotyledon type, the composition of reserves and the use of these reserves (Ichie et al., 2001, Kitajima and Myers, 2008). In the studied species we observed a continuum in reserve partitioning. At one extreme, Swietenia had seeds with a high concentration of lipids, and cryptocotylar and hypogeal seedlings, with reserve storage cotyledons. Its seedlings are characterized as facultative heliophytes (Table 1) and are slow growing (the classification of rates of growth were taken from Huante et al., 1995). Many rain forest climax species typically have fatty seeds (Whitmore, 1990). Levin (1974) hypothesized that a higher lipid content in a seed is a possible advantage for seedling establishment in shaded environments, but the results were not conclusive (Ichie et al., 2001; Finkelstein and Grubb, 2002). At the other extreme, A. farnesiana had seeds with a high content of NSCs; it is a fast growing species, with phanerocotylar epigeal seedlings, photosynthetic cotyledons and strict heliophyte seedlings, which is in contrast to Swietenia.
Between these extremes, we can place the fast-growing species, Crescentia, Ceiba and Tabebuia, which had seeds rich in lipids and with strict-heliophyte seedlings. In these species, stored lipids could promote fast growth (Finkelstein and Grubb, 2002). A study of the use and translocation of reserves during germination and early seedling growth, using species with a wide range of reserve compositions and cotyledons of different forms and functions, will clarify how reserves are used in fast- and slow-growing species in response to the seasonal light and water stress that characterize the TDFs (Barradas, 1991) and lead to different strategies of seedling establishment.
Conclusions
In this study, the reserve compositions of seeds of 19 species could be ordered along a continuum. Relative abundance of major seed reserves was related to EET dry mass, lag time, germination rate and seed coat mass. Differences in reserve composition and probably in their use by the embryo, in combination with environmental variability (an unpredictable precipitation pattern in the rainy season; Bullock, 1986), may play an important role in promoting species co-existence in the changing environment of the TDF. The minimal effects of phylogeny could suggest an ecological convergence in seed reserve composition among these TDF species.
Future research in this study area should assess whether changes occur in seed reserves while seeds are in the seed bank and whether these are related to (a) the ecological and potential seed viability or (b) the mobilization of reserves during burial and its effect on germination. Both may provide information about seedling fate and the relevance of the first life stages of plants in the permanence and the population dynamics of these species in the ecosystems, as Moles and Leishman (2008) suggest.
ACKNOWLEDGEMENTS
We thank Posgrado en Ciencias Biológicas-UNAM and the Chamela Biology Station (IB-UNAM) for the use of their research facilities and for providing logistical support. We also thank Irma Acosta Calixto, María Esther Sánchez Coronado, Alejandro González Ponce, Erick Daniel Valle Vidal, María de Lourdes López Curto and the Microcine Lab F. Ciencias UNAM for their technical assistance. Gustavo Verduzco, Karen Suárez, Itzel Sánchez and Jorge Blanco of great help with the seed processing. We are grateful to the two anonymous reviewers for the comments and suggestions that allowed a substantial improvement to the paper. This work was supported by Dirección General de Asuntos del Personal Académico-UNAM [IN 232802-3]; National Science Foundation [DEB 9981607] and Consejo Nacional de Ciencia y Tecnología [PhD scholarship 187210 to Diana Soriano].
APPENDIX 1
Interannual and interspecies comparison of seeds dry mass
| Source of variation | d.f. | SS | MS | F | P |
|---|---|---|---|---|---|
| Year | 1 | 73 252·7 | 73 252·7 | 37·6 | <0·001 |
| Species | 18 | 40 025 239·8 | 2 223 624·4 | 1142·2 | <0·001 |
| Year × species | 18 | 1 506 362·4 | 83 686·8 | 43 | <0·001 |
| Residual | 676 | 1 315 987·2 | 1946·7 | ||
| Total | 713 | 43 227 210·1 | 60 627·2 |
Comparisons for factor: year (2006 vs. 2005) within species (P < 0·05).
| Species | t | P |
|---|---|---|
| 1. Crescentia alata | 3·4 | <0·01 |
| 2. Tabebuia rosea | 0·3 | 0·81 |
| 3. Ceiba pentandra | 1·5 | 0·15 |
| 4. Cochlospermum vitifolium | 0·6 | 0·56 |
| 5. Ipomoea wolcottiana | 0·1 | 0·95 |
| 6. Acacia farnesiana | 0. 4 | 0·69 |
| 7. Acacia sp. | 0·8 | 0·41 |
| 8. Apoplanesia paniculata | 0·1 | 0·97 |
| 9. Caesalpinia coriaria | 0·3 | 0·79 |
| 10. Caesalpinia eriostachys | 0·2 | 0·85 |
| 11. Caesalpinia platyloba | 5·5 | <0·01 |
| 12. Enterolobium cyclocarpum | 26·4 | <0·01 |
| 13. Lonchocarpus eriocarinalis | 1·0 | 0·34 |
| 14. Pithecellobium dulce | 2·1 | 0·04 |
| 15. Gyrocarpus jatrophifolius | 0·8 | 0·41 |
| 16. Swietenia humilis | 8·0 | <0·01 |
| 17. Coccoloba barbadensis | 1·1 | 0·30 |
| 18. Ruprechtia fusca | 0·1 | 0·90 |
| 19. Hintonia latiflora | 0·0 | 1·00 |
APPENDIX 2
Interannual and interspecies comparison of EET dry mass
| Source of variation | d.f. | SS | MS | F | P |
|---|---|---|---|---|---|
| Year | 1 | 16 225·2 | 16 225·2 | 19·5 | <0·001 |
| Species | 18 | 20 795 866·9 | 1 155 325·9 | 1387·8 | <0·001 |
| Year × species | 18 | 2 10 102·9 | 11 672·4 | 14·0 | <0·001 |
| Residual | 918 | 7 64 233·3 | 832·5 | ||
| Total | 955 | 22 423 636 | 23 480·3 |
Comparisons for factor: year (2006 vs. 2005) within species (P < 0·05)
| Species | t | P |
|---|---|---|
| 1. Crescentia alata | 1·1 | 0·28 |
| 2. Tabebuia rosea | 0·9 | 0·37 |
| 3. Ceiba pentandra | 0·3 | 0·73 |
| 4. Cochlospermum vitifolium | 0·5 | 0·62 |
| 5. Ipomoea wolcottiana | 0·5 | 0·59 |
| 6. Acacia farnesiana | 0·7 | 0·51 |
| 7. Acacia sp. | 0·9 | 0·36 |
| 8. Apoplanesia paniculata | 0·1 | 0·92 |
| 9. Caesalpinia coriaria | 0·3 | 0·80 |
| 10. Caesalpinia eriostachys | 0·9 | 0·36 |
| 11. Caesalpinia platyloba | 3·7 | <0·01 |
| 12. Enterolobium cyclocarpum | 3·2 | <0·01 |
| 13. Lonchocarpus eriocarinalis | 14·2 | <0·01 |
| 14. Pithecellobium dulce | 0·6 | 0·54 |
| 15. Gyrocarpus jatrophifolius | 1·0 | 0·33 |
| 16. Swietenia humilis | 5·9 | <0·01 |
| 17. Coccoloba barbadensis | 1·9 | 0·06 |
| 18. Ruprechtia fusca | 0·0 | 0·99 |
| 19. Hintonia latiflora | 0·1 | 0·97 |
APPENDIX 3
Means (± s.e.) of lag time (LT), germination rate (GR) and maximum germination percentage (GM) of seeds collected in 2006
| Species | LT (d) | GR (% d−1) | GM (%) |
|---|---|---|---|
| 1. Crescentia alata | 3·08 ± 0·18 | 68·29 ± 2·62 | 71·65 ± 1·23 |
| 2. Tabebuia rosea | 4·69 ± 0·23 | 54·41 ± 0·54 | 92·10 ± 4·49 |
| 3. Ceiba pentandra | 5·69 ± 0·17 | 22·76 ± 1·03 | 68·94 ± 3·92 |
| 4. Cochlospermum vitifolium | 2·46 ± 0·06 | 56·02 ± 1·53 | 22·67 ± 3·21 |
| 5. Ipomoea wolcottiana | 0·82 ± 0·12 | 90·00 ± 1·76 | 94·44 ± 2·31 |
| 6. Acacia farnesiana | 5·02 ± 0·47 | 32·09 ± 1·17 | 78·78 ± 3·26 |
| 7 Acacia sp. | 12·55 ± 1·02 | 38·49 ± 1·33 | 96·66 ± 3·57 |
| 8. Apoplanesia paniculata | 63·59 ± 2·35 | 0·78 ± 0·02 | 45·01 ± 2·93 |
| 9. Caesalpinia coriaria | 1·70 ± 0·12 | 88·64 ± 1·14 | 82·77 ± 6·69 |
| 10. Caesalpinia eriostachys | 3·48 ± 0·30 | 38·91 ± 0·69 | 100·0 |
| 11. Caesalpinia platyloba | 1·97 ± 0·15 | 57·04 ± 1·02 | 47·79 ± 3·36 |
| 12. Enterolobium cyclocarpum | 7·05 ± 0·25 | 15·05 ± 0·69 | 91·43 ± 3·39 |
| 13. Lonchocarpus eriocarinalis | 6·48 ± 0·32 | 16·96 ± 0·67 | 93·03 ± 1·92 |
| 14. Pithecellobium dulce | 2·68 ± 0·24 | 73·00 ± 0·67 | 96·54 ± 1·11 |
| 15. Gyrocarpus jatrophifolius | 7·85 ± 0·08 | 15·99 ± 2·58 | 71·12 ± 4·99 |
| 16. Swietenia humilis | 6·74 ± 0·19 | 41·67 ± 2·63 | 81·12 ± 5·14 |
| 17. Coccoloba barbadensis | 13·51 ± 0·55 | 6·87 ± 0·75 | 47·70 ± 4·62 |
| 18. Ruprechtia fusca | 8·75 ± 0·25 | 9·69 ± 0·85 | 71·70 ± 2·22 |
| 19. Hintonia latiflora | 3·93 ± 0·02 | 57·12 ± 0·86 | 68·83 ± 2·79 |
APPENDIX 4
Eigenvalues of PCA
| Factor | Eigenvalue | Cumulative | % Total | Cumulative |
|---|---|---|---|---|
| 1 | 2·0 | 2·0 | 34·0 | 34·0 |
| 2 | 1·4 | 3·4 | 22·9 | 56·9 |
| 3 | 1·2 | 4·7 | 20·7 | 77·6 |
| 4 | 0·7 | 5·4 | 12·1 | 89·7 |
| 5 | 0·4 | 5·8 | 6·5 | 96·2 |
| 6 | 0·2 | 6·0 | 3·8 | 100·0 |
Factor coordinates of the variables [embryo plus extra embrionary tissues (EET)], nitrogen (N), germination rate (GR), seed coat fraction (SC)
| Factor 1 | Factor 2 | Factor 3 | |
|---|---|---|---|
| LogEET | 0·57 | –0·24 | –0·65 |
| N | –0·68 | 0·11 | –0·55 |
| SqrGR | –0·01 | 0·75 | –0·42 |
| log(SC/EET) | –0·78 | –0·14 | –0·38 |
| Log(lipids/NSCs) | 0·52 | 0·73 | –0·05 |
| LnRGR | –0·62 | 0·44 | 0·45 |
LITERATURE CITED
- Baraloto C, Forget PM. Seed size, seedling morphology, and response to deep shade and damage in neotropical rain forest trees. American Journal of Botany. 2007;94:901–911. doi: 10.3732/ajb.94.6.901. [DOI] [PubMed] [Google Scholar]
- Barradas VL. Radiation regime in a tropical dry deciduous forest in western Mexico. Theoretical and Applied Climatology. 1991;44:57–64. [Google Scholar]
- Baskin JM, Baskin CC. Seeds. Ecology, biogeography, and evolution of dormancy and germination. San Diego: Academic Press; 1998. [Google Scholar]
- Breen AN, Richards JH. Irrigation and fertilization effects on seed number, size, germination and seedling growth: implications for desert shrub establishment. Oecologia. 2008;157:13–19. doi: 10.1007/s00442-008-1049-3. [DOI] [PubMed] [Google Scholar]
- Buckeridge MS, Pessoa DSH, Tiné MA. Mobilisation of storage cell wall polysaccharides in seeds. Plant Physiology and Biochemistry. 2000;38:141–156. [Google Scholar]
- Bullock SH. Climate of Chamela, Jalisco, and trends in the south coastal region of Mexico. Archives of Meteorology, Geophysics and Bioclimatology. 1986;36:297–316. [Google Scholar]
- Bullock SH, Solis-Magallanes JA. Phenology of canopy trees of a tropical deciduous forest. Biotropica. 1990;22:22–35. [Google Scholar]
- Dubois M, Gilles KA, Hamilton JK, Rebers PA, Smith F. Colorimetric method for determination of sugars and related substances. Analytical Chemistry. 1956;28:350–356. [Google Scholar]
- Drenovsky RE, Richards JH. Nitrogen addition increases fecundity in the desert shrub, Sarcobatus vermiculatus. Oecologia. 2005;143:349–356. doi: 10.1007/s00442-004-1821-y. [DOI] [PubMed] [Google Scholar]
- Ezeagu IE, Petzke JK, Metges CC, Akinsoyinu AO, Ologhobo AD. Seed protein contents and nitrogen-to-protein conversion factors for some uncultivated tropical plant seeds. Food Chemistry. 2002;78:105–109. [Google Scholar]
- Ezoe H. Optimal dispersal range and seed size in a stable environment. Journal of Theoretical Biology. 1998;190:287–293. doi: 10.1006/jtbi.1997.0553. [DOI] [PubMed] [Google Scholar]
- Fenner M. Relationships between seed weight, ash content and seedling growth in twenty-four species of Compositae. New Phytologist. 1983;95:697–706. [Google Scholar]
- Fenner M, Thompson K. The ecology of seeds. London: Cambridge University Press; 2006. [Google Scholar]
- Finkelstein S, Grubb PJ. Lipid concentration in the embryo-endosperm fraction of seed of Australian tropical lowland rainforest tree: relevance to defence and dispersal. Seed Science Research. 2002;12:173–180. [Google Scholar]
- García-Oliva F, Sveshtarova B, Oliva M. Seasonal effects on soil organic carbon dynamics in a tropical deciduous forest ecosystem in western Mexico. Journal of Tropical Ecology. 2003;19:179–188. [Google Scholar]
- Garwood N. Seed germination in a seasonal tropical forest in Panama: a community study. Ecological Monographs. 1983;53:159–181. [Google Scholar]
- González DG. Restauración de la Selva Baja Caducifolia en la Reserva de biosfera Chamela-Cuixmala, Jalisco: un enfoque experimental usando comunidades sintéticas. 2002 Professional Thesis, Universidad Nacional Autónoma de México. México. [Google Scholar]
- González-Zertuche L, Vázquez-Yanes C, Gamboa A, Sánchez-Coronado ME, Aguilera P, Orozco-Segovia A. Natural priming of Wigandia urens seeds during burial: effects on germination, growth and protein expression. Seed Science Research. 2001;11:27–34. [Google Scholar]
- Grubb PJ, Metcalfe DJ, Grubb EAA, Jones GD. Nitrogen-richness and protection of seeds in Autralian tropical rainforests: a test of plant defence theory. Oikos. 1998;82:467–482. [Google Scholar]
- Gutterman Y. Influences on seed germinability: phenotypic maternal effects during seed maturation. Israel Journal of Botany. 1980;29:105–117. [Google Scholar]
- Hanley ME, Fenner M, Whibley H, Darvil B. Early plant growth: identifying the end point of the seedling phase. New Phytologist. 2004;163:61–66. doi: 10.1111/j.1469-8137.2004.01094.x. [DOI] [PubMed] [Google Scholar]
- Hernández PV. Reservas en semillas y su papel en las primeras etapas de desarrollo de especies leñosas de selva baja caducifolia. 2006 Masters Thesis, Universidad Nacional Autónoma de México, México. [Google Scholar]
- Hoshizaki K, Miguchi H. Influence of forest composition on tree seed predation and rodent response: a comparison of monodominant and mixed temperate forest in Japan. In: Forget PM, Lambert JE, Hulme PE, Vander Wall SB, editors. Seed fate. Predation, dispersal and seedling establishment. Wallingford, UK: CABI Publishing; 2005. pp. 253–267. [Google Scholar]
- Huante P, Rincón E. Responses to light changes in tropical deciduous woody seedlings with contrasting growth rates. Oecologia. 1998;113:53–66. doi: 10.1007/s004420050353. [DOI] [PubMed] [Google Scholar]
- Huante P, Rincón E, Acosta I. Nutrient availability and growth rate of 34 woody species from a tropical deciduous forest in Mexico. Functional Ecology. 1995;9:849–858. [Google Scholar]
- Ibarra-Manríquez G, Martínez-Ramos M, Oyama K. Seedling functional types in a lowland rain forest in Mexico. American Journal of Botany. 2001;88:1801–1812. [PubMed] [Google Scholar]
- Ichie T, Ninomiya I, Ogino K. Utilization of seed reserves during germination and early seedling growth by Dryobalanops lanceolata (Dipterocarpaceae) Journal of Tropical Ecology. 2001;17:371–378. [Google Scholar]
- Khurana E, Singh JS. Ecology of seed and seedling growth for conservation and restoration of tropical dry forest: a review. Environmental Conservation. 2001;28:39–52. [Google Scholar]
- Kitajima K. Relative importance of photosynthetic traits and allocation patterns as correlates of seedling shade tolerance of 13 tropical trees. Oecologia. 1994;98:419–428. doi: 10.1007/BF00324232. [DOI] [PubMed] [Google Scholar]
- Kitajima K. Cotyledon functional morphology, patterns of seed reserve utilization and regeneration niches of tropical tree seedlings. In: Swaine MD, editor. The ecology of tropical forest tree seedlings. Carnforth, UK: Parthenon; 1996. pp. 193–210. [Google Scholar]
- Kitajima K. Do shade-tolerant tropical tree seedlings depend longer on seed reserves? Functional growth analysis of three Bignoniaceae species. Functional Ecology. 2002;16:433–444. [Google Scholar]
- Kitajima K, Myers JA. Seedling ecophysiology; strategies toward achievement of positive net carbon balance. In: Leck MA, Parker TV, Simpson RL, editors. Seedling ecology and evolution. Cambridge: Cambridge University Press; 2008. pp. 172–188. [Google Scholar]
- Leishman MR, Westoby M. The role of large seed size in shaded conditions – experimental evidence. Functional Ecology. 1994;8:205–214. [Google Scholar]
- Levin DA. The oil content of seeds: an ecological perspective. American Naturalist. 1974;108:193–206. [Google Scholar]
- Lieffering M, Andrews M, Mckenzie BA. Nitrate stimulation of mobilization of seed reserves in temperate cereals: importance of water uptake. Annals of Botany. 1996;78:695–701. [Google Scholar]
- López-Curto ML, Márquez GJ, Murguia SG. Técnicas para el estudio del desarrollo de angiospermas. México: Facultad de Ciencias, UNAM; 2005. [Google Scholar]
- Lott EJ. Lista anotada de las plantas vasculares de Chamela-Cuixmala. In: Noguera FA, Vega-Rivera AN, García A, Quesada-Avendaño M, editors. Historia natural de Chamela. México: Instituto de Biología-UNAM; 2002. pp. 99–136. [Google Scholar]
- Marañon T, Grubb PJ. Physiological basis and ecological significance of the seed size and relative growth rate relationship in Mediterranean annuals. Functional Ecology. 1993;7:591–599. [Google Scholar]
- McDonald MB. Orthodox seed deterioration and its repair. In: Benech-Arnold RL, Sánchez RA, editors. Handbook of seed physiology. Applications to agriculture. New York: The Haworth Press; 2004. pp. 273–304. [Google Scholar]
- Moles AT, Leishman MR. The seedling as part of a plant's life history strategy. In: Leck MA, Parker TV, Simpson RL, editors. Seedling ecology and evolution. Cambridge: Cambridge University Press; 2008. pp. 217–238. [Google Scholar]
- Moles AT, Westoby M. Seed size and plant strategy across the whole life cycle. Oikos. 2006;113:91–105. [Google Scholar]
- Muller-Landau H. The tolerance–fecundity trade-off and the maintenance of diversity in seed size. Proceedings of the National Academy of Sciences, USA. 2010;107:4242–4247. doi: 10.1073/pnas.0911637107. [DOI] [PMC free article] [PubMed] [Google Scholar]
- Neagle ER, Burton JW, Carter TE, Rufty TW. Influence of seed nitrogen content on seedling growth and recovery from nitrogen stress. Plant and Soil Journal. 2005;271:328–340. [Google Scholar]
- Norden N, Daws MI, Antoine C, Gonzalez MA, Garwood NC, Chave J. The relationship between seed mass and mean time to germination for 1037 tree species across five tropical forests. Functional Ecology. 2009;23:203–210. [Google Scholar]
- Orozco-Segovia A, Sánchez-Coronado ME. Functional diversity in seeds and its implications for ecosystem functionality and restoration ecology. In: Gamboa-de Buen A, Orozco-Segovia A, Cruz-Garcia F, editors. Functional diversity of plant reproduction. Kerala, India: Research Signpost; 2009. pp. 195–236. [Google Scholar]
- Pate JS, Rasins E, Rullo J, Kuo J. Seed nutrient reserves of Proteaceae with special reference to protein bodies and their inclusions. Annals of Botany. 1986;57:747–770. [Google Scholar]
- Paz H, Mazar SJ, Martínez-Ramos M. Comparative ecology of seed mass in Psychotria (Rubiaceae): within and between species effects of seed mass on early performance. Functional Ecology. 2005;19:707–718. [Google Scholar]
- Poorter L, Rose S. Light-dependent changes in the relationship between seed mass and seedling traits: a metaanalysis for rain forest tree species. Oecologia. 2005;14:378–387. doi: 10.1007/s00442-004-1732-y. [DOI] [PubMed] [Google Scholar]
- Probert RJ, Daws MI, Hay FR. Ecological correlates of ex situ seed longevity: a comparative study on 195 species. Annals of Botany. 2009;104:57–69. doi: 10.1093/aob/mcp082. [DOI] [PMC free article] [PubMed] [Google Scholar]
- Rajjou L, Debeaujon I. Seed longevity: survival and maintenance of high germination ability of dry seeds. Compte Rendues Biologiques. 2008;331:796–805. doi: 10.1016/j.crvi.2008.07.021. [DOI] [PubMed] [Google Scholar]
- Rodríguez MC, Orozco-Segovia A, Sánchez-Coronado ME, Vázquez-Yanes C. Seed germination of six mature neotropical rain forest species in response to dehydration. Tree Physiology. 2000;20:693–699. doi: 10.1093/treephys/20.10.693. [DOI] [PubMed] [Google Scholar]
- Shepherd KA, Macfarlane TD, Colmer TD. Morphology, anatomy and histochemistry of Salicornioideae (Chenopodiaceae) fruits and seeds. Annals of Botany. 2005;95:917–933. doi: 10.1093/aob/mci101. [DOI] [PMC free article] [PubMed] [Google Scholar]
- Soriano FD. Importancia de la Tasa de Asimilación Neta, el Área Foliar Específica, el Cociente de Peso Foliar en la determinación de la Tasa Relativa de Crecimiento de 5 especies arbóreas de la Selva Tropical Caducifolia de Chamela Jalisco. 2003 Professional Thesis, Benemérita Universidad Autónoma de Puebla, México. [Google Scholar]
- Suda CNK, Giorgini JF. Seed reserve composition and mobilization during germination and initial seedling development of Euphorbia heterophylla. Revista Brasileña de Fisiología Vegetal. 2000;12:226–244. [Google Scholar]
- Takele A, Farrant J. Seed germination and storage reserves of maize and sorghum after exposure to and recovery from pre- and post-flowering dehydration. Acta agronomica hungarica. 2010;58(133–142) [Google Scholar]
- Violle C, Castro H, Richarte J, Navas ML. Intraspecific seed trait variations and competition: passive or adaptive response? Functional Ecology. 2009;23:612–620. [Google Scholar]
- Webb CO, Ackerly DD, Kembel SW. Phylocom: software for the analysis of phylogenetic community structure and character evolution. Bioinformatics. 2009;24:2098–2100. doi: 10.1093/bioinformatics/btn358. [DOI] [PubMed] [Google Scholar]
- Whitmore TC. An introduction to tropical rain forest. Oxford: Oxford University Press; 1990. [Google Scholar]
- Wulff RD. Environmental maternal effects on seed quality and germination. In: Kigel J, Galili G, editors. Seed development and germination. New York: Marcel Dekker; 1995. pp. 491–504. [Google Scholar]
- Zanne AE, Chapman CA, Kitajima K. Evolutionary and ecological correlates of early seedling morphology in east African trees and shrubs. American Journal of Botany. 2005;92:972–978. doi: 10.3732/ajb.92.6.972. [DOI] [PubMed] [Google Scholar]