

Abstract
AIMS
A hydrofluoroalkane formulation of budesonide pressurized metered-dose inhaler has been developed to replace the existing chlorofluorocarbon one. The aim of this study was to evaluate the pharmacokinetic and pharmacodynamic characteristics of both formulations.
METHODS
Systemic bioavailability and bioactivity of both hydrofluoroalkane and chlorofluorocarbon pressurized metered-dose inhaler formulations at 800 µg twice daily was determined during a randomized crossover systemic pharmacokinetic/pharmacodynamic study at steady state in healthy volunteers. Measurements included the following: plasma cortisol AUC24h[area under the concentration-time curve (0–24 h)], budesonide AUC0–12h and Cmax. Clinical efficacy was determined during a randomized crossover pharmacodynamic study in asthmatic patients receiving 200 µg followed by 800 µg budesonide via chlorofluorocarbon or hydrofluoroalkane pressurized metered-dose inhaler each for 4 weeks. Methacholine PC20 (primary outcome), exhaled nitric oxide, spirometry, peak expiratory flow and symptoms were evaluated.
RESULTS
In the pharmacokinetic study, there were no differences in cortisol, AUC0–12h[area under the concentration-time curve (0–12 h)], Tmax (time to maximum concentration) or Cmax (peak serum concentration) between the hydrofluoroalkane and chlorofluorocarbon pressurized metered-dose inhaler. The ratio of budesonide hydrofluoroalkane vs. chlorofluorocarbon pressurized metered-dose inhaler for cortisol AUC24h was 1.02 (95% confidence interval 0.93–1.11) and budesonide AUC0–12h was 1.03 (90% confidence interval 0.9–1.18). In the asthma pharmacodynamic study, there was a significant dose response (P < 0.0001) for methacholine PC20 (provocative concentration of methacholine needed to produce a 20% fall in FEV1) with a relative potency ratio of 1.10 (95% confidence interval 0.49–2.66), and no difference at either dose. No significant differences between formulations were seen with the secondary outcome variables.
CONCLUSIONS
Hydrofluoroalkane and chlorofluorocarbon formulations of budesonide were therapeutically equivalent in terms of relative lung bioavailability, airway efficacy and systemic effects.
Keywords: equivalence, hydrofluoroalkane, pharmacodynamics, pharmacokinetics
WHAT IS ALREADY KNOWN ABOUT THIS SUBJECT
Chlorofluorocarbons (CFCs) have been implicated in damage to the ozone layer, and are due to be phased out in accordance with the Montreal Protocol.
Hydrofluoroalkane-134a (HFA) has been found to act as an adequate propellant for pressurized metered-dose inhaler delivery systems without the same deleterious environmental effects.
WHAT THIS STUDY ADDS
This paper presents data from both steady-state pharmacokinetic and pharmacodynamic assessments of HFA vs. CFC pressurized metered-dose inhaler formulations of budesonide. It demonstrates that they are therapeutically equivalent in terms of relative lung bioavailability, airway efficacy and systemic effects.
Introduction
Inhaled corticosteroids (ICS) are the mainstay of treatment in persistent asthma [1, 2]. Budesonide is one of the most commonly prescribed ICS, and has been used effectively in the long-term management of persistent asthma for many years. A suspension aerosol formulation with chlorofluorocarbon (CFC) as the propellant was previously available for delivery of budesonide via pressurized metered-dose inhaler (pMDI). In recent years, CFCs have been implicated in damage to the ozone layer, and are due to be phased out in accordance with the Montreal Protocol [3]. Hydrofluoroalkane-134a (HFA) has been found to act as an adequate propellant for pMDI delivery systems without the same deleterious environmental effects. Budesonide has therefore been reformulated in suspension with HFA as the propellant. Two strengths of budesonide HFA pMDI (100 and 200 µg per actuation) have been developed. Determination of therapeutic equivalence is essential for new drug formulations. The aim of this paper is therefore to present pharmacokinetic and pharmacodynamic data from studies comparing HFA and CFC formulations of budesonide delivered via pMDI.
Materials and methods
In vitro next generation impactor
Particle distribution from HFA and CFC budesonide used in the pharmacodynamic study was determined in standardized fashion using a next generation impactor at 30 l min−1 at a temperature of 21–22°C and relative humidity of 33–35%.
Deposition on the impactor stages were calculated using high-performance liquid chromatography with a wavelength of detection set at 239 nm. Fine particle dose was defined as particles <4.7 µm.
Steady-state systemic pharmacokinetic/pharmacodynamic study
This was a single-centre, open-label, randomized, three-way, crossover study designed to compare the systemic bioavailability of budesonide HFA and CFC pMDI formulations at steady state. To be eligible for randomization, participants were required to be healthy, nonsmokers, aged >18 years, with a body mass index 18–30 kg m−2. Eligible subjects attended a baseline evaluation, including an overnight stay. During this visit, serial plasma samples (every 2 h) were obtained for evaluation of plasma cortisol concentration, and urine was collected over 24 h for cortisol/creatinine evaluation. Subjects were then randomized to a treatment sequence of four puffs twice a day of 200 µg budesonide via HFA or CFC pMDI for 6.5 days each in a crossover design. Subjects were admitted immediately prior to their evening dose on day 6 and underwent plasma cortisol sampling every 2 h and urine collection over 24 h. The following morning, plasma budesonide samples were obtained predose and at 10, 20 and 40 min and 1, 2, 4, 6, 8, 10 and 12 h postdose; plasma cortisol sampling continued during this time. Urine and plasma analyses for cortisol were performed using separate liquid chromatography/mass spectrometry methods (Quest Diagnostics, San Juan Capistrano, CA, USA), which both had lower limits of quantification of 1 ng ml−1 (2.8 nmol l−1). The cortisol assay is known to not be cross-reactive with either budesonide or its known metabolites. Plasma samples were analysed for budesonide by solid-phase extraction and liquid chromatography–atmospheric pressure chemical ionization–tandem mass spectrometry at TNO Nutrition and Food Research (Zeist, The Netherlands) using a method developed by AstraZeneca. The limit of quantification of the assay was 0.01 nmol l−1 budesonide. The coefficients of variation for accuracy were 17.4% at 0.030 nmol l−1, 4.8% at 3.98 nmol l−1, and 3.8% at 7.97 nmol l−1, with precisions of −2.2%, −2.6% and −2.8% at each concentration, respectively. The concentration range of this assay was from 0.01 to 10 nmol l−1. Treatment periods were separated by a 12–30 days washout period.
Pharmacodynamic study
This was a single-centre, randomized, open-label, crossover study (Figure 1). At screening, entry requirements were checked and informed consent was obtained. Participants were considered eligible if they were aged 18–65 years and had a diagnosis of stable, persistent asthma while receiving ≤1000 µg beclomethasone dipropionate or equivalent. Subjects were excluded if they were pregnant or lactating, had concomitant respiratory disease or had been prescribed oral steroid or a change to their asthma therapy in the 3 months preceding the screening visit. Eligible patients then entered a step-down phase, during which long-acting β2-agonists, theophyllines, cromones and leukotriene inhibitors were stopped. Participants then had their steroid dose gradually reduced in a manner similar to previously published studies from this department [4]. They then entered a 1 week pretreatment (ICS-free) washout period. A methacholine concentration of bronchial provocation agent causing a 20% decrease in forced expiratory volume in 1 s (PC20) of ≤4 mg ml−1 and forced expiratory volume in 1 s (FEV1) ≥60% predicted post step-down was required for entry into the treatment period. Subjects not meeting the entry requirements at the end of this phase were given a further 1–2 weeks of washout.
Figure 1.
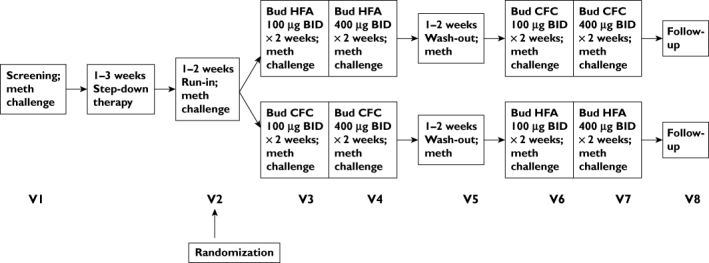
Study flow chart
The study consisted of two treatment periods. Subjects received low-dose (200 µg day−1) budesonide, either via CFC or HFA pMDI, for 2 weeks, followed by a further 2 weeks of medium-dose (800 µg day−1) budesonide. Participants then crossed over treatment arm, effectively acting as their own control. Treatment periods were separated by a 1–2 week washout period. Subjects were required to be within one doubling dilution of baseline methacholine PC20 at the end of washout. During all study visits, participants underwent pulmonary function testing (including FEV1, forced vital capacity, peak expiratory flow and forced expiratory flow between 25% and 75% of forced vital capacity), exhaled tidal nitric oxide and methacholine challenge. Methacholine challenge was performed using the five-breath dosimeter technique in accordance with American Thoracic Society (ATS) recommendations [5]. The PC20 was calculated using log-linear interpolation of the dose–response curve [5]. Exhaled tidal nitric oxide was measured in line with current ATS recommendations using a NIOX analyser (NIOX® Nitric Oxide Monitoring System, Aerocrine AB, Solna, Sweden). Subjects were asked to withhold short-acting β2-agonists and caffeine for 6 h prior to study visits, and all study visits took place at the same time of day. At each visit, inhaler technique was checked and peak flow/symptom diaries were reviewed. Subjects were asked to rate their asthma symptoms twice daily. Daytime scores were recorded each evening, and night-time scores were recorded on waking. The following rating scales were used: 0, no asthma symptoms; 1, mild symptoms (easily tolerable); 2, moderate symptoms (interferes with normal activities/sleep); and 3, severe (prevents normal activities/sleep). Overnight (i.e. 22.00–08.00 h) urine was collected for cortisol and creatinine the night prior to study visits. Urinary cortisol was measured using a commercial radioimmunoassay kit (DiaSorin Ltd, Wokingham, Berks, UK). The intra-assay coefficient of variation was 4% and the interassay coefficient of variation was 8%. Urinary creatinine was measured on a Cobas-Bio auto analyser (Roche Products, Welwyn Garden City, Herts, UK). The intra-assay and interassay coefficients of variation were 4.6% and 3.0%, respectively.
Statistical analysis
Steady-state systemic pharmacokinetic/pharmacodynamic study
The primary objective of this study was to compare the systemic effects of budesonide HFA vs. CFC pMDI using measurement of 24 h plasma cortisol concentrations. Secondary objectives included the measurement of 24 h urinary-free cortisol excretion and the measurement of plasma budesonide levels for pharmacokinetic analysis. Plasma cortisol AUC0–24h[area under the concentration-time curve (0–24 h)] was subjected to a multiplicative (i.e. the AUC values were log-transformed) analysis of variance (anova) model with fixed factors for subject, period and treatment. Pairwise treatment comparisons were made based on estimates obtained from the anova model, and estimates of pairwise differences and two-sided 95% confidence intervals (CIs) for these differences were presented on the linear scale and expressed as ratios of treatment effects (i.e. the ratios of geometric means). Urine cortisol was assessed in a similar manner.
For budesonide pharmacokinetics, log-transformed AUC0–12h and Cmax (peak plasma concentration) values at steady state were compared between treatment regimes using an anova model with fixed factors for subject, period and treatment. Results were back-transformed to the linear scale, giving differences between regimens as ratios of geometric means. Ninety per cent two-sided CIs were constructed for the ratios between the HFA and CFC regimens. The European Medicines Agency (EMEA) equivalence limits for systemic bioavailability of ±20% were applied (i.e. a ratio of 0.8–1.25).
Pharmacodynamic study
The primary outcome measure was a change in methacholine PC20 from pooled baseline (i.e. post run-in or washout periods) for each treatment. Any non-Gaussian data were log transformed prior to analysis. Gaussian data were assessed using anova. To compare the relative microgram potency of the two devices, Finney's bioassay was used to estimate the relative potency [6]. The relative potency is defined as the ratio of doses estimated to provide the same effect. Fieller's theorem allowed for the calculation of 95% CIs for the relative potency. The 95% CI for relative potency was required to be contained within equivalence limits of ±50% (i.e. a ratio of 0.5- to 2.0-fold). Sample size was based on the results of a previous study by Lipworth et al. [7]. A comparison was also made between the two formulations at each dose using the EMEA equivalence limits of ±33% (i.e. a ratio of 0.67–1.50).
Other outcome variables were considered as secondary and were analysed using a similar model but without log transformation (except exhaled tidal nitric oxide and overnight urinary cortisol/creatinine ratio).
Results
In vitro next generation impactor data
In vitro data revealed that at the 100 µg dose HFA and CFC budesonide had a similar fine particle dose for respirable particles <4.7 µm of 20.4 µg (SD 0.6) vs. 19.7 µg (SD 0.7), respectively. At the 200 µg dose, the fine particle dose was higher with HFA than CFC, at 42.7 µg (SD 1.7) vs. 33.8 µg (SD 2.9), respectively (Table 1).
Table 1.
Next generation cascade impactor data
| CFC 100 µg | CFC 200 µg | HFA 100 µg | HFA 200 µg | |||||
|---|---|---|---|---|---|---|---|---|
| Mean | SD | Mean | SD | Mean | SD | Mean | SD | |
| Fine particle dose: FPD <4.7 µm (µg budesonide)−1 | 19.7 | 0.7 | 33.8 | 2.9 | 20.4 | 0.6 | 42.7 | 1.7 |
| Group 1, throat fraction: USP throat (% of delivered) | 62.9 | 4.2 | 63.2 | 1.0 | 57.4 | 1.3 | 55.9 | 0.9 |
| Group 2, droplets <4.7 µm:FPF <4.7 µm (% of delivered) | 14.9 | 2.4 | 18.7 | 1.2 | 16.6 | 0.6 | 18.4 | 0.4 |
| Group 3 droplets 1.1–4.7 µm:FPF 1.1–4.7 µm (% of delivered) | 22.0 | 2.0 | 18.0 | 1.3 | 24.4 | 0.8 | 24.6 | 0.6 |
| Group 4, droplets <1.1 µmFPF <1.1 µm (% of delivered) | 0.2 | 0.0 | 0.1 | 0.0 | 1.6 | 0.1 | 1.2 | 0.1 |
| MMAD µm | 3.96 | 0.10 | 4.49 | 0.15 | 3.76 | 0.01 | 3.93 | 0.04 |
| GSD | 1.61 | 0.01 | 1.64 | 0.01 | 1.75 | 0.02 | 1.74 | 0.00 |
FPD, fine particle dose; FPF, fine particle fraction; GSD, geometric standard deviation; MMAD, mass median aerodynamic diameter; USP, United States pharmacopeia.
Steady-state systemic pharmacokinetic/systemic pharmacodynamic study
In total, 50 subjects were screened, 28 were randomized and 26 completed the study. Demographics are given in Table 2. Two subjects withdrew postrandomization; one withdrew consent and the other withdrew because of an adverse event (cervicitis).
Table 2.
Baseline characteristics of subjects randomized into the steady-state systemic pharmacokinetic/systemic pharmacodynamic study
| Characteristic | Mean (SEM) |
|---|---|
| Age (years) | 32.3 (2.7) |
| Weight (kg) | 73.7 (2.7) |
| Height (cm) | 178.0 (1.9) |
| Body mass index (kg m−2) | 23.1 (0.6) |
| No. of males : no. of females | 17:11 |
Values for plasma cortisol at steady state (AUC0–24h) showed similar significant suppression from baseline following treatment with budesonide HFA and CFC pMDI, at 21% (95% CI 16–26%) and 23% (95% CI 18–28%), respectively. The between-treatment ratio (HFA vs. CFC) for plasma cortisol AUC0–24h was 1.02 (95% CI 0.93–1.11; P = 0.67). The resulting 95% CI was contained within ±33% equivalence limits (i.e. ratio of 0.67–1.50). Analysis of uncorrected 24 h urinary cortisol revealed suppression of 30% (from baseline) for budesonide HFA pMDI and 37% for the CFC pMDI. Analysis of corrected 24 h urinary cortisol/creatinine revealed 31% suppression (from baseline) for HFA and 27% suppression for CFC. The geometric mean ratio between HFA and CFC pMDIs for uncorrected 24 h urinary cortisol was 1.09 (95% CI 0.89–1.33; P = 0.40). The geometric mean ratio between treatments for corrected 24 h urinary cortisol/creatinine ratio was 1.08 (95% CI 0.89–1.30; P = 0.42).
The geometric mean ratio of budesonide HFA and CFC pMDIs at steady state for plasma budesonide AUC0–12h was not significantly different, being 1.03 (90% CI 0.9–1.18; P = 0.72; (see Figures 2 and 3). The 90% CI was contained within conventional systemic bioequivalence limits of ±20% (i.e. a ratio of 0.8–1.25). Although the between-treatment ratio for Cmax was not significant (0.89; 90% CI 0.77–1.04 P = 0.22), the lower limit of the CI was less than 0.8, indicating that the HFA formulation would not be considered to be bioequivalent to the CFC formulation for Cmax. No significant differences were found between formulations during analysis of Tmax (time to maximum plasma concentration) or T1/2 (half life), which were 0.68 h and 3.56 h for budesonide HFA pMDI vs. 0.52 h and 3.50 h for the CFC pMDI (Table 3).
Figure 2.
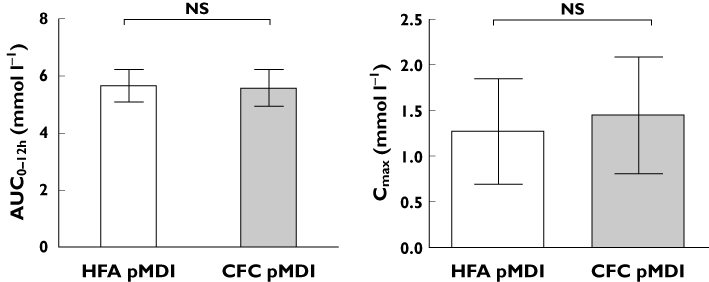
Comparison of pharmacokinetic parameters of budesonide at steady state by treatment. Data are presented as geometric means (95% confidence intervals)
Figure 3.
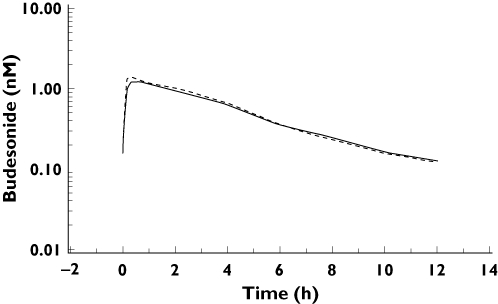
Mean profiles of budesonide concentration in plasma steady state over time. Budesonide HFA pMDI ( ); pulnicort CFC pMDI (
 )
)
Table 3.
Pharmacokinetic parameters of budesonide at steady state by treatment
| Parameter | Treatment | n | Mean | CV (%) | Minimum | Median | Maximum |
|---|---|---|---|---|---|---|---|
| AUC0–120h (h nmol l−1) | HFA | 27 | 5.67 | 25.22 | 2.32 | 5.58 | 10.35 |
| CFC | 28 | 5.59 | 29.56 | 1.92 | 6.10 | 13.98 | |
| Cmax (nmol l−1) | HFA | 27 | 1.27 | 115.80 | 0.70 | 1.22 | 2.81 |
| CFC | 28 | 1.45 | 113.17 | 0.47 | 1.47 | 3.62 | |
| Tmax (h) | HFA | 27 | 0.68 | 0.38 | 0.17 | 0.67 | 2.00 |
| CFC | 28 | 0.52 | 0.43 | 0.17 | 0.33 | 2.00 | |
| T1/2 (h) | HFA | 27 | 3.56 | 34.75 | 2.47 | 3.41 | 6.24 |
| CFC | 28 | 3.50 | 33.40 | 2.53 | 3.45 | 4.85 |
For Tmax, data are presented as the arithmetic mean and SD. AUC0–120 h, area under the concentration-time curve (0–120 h); Cmax, maximum plasma concentration of budesonide; Tmax, time to maximum plasma concentration of budesonide; t1/2, half life; CFC, chlorofluorocarbon; HFA, hydrofluoroalkane.
Pharmacodynamic study
One hundred and thirty-three adults with mild-to-moderate asthma were screened; 99 were randomized, and 68 completed the study according to protocol (Figure 1). The demographic characteristics of subjects randomized to first treatment at screening are given in Table 4. Reasons for nonrandomization included the following: FEV1≤60% predicted (n = 4); PC20 >4 mg ml−1 (n = 13); instability in step-down (n = 8); voluntary discontinuation (n = 8); and lost to follow-up (n = 1). During the study, 31 patients were withdrawn for the following reasons: failure to wash out (n = 14); worsening of asthma (n = 10); personal reasons (n = 4); and adverse events (n = 3). Both treatment sequences were well matched for age, sex, height, weight and race.
Table 4.
Baseline characteristics of subjects prior to first treatment with budesonide HFA and CFC pMDIs
| Variable | Before HFA | Before CFC |
|---|---|---|
| Age (years)* | 40.0 (14.13) | 39.5 (14.65) |
| Sex (male : female) | 20:24 | 19:26 |
| Race (Caucasian : Black : Oriental : other) | 42:0:1:1 | 42:0:0:3 |
| Methacholine PC20 (mg ml−1) | 0.68 (0.33–1.03) | 0.62 (0.31–0.93) |
| Exhaled nitric oxide (parts per billion) | 34.42 (23.62–45.22) | 34.76 (25.13–44.39) |
| Spirometry | ||
| FEV1 (l) | 2.86 (2.62–3.10) | 2.80 (2.55–3.05) |
| FVC (l) | 3.83 (3.50–4.16) | 3.75 (3.42–4.08) |
| FEF25–75 (l) | 2.47 (2.15–2.79) | 2.42 (2.09–2.75) |
| PEF (l min−1) | 445.25 (408.97–481.53) | 438.80 (402.54–475.06) |
| Cortisol/creatinine ratio (nmol mmol−1) | 3.49 (2.40–4.58) | 3.50 (2.35–4.65) |
Data are presented as arithmetic mean (SD). Data are presented as geometric mean (95% confidence interval) unless otherwise indicated. Baseline values are shown after washout before each randomized treatment period. FEF25–75, forced expiratory flow between 25 and 75% of forced vital capacity; FEV1, forced expiratory volume in 1 s; PC20, concentration of methacholine required to produce a 20% decrease in FEV1; FVC, forced vital capacity; PEF, peak expiratory flow.
Primary efficacy variable
There were no significant differences between baseline values prior to each treatment (i.e. after each washout period) for any of the primary or secondary outcome measures. Therefore, all analyses were performed compared with pooled baseline values. There was also no significant difference in compliance between the two treatments, or between doses.
The number of patients who had both baseline and post-treatment data measured for the primary outcome variable (methacholine PC20) was n = 80 for low-dose HFA, n = 79 for medium-dose HFA, n = 79 for low-dose CFC and n = 78 for medium-dose CFC. Significant improvements in methacholine PC20 were observed following treatment with both HFA and CFC budesonide formulations. The geometric mean shift from baseline following treatment with 200 and 800 µg budesonide HFA pMDI was 1.55-fold (95% CI 1.34–1.78) and 2.16-fold (95% CI 1.88–2.50), respectively. Similar changes were observed following treatment with 200 and 800 µg budesonide CFC, being 1.67-fold (95% CI 1.45–1.93) and 2.08-fold (95% CI 1.80–2.40), respectively. Both formulations demonstrated a significant dose–response relation between 200 and 800 µg (Table 5). The geometric mean difference in PC20 shift between 800 and 200 µg budesonide was 1.24 (95% CI 1.02–1.51; P = 0.03) for CFC and 1.40 (95% CI 1.15–1.67; P = 0.0008) for HFA. There were no statistically significant differences for either dose between the two propellant types (Table 6), as follows: 200 µg day−1, HFA vs. CFC 0.93 (95% CI 0.76–1.13; P = 0.44); and 800 µg day−1, HFA vs. CFC 1.04 (95% CI 0.85–1.27; P = 0.70). Both of these 95% CIs were contained within ±33% equivalence limits (ratio of 0.67–1.50)
Table 5.
Comparison between doses for all outcomes with each formulation
| 800 vs. 200 µg HFA | 800 vs. 200 µg CFC | |||
|---|---|---|---|---|
| Outcome | Mean | 95% confidence interval (P value) | Mean | 95% confidence interval (P value) |
| Methacholine PC20 ratio | 1.40 | 1.15 to 1.70 (<0.01) | 1.25 | 1.02 to 1.51 (0.03) |
| Exhaled nitric oxide ratio | 0.86 | 0.80 to 0.93 (<0.01) | 0.89 | 0.82 to 0.96 (<0.01) |
| Spirometry | ||||
| FEV1 (l) | 0.02 | −0.02 to 0.07 (0.27) | 0.01 | −0.03 to 0.06 (0.51) |
| FVC (l) | 0.01 | −0.03 to 0.06 (0.55) | −0.01 | −0.05 to 0.04 (0.78) |
| FEF25–75 (l) | 0.04 | −0.05 to 0.12 (0.38) | 0.04 | −0.04 to 0.13 (0.30) |
| PEF (l min−1) | 2.95 | −5.11 to 10.99 (0.47) | −2.83 | −10.93 to 5.23 (0.49) |
| OUCC ratio | 0.67 | 0.54 to 0.83 (<0.01) | 0.80 | 0.64 to 0.99 (0.04) |
| Diary card data* | ||||
| Morning PEF (l min−1) | 11.31 | 4.76 to 17.86 (<0.01) | 9.37 | 2.75 to 15.99 (0.01) |
| Morning rescue medication (no. puffs) | −0.26 | −0.41 to −0.11 (<0.01) | −0.12 | −0.27 to 0.04 (0.13) |
| Evening rescue medication (no. puffs) | −0.24 | −0.43 to −0.05 (0.01) | −0.20 | −0.39 to 0.01 (0.04) |
| Total rescue medication (no. puffs) | −0.48 | −0.81 to −0.16 (<0.01) | −0.34 | −0.67 to −0.02 (0.04) |
| Symptoms (0–3)* | ||||
| Morning asthma symptoms | −0.11 | −0.18 to −0.04 (<0.01) | −0.09 | −0.16 to −0.02 (0.01) |
| Evening asthma symptoms | −0.15 | −0.22 to −0.08 (<0.01) | −0.09 | −0.17 to −0.02 (0.01) |
| Total asthma symptoms | −0.26 | −0.39 to −0.13 (<0.01) | −0.19 | −0.32 to −0.05 (<0.01) |
From diary. Data for PC20, exhaled nitric oxide ratio and OUCC are shown as the geometric mean ratios between 800 vs. 200 µg; for other outcomes the differences between doses are given in the units specified. FEF25–75, forced expiratory flow between 25% and 75%; FEV1, forced expiratory volume in 1 s; FVC, forced vital capacity; OUCC overnight urine cortisol/creatinine; PEF, peak expiratory flow.
Table 6.
Comparison between formulations for all outcomes at each dose
| HFA 200 µg vs. CFC 200 µg | HFA 800 µg vs. CFC 800 µg | |||
|---|---|---|---|---|
| Outcome | Mean | 95% confidence interval (P value) | Mean | 95% confidence interval (P value) |
| Methacholine PC20 (mg ml−1) | 0.92 | 0.76 to 1.13 (0.44) | 1.04 | 0.85 to 1.27 (0.71) |
| Exhaled nitric oxide (parts per billion) | 0.99 | 0.91 to 1.07 (0.78) | 0.96 | 0.89 to 1.05 (0.38) |
| Spirometry | ||||
| FEV1 (l) | −0.02 | −0.06 to 0.02 (0.34) | −0.01 | −0.05 to 0.03 (0.62) |
| FVC (l) | −0.02 | −0.06 to 0.03 (0.42) | 0.00 | −0.04 to 0.05 (0.97) |
| FEF25–75 (l) | −0.05 | −0.13 to 0.04 (0.29) | −0.05 | −0.14 to 0.03 (0.23) |
| PEF (l min−1) | −2.26 | −10.57 to 6.06 (0.41) | 3.52 | −4.87 to 11.91 (0.41) |
| OUCC | ||||
| Cortisol/creatinine ratio (nmol mmol−1) | 1.04 | 0.83 to 1.31 (0.74) | 0.87 | 0.69 to 1.10 (0.24) |
| Cortisol (nmol l−1) | 0.99 | 0.78 to 1.28 (0.99) | 0.86 | 0.67 to 1.11 (0.25) |
| Diary card data* | ||||
| Morning PEF (l min−1) | −2.19 | −8.61 to 4.23 (0.50) | −0.23 | −7.05 to 6.56 (0.94) |
| Morning rescue medication (no. puffs) | 0.09 | −0.06 to 0.24 (0.24) | −0.05 | −0.21 to 0.11 (0.56) |
| Evening rescue medication (no. puffs) | 0.06 | −0.13 to 0.24 (0.56) | 0.02 | −0.18 to 0.21 (0.86) |
| Total rescue medication (no. puffs) | 0.19 | −0.13 to 0.50 (0.25) | 0.05 | −0.29 to 0.38 (0.78) |
| Symptoms (0–3)* | ||||
| Morning asthma symptoms | 0.002 | −0.07 to 0.07 (0.95) | −0.01 | −0.08 to 0.06 (0.78) |
| Evening asthma symptoms | 0.02 | −0.05 to 0.09 (0.58) | −0.04 | −0.11 to 0.03 (0.30) |
| Total asthma symptoms | 0.02 | −0.11 to 0.15 (0.74) | −0.05 | −0.18 to 0.09 (0.47) |
From diary. Data for PC20, exhaled nitric oxide ratio and OUCC are shown as the geometric mean ratios between HFA vs. CFC at either 200 or 800 µg doses. For other outcomes the differences between formulations are given in the units specified. FEF25–75, forced expiratory flow between 25% and 75%; FEV1, forced expiratory volume in 1 s; FVC, forced vital capacity; OUCC, overnight urinary cortisol/creatinine ratio; PC20, concentration of bronchial provocation agent causing a 20% decrease in forced expiratory volume in 1 s; PEF, peak expiratory flow.
The log-linear dose–response curves for HFA and CFC were parallel, and the common slope was highly statistically significant (P < 0.0001). The estimated relative potency between HFA and CFC budesonide, for the full analysis set (n = 89), was 1.10 (95% CI 0.49–2.66). The 95% CI was not completely contained within the ±50% equivalence limits of 0.5–2.0.
Secondary efficacy/safety variables
There were statistically significant differences between medium and low doses of budesonide for both CFC and HFA formulations (except morning rescue medication and pulmonary function; Table 5). There were no statistically significant differences when comparing low-dose budesonide CFC and HFA, and medium-dose budesonide CFC and HFA (Table 6). Relative potencies were calculated for secondary outcomes that were close to unity (Table 7). Only three patients discontinued following adverse events, as follows: two lower respiratory tract infections (CFC formulation); and one oral candidiasis (HFA formulation). No serious adverse events were reported in this study.
Table 7.
Summary of relative dose potency for budesonide (full analysis set)
| Parameter | Relative dose potency | Estimate | 95% Confidence interval |
|---|---|---|---|
| PC20 | HFA/CFC | 1.104 | 0.489, 2.660 |
| Morning PEF* | HFA/CFC | 1.186 | 0.611, 2.523 |
| Morning asthma symptoms* | HFA/CFC | 0.949 | 0.413, 2.117 |
| Evening asthma symptoms* | HFA/CFC | 0.913 | 0.481, 1.681 |
| Total asthma symptoms* | HFA/CFC | 0.929 | 0.483, 1.740 |
From diary. 95% Confidence interval for relative dose potency was determined using Fieller's theorem. PC20, concentration of bronchial provocation agent causing a 20% decrease in forced expiratory volume in 1 s; PEF, peak expiratory flow.
Discussion
The aim of the studies reported in this paper was to determine whether budesonide HFA pMDI and budesonide CFC pMDI were therapeutically equivalent. Pharmacokinetic budesonide data showed that both products were bioequivalent in terms of steady-state AUC0–12h, and that the 90% CI lay within ±20% systemic bioequivalence limits (0.8–1.25). The overall systemic bioavailability of budesonide (as reflected by AUC) is mostly determined by lung bioavailability, as there is 90% hepatic first-pass inactivation for the swallowed fraction [8]. The 95% CI for the ratio between HFA vs. CFC for suppression of 24 h AUC for plasma cortisol was close to unity and was within equivalence limits of ±33% (0.67–1.50). These cortisol data are in keeping with the pharmacokinetic results for AUC0–12h. The Cmax is thought to be a better representation of early budesonide absorption from the lung, as it does not include the later oral component from swallowing. However, Cmax is typically more variable than AUC parameters due to a limited number of samples being obtained. Analysis of Cmax revealed a test/reference ratio of 0.89, with the lower 90% CI less than 0.80, indicating inferiority of the test product. Thus, using the pharmacokinetic outcome of AUC (but not Cmax) we have demonstrated systemic bioequivalence of the budesonide HFA and CFC pMDI formulations.
Analysis of in vitro fine particle dose revealed a 22% difference between formulations at the 200 µg strength, which is greater than the ±15% equivalence limits allowed by current EMEA guidelines [9]. The overall fine particle dose (i.e. particles <4.7 µm) is thought to represent the dose delivered to the lungs, and should therefore reflect relative lung bioavailability of budesonide, which in turn determines relative airway and systemic bioactivies from the pharmacodynamic study.
Therapeutic equivalence was further assessed during a single-centre pharmacodynamic study. Suppression of bronchial hyper-responsiveness to methacholine was selected as the primary end-point because it is a characteristic feature of asthma, which varies over time, often increasing during exacerbations and decreasing during treatment with anti-inflammatory medications [10]. Bronchial hyper-responsiveness has been shown to correlate well with inflammation of the airways and to be a reliable surrogate of disease activity [11, 12]. As asthma is an inflammatory condition and the role of ICS is to suppress inflammation, we feel that using methacholine challenge as a primary outcome is justified. It has previously been demonstrated that 2 weeks of treatment with ICS is sufficient to achieve near-maximal effects on bronchial hyper-responsiveness [13].
The results of this study demonstrated that there was no significant difference in response between budesonide formulations in methacholine PC20 with either 200 or 800 µg day−1 doses. The ratio of HFA to CFC was close to unity, and the 95% CIs lay within ±33% equivalence limits (0.67–1.50) at each dose level. We also demonstrated sensitivity of the methacholine bioassay, as there was a significant dose–response relation for both formulations. Significant dose separation has previously been reported using methacholine PC20 with 100 vs. 500 µg fluticasone propionate [14]. The common slope for the overall log dose–response relation was highly significant, demonstrating that the doses selected coincided with the steep part of the dose–response curve for bronchial hyper-responsiveness. The 95% CIs for the relative dose potency ratio of HFA vs. CFC were close to unity at 1.10; however, the 95% CI (0.49–2.66) was outside of the ±50% limits of 0.5–2.0 [15]. Comparable results have been shown in a similar dose–response study published previously from our own laboratory [7]. It could be argued that the change observed in the step up from 200 to 800 µg could be a time effect; however, we feel this is extremely unlikely. Sovijarvi et al. found the doubling dilution difference between fluticasone and placebo to be 1.19, 1.33 and 1.27 after 72 h, 2 and 4 weeks, respectively, indicating that near-maximal response in methacholine PC20 is seen after 2 weeks of treatment. The differences observed in the present study are too large to be due to a time effect alone. Exhaled tidal nitric oxide is another reliable surrogate of airway inflammation [16–18]. Results revealed no significant difference between products, indicating that airway inflammation was equally controlled by both formulations.
This improvement in airway inflammation was mirrored by an improvement in diary data, including symptoms and rescue medication. All measured outcomes, with the exception of spirometric measures, demonstrated a significant dose–response relation for budesonide with both the HFA and the CFC formulation. Comparison of HFA and CFC formulations at each dose demonstrated no significant differences between products for any measure. The lack of detectable dose–response for spirometric measures is probably due to our patients having mild-to-moderate asthma with relatively well-preserved airway calibre and little room for improvement. Previous studies have successfully demonstrated small, clinically insignificant, improvements in lung function within this time frame [19]. Spirometric indices are known to be relatively insensitive measures for assessing response to ICS in mild-to-moderate persistent asthmatic patients [20]; studies using these as primary end-points have typically required large numbers of patients with prolonged follow-up [15]. Despite these issues, current EMEA guidelines still recommend the use of spirometry as the primary outcome when determining the equivalent efficacy of ICS. Additionally, they recommend the use of a parallel-group study design, which requires careful matching of study groups. This raises further problems due to the inherent heterogeneity of asthma. The study design is also far more robust provided reliable, repeatable end-points are used. The only potential concern regarding crossover studies is unequal carry-over of steroid effect between treatment periods. In this respect, for all end-points we found no important differences between the respective pretreatment baseline values at run-in and washout periods.
In order to be considered equivalent, products also need to demonstrate similar safety profiles. Hypothalamic–pituitary–adrenal axis suppression has been shown to be one of the most sensitive markers of systemic bioavailability for ICS [21]. It has also been used as a surrogate marker for potential adverse effects in other tissues. When comparing two ICS with different potencies, the ratio for suppression of 24 h urinary cortisol/creatinine was comparable to that of 24 h integrated serum cortisol [22]. Results from the systemic healthy volunteer study at a dose of 1600 µg day−1 have confirmed that both products are therapeutically equivalent within limits of 0.67–1.50 in terms of suppression of 24 h plasma cortisol. Moreover, there was no significant difference in terms of 24 h urinary-free cortisol. These results are supported by results from the pharmacodynamic study, which showed assay sensitivity in terms of a significant dose–response relation between 200 and 800 µg day−1 for levels of overnight urinary cortisol/creatinine ratio, as well as revealing no difference between formulations at either dose. A review of adverse events also revealed no significant differences between the two products.
Conclusion
In conclusion, we have presented data from steady-state pharmacokinetic and pharmacodynamic assessments of HFA vs. CFC pMDI formulations of budesonide that demonstrate therapeutic equivalence in terms of relative lung bioavailability, airway efficacy and systemic effects. This suggests in turn that both products were therapeutically interchangeable when used in clinical practice on a puff per puff basis.
Acknowledgments
This study was completely funded by AstraZeneca.
Competing Interests
Brian Lipworth received a research grant from AstraZeneca for this study and has received payment for consulting. The other authors have no competing interests to declare.
REFERENCES
- 1.Cabral AL, Conceicao GM, Fonseca-Guedes CH, Martins MA. Exercise-induced bronchospasm in children: effects of asthma severity. Am J Respir Crit Care Med. 1999;159:1819–23. doi: 10.1164/ajrccm.159.6.9805093. [DOI] [PubMed] [Google Scholar]
- 2.Walters EH, Walters J. Inhaled short acting beta2-agonist use in asthma: regular vs as needed treatment. Cochrane Database Syst Rev. 2000;(4) doi: 10.1002/14651858.CD001285. CD001285. [DOI] [PubMed] [Google Scholar]
- 3.The Montreal Protocol on substances that deplete the ozone layer. Final act (Nairobi: UNEP, 1987) Federal Register. 1994;59:56276–98. [Google Scholar]
- 4.Fardon TC, Lee DK, Haggart K, McFarlane LC, Lipworth BJ. Adrenal suppression with dry powder formulations of fluticasone propionate and mometasone fuorate. Am J Respir Crit Care Med. 2004;170:960–6. doi: 10.1164/rccm.200404-500OC. [DOI] [PubMed] [Google Scholar]
- 5.Crapo RO, Casaburi R, Coates AL, Enright PL, Hankinson JL, Irvin CG, MacIntyre NR, McKay RT, Wanger JS, Anderson SD, Cockcroft DW, Fish JE, Sterk PJ. Guidelines for methacholine and exercise challenge testing-1999. This official statement of the American Thoracic Society was adopted by the ATS Board of Directors, July 1999. Am J Respir Crit Care Med. 2000;161:309–29. doi: 10.1164/ajrccm.161.1.ats11-99. [DOI] [PubMed] [Google Scholar]
- 6.Fieller EC. Some problems in interval estimation. J R Stat Soc B Stat Methodol. 1954;16:175–85. [Google Scholar]
- 7.Lipworth BJ, Sims EJ, Das SK, Buck H, Paterson M. Dose-response comparison of budesonide dry powder inhalers using adenosine monophosphate bronchial challenge. Ann Allergy Asthma Immunol. 2005;94:675–81. doi: 10.1016/S1081-1206(10)61327-0. [DOI] [PubMed] [Google Scholar]
- 8.Donnelly R, Williams KM, Baker AB, Badcock CA, Day RO, Seale JP. Effects of budesonide and fluticasone on 24-h plasma cortisol. A dose-response study. Am J Respir Crit Care Med. 1997;156:1746–51. doi: 10.1164/ajrccm.156.6.9703003. [DOI] [PubMed] [Google Scholar]
- 9.EMEA. Guideline on the requirements for clinical documentation for orally inhaled products (OIP) including the requirements for demonstration of therapeutic equivalence between two inhaled products for use in the treatemnt of asthma and chronic obstructive pulmonary disease (COPD) in adults and for the use in the treatment of asthma in children and adolescents. 2009. Available at http://www.emea.europa.eu/pdfs/human/ewp/4850108en.pdf (last accessed 11 September 2009)
- 10.Laprise C, Laviolette M, Boutet M, Boulet LP. Asymptomatic airway hyperresponsiveness: relationships with airway inflammation and remodelling. Eur Respir J. 1999;14:63–73. doi: 10.1034/j.1399-3003.1999.14a12.x. [DOI] [PubMed] [Google Scholar]
- 11.Sont JK, Willems LN, Bel EH, van Krieken JH, Vandenbroucke JP, Sterk PJ. Clinical control and histopathologic outcome of asthma when using airway hyperresponsiveness as an additional guide to long-term treatment. The AMPUL Study Group. Am J Respir Crit Care Med. 1999;159(4):1043–51. doi: 10.1164/ajrccm.159.4.9806052. Pt 1. [DOI] [PubMed] [Google Scholar]
- 12.Ward C, Reid DW, Orsida BE, Feltis B, Ryan VA, Johns DP, Walters EH. Inter-relationships between airway inflammation, reticular basement membrane thickening and bronchial hyper-reactivity to methacholine in asthma; a systematic bronchoalveolar lavage and airway biopsy analysis. Clin Exp Allergy. 2005;35:1565–71. doi: 10.1111/j.1365-2222.2005.02365.x. [DOI] [PubMed] [Google Scholar]
- 13.Sovijarvi AR, Haahtela T, Ekroos HJ, Lindqvist A, Saarinen A, Poussa T, Laitinen LA. Sustained reduction in bronchial hyperresponsiveness with inhaled fluticasone propionate within three days in mild asthma: time course after onset and cessation of treatment. Thorax. 2003;58:500–4. doi: 10.1136/thorax.58.6.500. [DOI] [PMC free article] [PubMed] [Google Scholar]
- 14.Nair A, Vaidyanathan S, Clearie K, Williamson P, Meldrum K, Lipworth BJ. Steroid sparing effects of intranasal corticosteroids in asthma and allergic rhinitis. Allergy. 2009 doi: 10.1111/j.1398-9995.2009.02187.x. [DOI] [PubMed] [Google Scholar]
- 15.Busse WW, Brazinsky S, Jacobson K, Stricker W, Schmitt K, Vanden Burgt J, Donnell D, Hannon S, Colice GL. Efficacy response of inhaled beclomethasone dipropionate in asthma is proportional to dose and is improved by formulation with a new propellant. J Allergy Clin Immunol. 1999;104:1215–22. doi: 10.1016/s0091-6749(99)70016-3. [DOI] [PubMed] [Google Scholar]
- 16.Bates CA, Silkoff PE. Exhaled nitric oxide in asthma: from bench to bedside. J Allergy Clin Immunol. 2003;111:256–62. doi: 10.1067/mai.2003.103. [DOI] [PubMed] [Google Scholar]
- 17.Berlyne GS, Parameswaran K, Kamada D, Efthimiadis A, Hargreave FE. A comparison of exhaled nitric oxide and induced sputum as markers of airway inflammation. J Allergy Clin Immunol. 2000;106:638–44. doi: 10.1067/mai.2000.109622. [DOI] [PubMed] [Google Scholar]
- 18.Jatakanon A, Lim S, Kharitonov SA, Chung KF, Barnes PJ. Correlation between exhaled nitric oxide, sputum eosinophils, and methacholine responsiveness in patients with mild asthma. Thorax. 1998;53:91–5. doi: 10.1136/thx.53.2.91. [DOI] [PMC free article] [PubMed] [Google Scholar]
- 19.Fardon TC, Burns P, Barnes ML, Lipworth BJ. A comparison of 2 extrafine hydrofluoroalkane-134a-beclomethasone formulations on methacholine hyperresponsiveness. Ann Allergy Asthma Immunol. 2006;96:422–30. doi: 10.1016/S1081-1206(10)60909-X. [DOI] [PubMed] [Google Scholar]
- 20.Masoli M, Weatherall M, Holt S, Beasley R. Clinical dose-response relationship of fluticasone propionate in adults with asthma. Thorax. 2004;59:16–20. [PMC free article] [PubMed] [Google Scholar]
- 21.Lipworth BJ. Adrenal suppression with inhaled corticosteroids. Ann Allergy Asthma Immunol. 2001;87:359–61. doi: 10.1016/S1081-1206(10)62914-6. [DOI] [PubMed] [Google Scholar]
- 22.Wilson AM, Lipworth BJ. 24 hour and fractionated profiles of adrenocortical activity in asthmatic patients receiving inhaled and intranasal corticosteroids. Thorax. 1999;54:20–6. doi: 10.1136/thx.54.1.20. [DOI] [PMC free article] [PubMed] [Google Scholar]