Abstract
Purpose
To compare magnetic resonance elastography (MRE) effective stiffness to end-diastolic pressure at different loading conditions to demonstrate a relationship between myocardial MRE effective stiffness and end-diastolic left ventricular (LV) pressure.
Methods
MRE was performed on 4 pigs to measure the end-diastolic effective stiffness under different loading conditions. End-diastolic pressure was increased by infusing dextran-40 (20% of blood volume). For each infusion of dextran-40, end-diastolic pressure was recorded and end-diastolic effective stiffness was measured using MRE. In each pig, least-square linear regression was performed to determine the correlation between end-diastolic effective stiffness and end-diastolic LV pressure.
Results
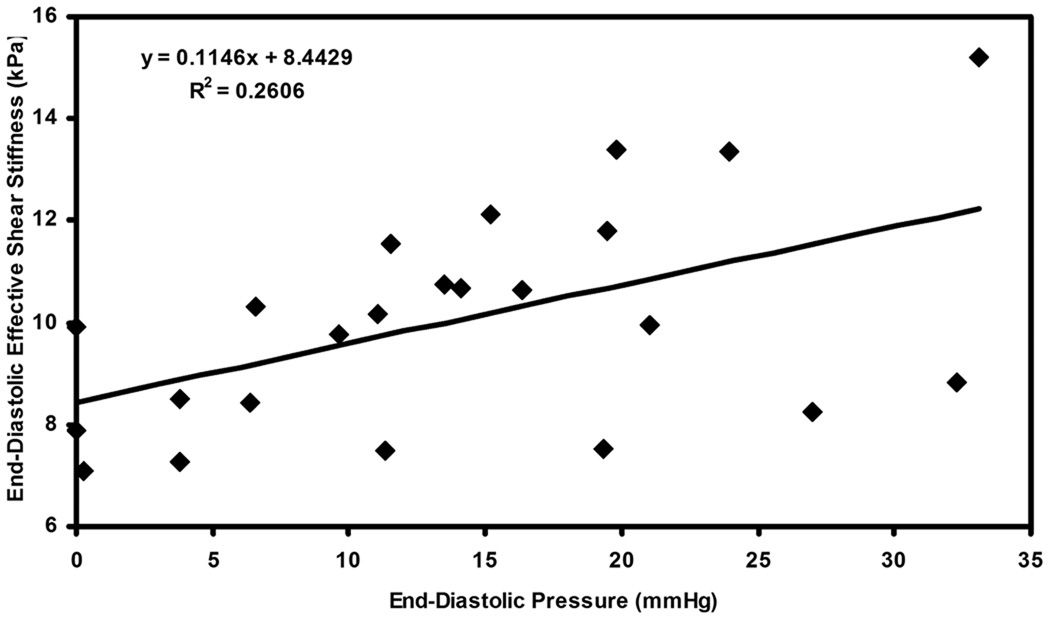
A linear correlation was found between end-diastolic LV pressure and end-diastolic effective stiffness with R2 ranging from 0.73–0.9. A linear correlation with R2 = 0.26 was found between end-diastolic LV pressure and end-diastolic effective stiffness when pooling data points from all pigs.
Conclusion
End-diastolic effective myocardial stiffness increases linearly with end-diastolic LV pressure.
Keywords: Myocardial Stiffness, MR Elastography, MRE, Diastolic dysfunction, HFPEF
Introduction
Myocardial stiffness is an extremely important marker of myocardial performance in a variety of cardiac disease states, such as myocardial infarction (1), hypertension (2), nonischemic cardiomyopathies (inclusive of hypertrophic cardiomyopathy, dilated cardiomyopathy and infiltrative cardiomyopathy) (3), and heart failure with preserved ejection fraction (HFPEF) (4,5). Currently, myocardial stiffness can only be assessed with precise, invasive pressure-volume (P-V) measurements, which are impractical to perform on large patient populations.
Recently, magnetic resonance elastography (MRE) has been used to map the shear stiffness of soft tissues (6–11). MRE is a noninvasive phase contrast technique that synchronizes external motion with the motion encoding gradients to produce wave images in the phase of MR image. These wave images are then inverted using an algorithm to obtain a map of effective myocardial stiffness. In skeletal muscle this effective stiffness has been shown to increase with muscle contraction (12) with increasing passive tension (13), and with pathological conditions such as hyperthyroidism (14). Thus MRE effective stiffness appears to combine the force of contraction, loading conditions, and material properties of the tissue.
Previous animal studies (15–17) demonstrated good correlation between MRE effective myocardial stiffness and left ventricular (LV) pressure over the course of the cardiac cycle, suggesting MRE effective stiffness incorporates myocardial contraction. However, there have been no studies demonstrating changes in MRE effective stiffness with changes in load in the absence of active contraction. Therefore the purpose of this study was to compare MRE-based effective stiffness measurements to end-diastolic LV pressure at different loading conditions.
Methods
Experiment Setup
In vivo cardiac MRE was performed on four pigs (mean weight: 39.5 kg 3-Male, 1-Female) in compliance with our institutional animal care and use committee. The animals were anesthetized by intramuscular injections of a cocktail containing telazol (5mg/kg), xylazine (2mg/kg) and glycopyrrolate (0.06mg/kg) and were maintained using an isoflurane inhalation anesthesia (1–3%) and mechanical ventilation. Prior to being placed in the MRI scanner, a fluid filled pressure sensor (M1006B, Philips Medical Systems, Andover, MA) was placed in the LV catheter via femoral arterial puncture. During scanning, LV pressure waveforms were sampled at rate of 1 kHz and were recorded using a notebook computer (Core-2 Duo processor, Lenovo, Morrisville, NC).
MRE acquisitions were performed (described below) with simultaneous LV pressure measurement. Each animal underwent intravenous bolus injection of Dextran-40 at a dose estimated to be equal to 20% of the pig’s blood volume, where blood volume in liters was estimated as 8% of body weight in kilograms (18). MRE was repeated immediately after Dextran injection. This process was repeated four or five times depending on the ability of the pig to tolerate increases in intravascular volume.
Image Acquisition
All imaging was performed in a 1.5-Tesla MRI scanner (Signa Excite, GE Health Care, Milwaukee, WI). The pigs were positioned in the supine position and placed feet first into the scanner. A steady state free precession sequence (SSFP) with 20 cardiac phases was used to acquire a short-axis slice at the midventricular level avoiding the papillary muscles. From the SSFP sequence, the image with the largest LV chamber diameter was selected as the end-diastolic image and the trigger delay of this image was used as the trigger delay for the subsequent MRE acquisition.
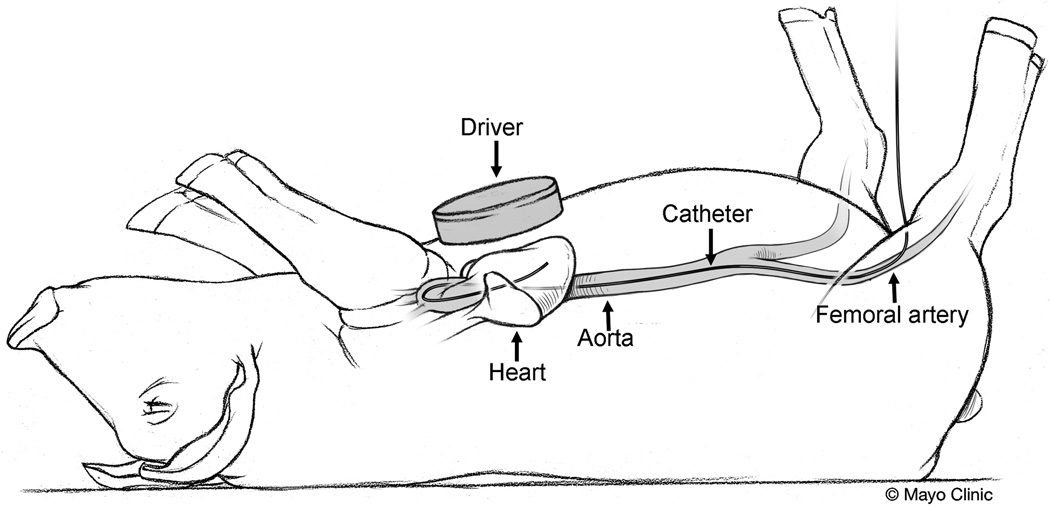
For MRE, mechanical waves were introduced into the heart by a pneumatic driver system as shown in figure 1. A cine gradient echo MRE sequence (16,17) with specified trigger delay was used to obtain end-diastolic images of induced motion. Imaging parameters included TE/TR= 9.3/12.5 ms; FOV= 35 cm; α= 30°; slice thickness= 8 mm; acquisition matrix= 220×64; receiver bandwidth= ±62.5 kHz; sense acceleration factor= 2; excitation frequency= 80 Hz; heart rate= 80–143 bpm; VPS= 4; cardiac phases= 10; 4 MRE time offsets; and 6.25-ms duration (160 Hz) motion encoding gradients were applied separately in the x and y directions to measure the in-plane motion. For each polarizing direction the scan time was in the range of ~13–24 sec depending on the heart rate.
Figure 1.
Cartoon of the pig showing the MRE driver placed on the chest wall of the pig to induce external motion into the heart and a pressure catheter inserted through the femoral artery into the LV for real time measurement of LV chamber pressure.
Image Analysis
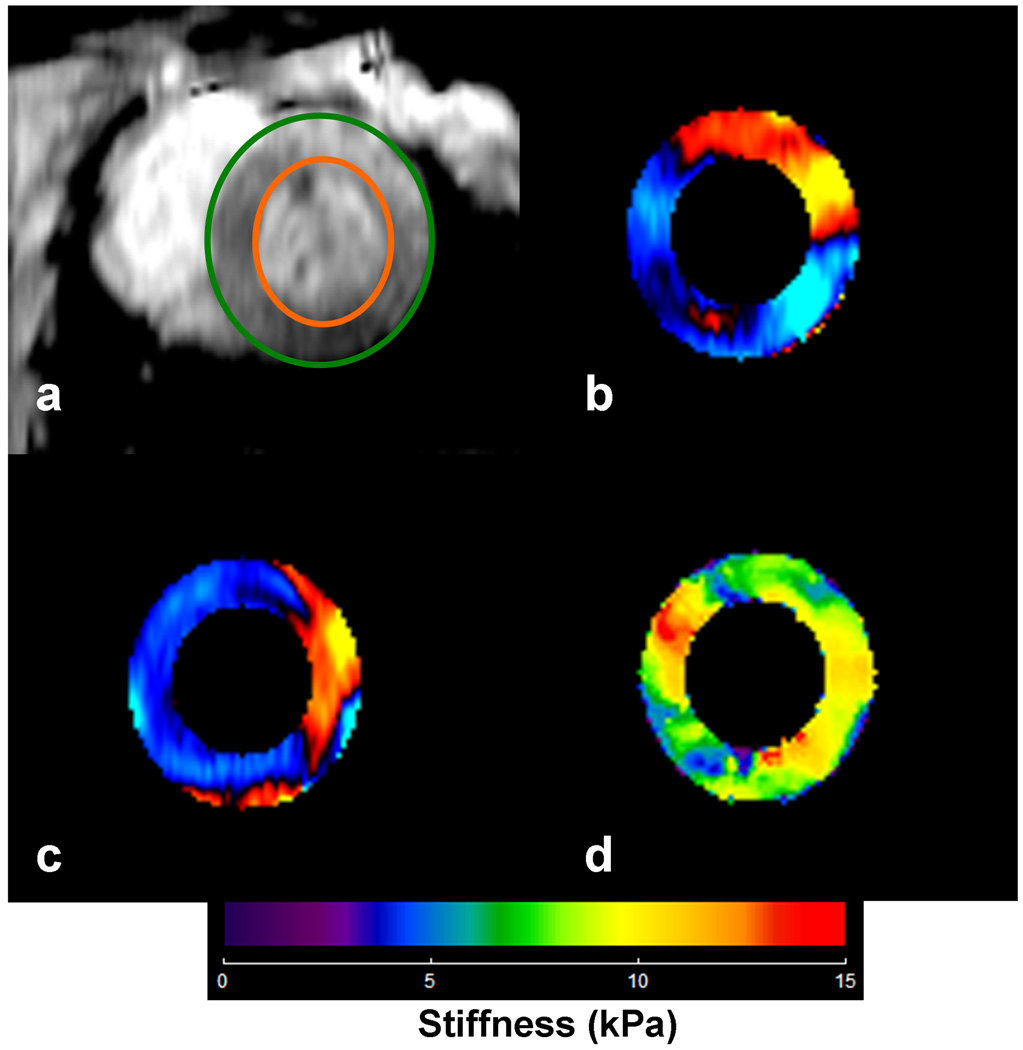
The short-axis MRE wave images in all the animals were masked with epicardial and endocardial contours to obtain only the left ventricular (LV) myocardium as shown in figure 2. The x and y components of motion were analyzed using a spherical shell analysis (15–17,19) to obtain mean effective stiffness measurements during each infusion at the end-diastolic phase for each animal. The spherical shell inversion equation is unstable at the poles as the cotangent function at the poles goes to zero. Therefore, we performed a two-stage analysis by rotating the displacement field (i.e. radial and circumferential displacements obtained from x and y components of motion) in steps of 30° around a complete 360° and performing separate inversions each time. A mean stiffness estimate from all rotations was then calculated automatically, excluding the ±15° regions around the poles from each rotation. The spherical shell analysis is based on a thin-shell assumption and is only valid when the inner radius is greater than the thickness of the shell. However, in some cases in this in vivo model, the inner radius was almost equal to or even less than the thickness of the myocardium. Therefore, finite element modeling (FEM) was performed in different spherical shell models to obtain correction factors to adjust the results when the ratio falls into the thick-shell regime, as previously described (19). For the in vivo analysis, the inner radius and thickness of the myocardium were determined from MRE magnitude images. However, in two of four pigs, the ratio of radius to thickness did not fall below 2 and no correction factors were applied. A total of 23 estimates of shear stiffness were obtained. From these, only 7 needed correction factors (5 shear stiffness estimates from one pig and 2 in another).
Figure 2.
a) End-diastolic short axis image of the LV avoiding the papillary muscles in pig #3 after 2nd infusion of dextran-40. The green and orange circles show delineation of LV myocardium. b, c) Corresponding radial and circumferential components of displacements obtained from MRE acquisition, which are provided as input to spherical shell inversion to obtain the stiffness map. d) Corresponding stiffness map at end-diastole with a mean stiffness of 8.4±2.4 (kPa). After the application of the correction factor the mean value is reported to be 8.9 (kPa).
Statistical Analysis
A least squares linear regression fit was performed between effective end-diastolic myocardial effective stiffness and end-diastolic LV pressure separately for each pig and also for all pigs combined.
Results
Figure 2 (a, b, c) shows the radial and circumference component of displacement from one of the animals at an end-diastolic pressure of 6.4 mmHg and the corresponding effective end-diastolic stiffness map with mean effective stiffness value of 8.4 kPa. After the application of the correction factor the stiffness is reported to be 8.9 kPa.
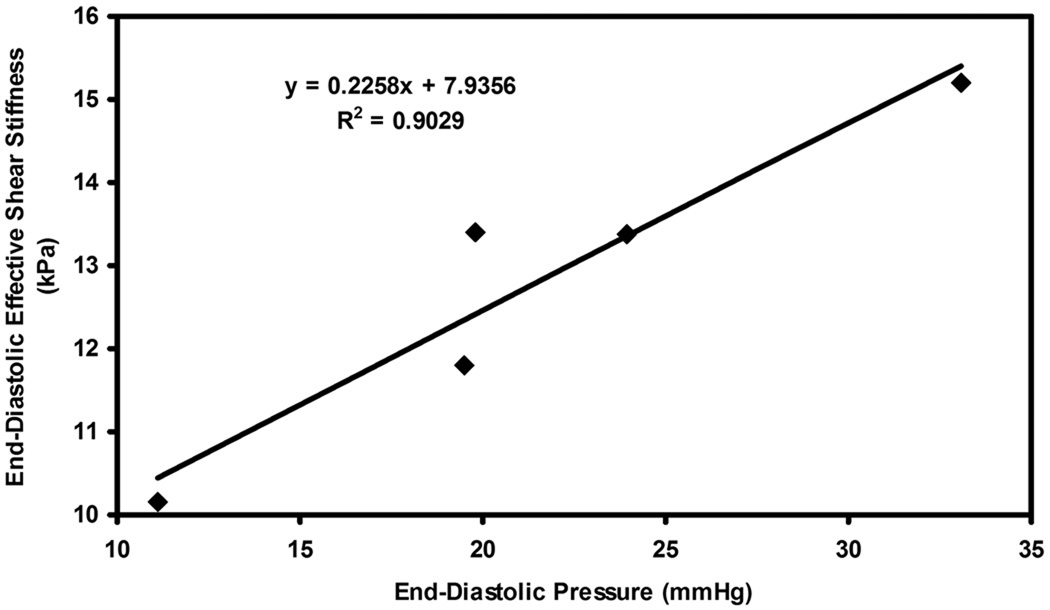
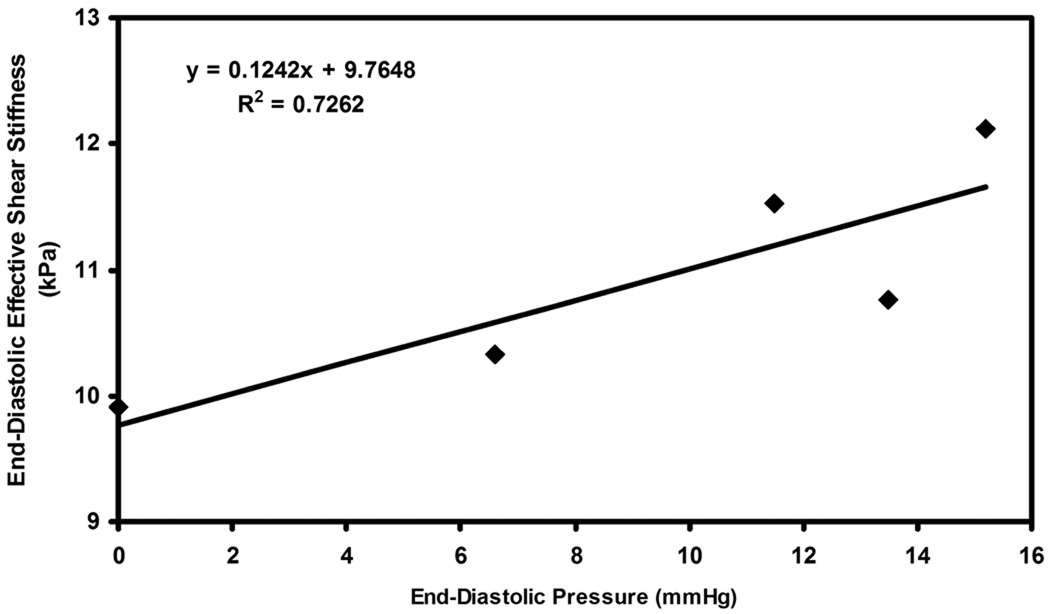
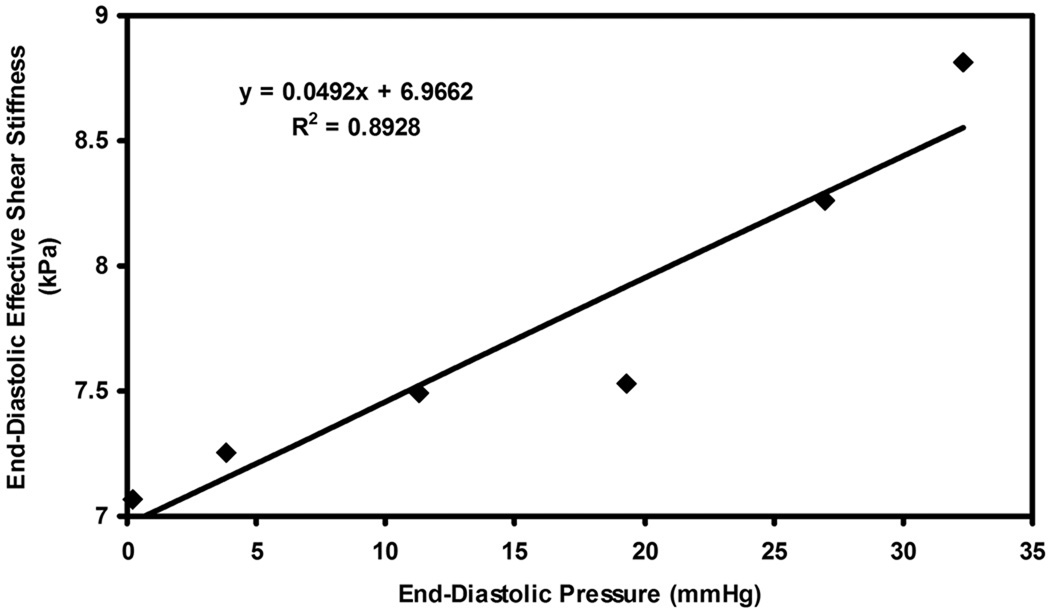
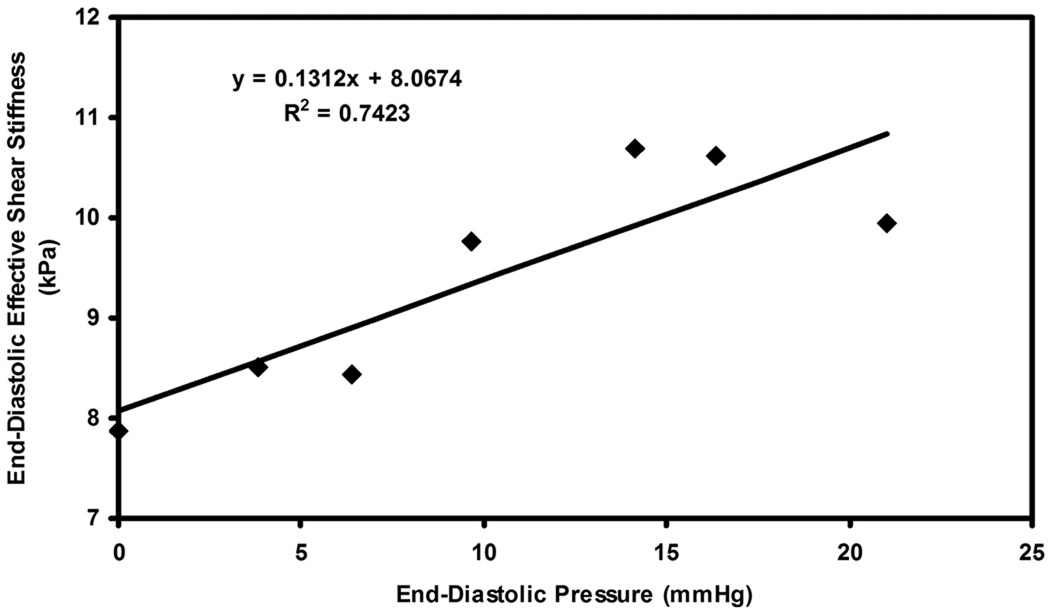
Figure 3–6 show plots of effective end-diastolic shear stiffness plotted as a function of increase in end-diastolic pressure at each infusion for each animal respectively. It can be observed that a good linear correlation was observed between effective shear stiffness and pressure in each animal with an R2 value ranging from 0.73– 0.9.
Figure 3.
Plot of end-diastolic pressure versus end-diastolic effective shear stiffness in pig 1 for infusions of dextran-40.
Figure 6.
Plot of end-diastolic pressure versus end-diastolic effective shear stiffness in pig 4 for infusions of dextran-40.
Figure 7 shows the plot of end-diastolic effective shear stiffness as function of end-diastolic pressure pooled from all animals for all infusions. A linear correlation of R2 = 0.26 was determined between pressure and stiffness.
Figure 7.
Plot of end-diastolic pressure versus end-diastolic effective shear stiffness pooled from all the pigs for all infusions of dextran-40.
Discussion
This study showed a linear correlation between MRE effective stiffness and end-diastolic pressure at different loading conditions in the absence of active contraction.
This study differs from other recent MRE studies showing changes in effective stiffness with LV pressure, (17,20) as all previous studies measured LV pressure across the cardiac cycle. Our study demonstrates myocardium at its passive state and shows that the effect of load (i.e. tension induced by infusion of dextran-40) is measured by MRE on myocardium.
Studies from other institutions (21,22) have demonstrated that MRE is capable of identifying changes in MRE-measured displacements across cardiac cycle in a region of interest (23,24). With that technique the amplitude of displacement is used as a relative measure of stiffness, which can be used to compare one region of myocardium to another within the same subject. The technique used in the current study in principle can spatially resolve effective stiffness and also can be done automatically.
It may be noted that the correlation between end-diastolic LV pressure and effective stiffness had a different slope for each pig, as observed from the linear fits in the plots, with the slopes varying from 0.05–0.23. We believe that some of these inter-animal variations may be due to true physiological differences and the response of each pig to each infusion. Some might also be from the assumptions made in and the limitations of the post-processing technique (described below), or the slight variation in measuring pressures using the catheter in vivo. Therefore, when each pig is considered as its own independent sample correlating LV end-diastolic stiffness to end-diastolic LV pressure the linear fits have a high correlation. However, these fits are sufficiently different that a global equation (as in Figure 7) cannot be used in correlating stiffness to pressure during end-diastole.
There are several limitations to this study. First, the spherical shell inversion is a two-dimensional (2D) inversion and neglects the through plane component of motion (i.e. torsional motion). Wave propagation within cardiac muscle is not planar but rather follows the orientation of muscle fiber bundles; therefore, a true three-dimensional (3D) inversion should be required to obtain effective stiffness of the myocardium including torsional motion. 3D inversion requires a 3D volumetric data acquisition, which in turn requires long scan times and is not currently feasible. Future work will involve incorporating 3D inversion by accelerating data acquisition, so volumetric data can be obtained in a single breath hold. Second, the spherical shell inversion requires high-order derivatives to obtain effective stiffness measurements. Determining these high-order derivatives can cause errors at the edges of the tissue. Therefore, regions of interest were drawn to avoid these residual edge artifacts. Third, spherical shell inversion requires estimation of radius and thickness and improper estimation of radius and thickness will also alter the stiffness estimates. Fourth, the spherical shell analysis contains the load term Pa. For our analysis Pa was set to zero, as there is no way currently known to us of accurately measuring Pa in vivo. Therefore the stiffness measurements obtained were relative within a pig and not absolute. For the reasons above, and because of the anisotropic nature of the heart, it is difficult to compare the stiffness measurements obtained in this study against previous measurements (21–24) to determine if the current values are underestimated or overestimated.
Despite these limitations we have shown a linear correlation of effective stiffness to pressure, indicating that effective stiffness might be a useful parameter for diagnosing different cardiac diseases. Future applications of MRE will be investigated to diagnose different cardiac disease states in vivo, and more elaborate studies will be performed to attempt to separate the influence of load in measuring stiffness.
In conclusion, we have demonstrated that end-diastolic effective myocardial stiffness increases linearly with end-diastolic pressure. As sophistication with the technique evolves, MRE may develop utility in the noninvasive evaluation of intrinsic myocardial properties in a variety of cardiovascular conditions. This is an exciting prospect, as it not only represents a complement to current diagnostic modalities, but also represents an insight as to how abnormalities intrinsic to the myocardium affect overall performance. This has implications with regard to known physiologic processes such as remodeling and how this may potentially be diagnosed earlier in order to exact greater therapeutic efficacy with current strategies.
Figure 4.
Plot of end-diastolic pressure versus end-diastolic effective shear stiffness in pig 2 for infusions of dextran-40.
Figure 5.
Plot of end-diastolic pressure versus end-diastolic effective shear stiffness in pig 3 for infusions of dextran-40.
Acknowledgements
The authors would like to thank Joseph A. Rysavy for his technical help in preparing the animals.
Grant Support: Mayo CR 20, National Institutes of Health Grant EB001981, EB007593
References
- 1.Litwin SE, Litwin CM, Raya TE, Warner AL, Goldman S. Contractility and stiffness of noninfarcted myocardium after coronary ligation in rats. Effects of chronic angiotensin converting enzyme inhibition. Circulation. 1991;83(3):1028–1037. doi: 10.1161/01.cir.83.3.1028. [DOI] [PubMed] [Google Scholar]
- 2.Boluyt MO, Bing OH, Lakatta EG. The ageing spontaneously hypertensive rat as a model of the transition from stable compensated hypertrophy to heart failure. Eur Heart J. 1995;16 Suppl N:19–30. doi: 10.1093/eurheartj/16.suppl_n.19. [DOI] [PubMed] [Google Scholar]
- 3.Hoskins AC, Jacques A, Bardswell SC, et al. Normal passive viscoelasticity but abnormal myofibrillar force generation in human hypertrophic cardiomyopathy. Journal of molecular and cellular cardiology. doi: 10.1016/j.yjmcc.2010.06.006. [DOI] [PMC free article] [PubMed] [Google Scholar]
- 4.Leite-Moreira AF. Current perspectives in diastolic dysfunction and diastolic heart failure. Heart (British Cardiac Society) 2006;92(5):712–718. doi: 10.1136/hrt.2005.062950. [DOI] [PMC free article] [PubMed] [Google Scholar]
- 5.Zile MR, Baicu CF, Gaasch WH. Diastolic heart failure--abnormalities in active relaxation and passive stiffness of the left ventricle. N Engl J Med. 2004;350(19):1953–1959. doi: 10.1056/NEJMoa032566. [DOI] [PubMed] [Google Scholar]
- 6.Yin M, Talwalkar JA, Glaser KJ, et al. Assessment of hepatic fibrosis with magnetic resonance elastography. Clinical Gastroenterology and Hepatology. 2007;5:1207–1213. doi: 10.1016/j.cgh.2007.06.012. [DOI] [PMC free article] [PubMed] [Google Scholar]
- 7.Sinkus R, Tanter M, Catheline S, et al. Imaging anisotropic and viscous properties of breast tissue by magnetic resonance elastography. Magnetic Resonance in Medicine. 2005;53:372–387. doi: 10.1002/mrm.20355. [DOI] [PubMed] [Google Scholar]
- 8.Sack I, Beierbach B, Hamhaber U, Klatt D, Braun J. Non-invasive measurement of brain viscoelasticity using magnetic resonance elastography. NMR Biomed. 2008;21(3):265–271. doi: 10.1002/nbm.1189. [DOI] [PubMed] [Google Scholar]
- 9.Rouviere O, Yin M, Dresner MA, et al. MR elastography of the liver: preliminary results. Radiology. 2006;240(2):440–448. doi: 10.1148/radiol.2402050606. [DOI] [PubMed] [Google Scholar]
- 10.Ringleb SI, Bensamoun SF, Chen Q, Manduca A, An KN, Ehman RL. Applications of magnetic resonance elastography to healthy and pathologic skeletal muscle. J Magn Reson Imaging. 2007;25(2):301–309. doi: 10.1002/jmri.20817. [DOI] [PubMed] [Google Scholar]
- 11.Muthupillai R, Lomas DJ, Rossman PJ, Greenleaf JF, Manduca A, Ehman RL. Magnetic resonance elastography by direct visualization of propagating acoustic strain waves. Science. 1995;269(5232):1854–1857. doi: 10.1126/science.7569924. [DOI] [PubMed] [Google Scholar]
- 12.Bensamoun SF, Glaser KJ, Ringleb SI, Chen Q, Ehman RL, An KN. Rapid magnetic resonance elastography of muscle using one-dimensional projection. J Magn Reson Imaging. 2008;27(5):1083–1088. doi: 10.1002/jmri.21307. [DOI] [PubMed] [Google Scholar]
- 13.Dresner MA, Rose GH, Rossman PJ, Muthupillai R, Manduca A, Ehman RL. Magnetic resonance elastography of skeletal muscle. J Magn Reson Imaging. 2001;13(2):269–276. doi: 10.1002/1522-2586(200102)13:2<269::aid-jmri1039>3.0.co;2-1. [DOI] [PubMed] [Google Scholar]
- 14.Bensamoun SF, Ringleb SI, Chen Q, Ehman RL, An KN, Brennan M. Thigh muscle stiffness assessed with magnetic resonance elastography in hyperthyroid patients before and after medical treatment. J Magn Reson Imaging. 2007;26(3):708–713. doi: 10.1002/jmri.21073. [DOI] [PubMed] [Google Scholar]
- 15.Kolipaka A, McGee KP, Araoz PA, et al. MR elastography as a method for the assessment of myocardial stiffness: comparison with an established pressure-volume model in a left ventricular model of the heart. Magn Reson Med. 2009;62(1):135–140. doi: 10.1002/mrm.21991. [DOI] [PMC free article] [PubMed] [Google Scholar]
- 16.Kolipaka A, McGee KP, Araoz PA, Glaser KJ, Manduca A, Ehman RL. Evaluation of a rapid, multiphase MRE sequence in a heart-simulating phantom. Magn Reson Med. 2009;62(3):691–698. doi: 10.1002/mrm.22048. [DOI] [PMC free article] [PubMed] [Google Scholar]
- 17.Kolipaka A, Araoz PA, McGee KP, Manduca A, Ehman RL. Magnetic resonance elastography as a method for the assessment of effective myocardial stiffness throughout the cardiac cycle. Magn Reson Med. doi: 10.1002/mrm.22467. [DOI] [PMC free article] [PubMed] [Google Scholar]
- 18.McGlone J, Pond W. Pig production: Biological principles and applications. 1st Edition. Kentucky: Delmar Learning, a division of Thomson Learning, Inc; 2003. 34 pp. [Google Scholar]
- 19.Kolipaka A, McGee KP, Manduca A, et al. Magnetic resonance elastography: Inversions in bounded media. Magn Reson Med. 2009;62(6):1533–1542. doi: 10.1002/mrm.22144. [DOI] [PMC free article] [PubMed] [Google Scholar]
- 20.Elgeti T, Laule M, Kaufels N, et al. Assessment of heart function by cardiac MR elastography: Comparison to left ventricular pressure measurements. Proceedings of the 17th Annual Meeting of ISMRM; Honolulu, Hawaii. 2009. (abstract 1791) [Google Scholar]
- 21.Elgeti T, Laule M, Kaufels N, et al. Cardiac MR elastography: comparison with left ventricular pressure measurement. J Cardiovasc Magn Reson. 2009;11:44. doi: 10.1186/1532-429X-11-44. [DOI] [PMC free article] [PubMed] [Google Scholar]
- 22.Elgeti T, Rump J, Hamhaber U, et al. Cardiac magnetic resonance elastography. Initial results. Invest Radiol. 2008;43(11):762–772. doi: 10.1097/RLI.0b013e3181822085. [DOI] [PubMed] [Google Scholar]
- 23.Rump J, Klatt D, Braun J, Warmuth C, Sack I. Fractional encoding of harmonic motions in MR elastography. Magn Reson Med. 2007;57(2):388–395. doi: 10.1002/mrm.21152. [DOI] [PubMed] [Google Scholar]
- 24.Sinkus R, Robert B, Gennisson J-L, Tanter M, Fink M. Single Breath Hold Transient MR-Elastography of the Heart - Imaging Pulsed Shear Wave Propagation Induced by Aortic Valve Closure. Proceedings of the 14th Annual Meeting of ISMRM; Seattle, Washington. 2006. (abstract 77) [Google Scholar]


