

Abstract
High number of melanocytic nevi is the most important known risk factor for cutaneous melanoma. We conducted a genome-wide association study for nevus count using 297,108 tag-SNPs in 1,524 twins and validated our results in an independent cohort of 4,107 subjects. We identified strongly associated variants in MTAP, a gene adjacent to the familial melanoma susceptibility locus CDKN2A on 9p21 (rs4636294, P = 3.4 × 10⁻¹⁵). We further identified PLA2G6 on 22q13.1 (rs2284063, P = 3.4 × 10⁻⁸). Both loci were also associated with melanoma risk in 3,131 melanoma cases from two independent studies (odds-ratios 1.23 at rs10757257 and rs132985). About one subject in 11 is homozygous for the variant at both loci with twice the number of nevi compared to those homozygous for the protective alleles, and double the risk for melanoma. These data provide the first evidence for common melanoma alleles whose effects are mediated through nevus number.
The worldwide incidence of cutaneous melanoma in European descent populations has risen rapidly over the past 30 years, more than for any other malignancy [1]. The World Health Organization estimates 132,000 new cases of melanoma per year globally. Approximately 10% of malignant melanoma cases occur in multiplex families, with the CDKN2A locus in 9p21 accounting for susceptibility in 20-57% of all melanoma families [2]. However, remaining cases of familial melanoma do not carry mutations in CDKN2A and additional tumor suppressor genes at 9p21 and elsewhere have been proposed [3]. Large numbers of nevi are the strongest known risk factor for melanoma [4] and in many familial cases susceptibility to melanoma is associated with an excess of nevi. Linkage to 9p21 has been found in two genome-wide analyses looking at nevus count [6,7] suggesting that shared genetic factors might be involved in melanoma susceptibility and nevogenesis. Understanding the genetic bases of nevus formation is therefore an important step in understanding melanoma etiology.
To search for loci involved in nevus count, we carried out a genome-wide association study (GWAS) in 1,524 healthy adult female twins from the TwinsUK registry using 297,108 SNPs with minor allele frequency (MAF) > 1% on Illumina HumanHap 300k duo chips (See Methods). Total body nevus count was evaluated by trained research nurses and defined as the sum of all nevi at least 2 mm in diameter. Comparison of the observed and expected distributions (Supplementary Figure 1) showed no evidence for inflation of the test statistics (inflation factor = 1.006) and highlighted 46 SNPs having P values < 10-4 against the expected 29. We selected twelve SNPs for follow up that clustered in either the 9p21 or 22q13 chromosomal regions (Figure 1). We replicated these SNP associations in an independent sample of 4,107 adolescent subjects of European ancestry from the Brisbane Twin Nevus Study (BTNS) for whom nevus count had been evaluated using a similar protocol (See Methods).
Figure 1.
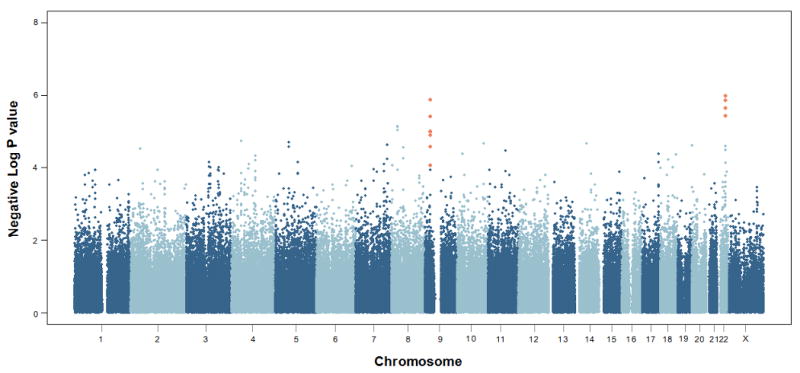
Genome-wide plot for total nevus count in the TwinsUK sample. The SNPs typed and replicated in the Brisbane Adolescent Nevus Study sample are highlighted.
At the replication stage (Table 1) the strongest association signal was observed for rs4636294 (combined P = 3.4 × 10⁻¹⁵). This marker is located in the 5′ UTR of the methylthioadenosine phosphorylase (MTAP) gene located at 9p21, next to CDKN2A (Figure 2a). The other replicated region on 22q13 (Figure 2b) showed the highest combined association signal with rs2284063 (combined P = 3.4 × 10⁻⁸). This SNP lies in the intron between the second and third exon of PLA2G6, belonging to the phospholipase A2 (PLA2) superfamily of genes [8]. The 9p21 and 22q13 loci accounted for 1.5% (UK) and 3.0% (Australia), and for 1.9% (UK) and 0.7% (Australia) of nevus count variance, respectively.
Table 1.
Total nevus count: summary association results and follow-up for the 9p21 and 22q13 regions. Effect size (beta) and standard error (SE) are expressed in log (nevi). The meta-analytic P values are calculated using a weighted Z-score method.
| Marker | Chromosome | MAF Allele TwinsUK | Beta (SE) TwinsUK | P TwinsUK | Beta (SE) BTNS * | P BTNS | Combined P | Heterogeneity P |
|---|---|---|---|---|---|---|---|---|
| rs4636294 | 9 | 0.48 (A) | 0.188 (0.042) | 9.8 × 10⁻⁶ | 0.197 (0.037) | 6.6 × 10⁻¹¹ | 3.4 × 10⁻¹⁵ | 0.48 |
| rs2218220 | 9 | 0.48 (C) | 0.188 (0.043) | 1.0 × 10⁻⁵ | 0.194 (0.037) | 1.1 × 10⁻¹⁰ | 5.7 × 10⁻¹⁵ | 0.57 |
| rs751173 | 9 | 0.46 (G) | 0.166 (0.042) | 8.5 × 10⁻⁵ | 0.168 (0.037) | 2.6 × 10⁻¹⁰ | 9.9 × 10⁻¹⁴ | 0.95 |
| rs7023329 | 9 | 0.50 (A) | 0.184 (0.042) | 1.3 × 10⁻⁵ | 0.164 (0.036) | 2.6 × 10⁻⁷ | 2.6 × 10⁻¹¹ | 0.53 |
| rs10757257 | 9 | 0.40 (A) | -0.205 (0.042) | 1.3 × 10⁻⁶ | -0.147 (0.037) | 1.3 × 10⁻⁶ | 2.9 × 10⁻¹¹ | 0.11 |
| rs1335510 | 9 | 0.41 (G) | -0.198 (0.043) | 3.9 × 10⁻⁶ | -0.145 (0.037) | 5.3 × 10⁻⁶ | 3.2 × 10⁻¹⁰ 10 | 0.12 |
| rs1341866 | 9 | 0.41 (G) | -0.189 (0.043) | 1.0 × 10⁻⁵ | -0.143 (0.037) | 5.2 × 10⁻⁶ | 6.2 × 10⁻¹⁰ | 0.16 |
| rs10811629 | 9 | 0.41 (G) | -0.175 (0.042) | 2.7 × 10⁻⁵ | -0.089 (0.037) | 4.7 × 10⁻³ | 4.3 × 10⁻⁶ | 0.03 |
| rs2284063 | 22 | 0.35 (G) | -0.209 (0.045) | 2.3 × 10⁻⁶ | -0.078 (0.039) | 3.4 × 10⁻⁴ | 3.4 × 10⁻⁸ | 0.03 |
| rs6001027 | 22 | 0.35 (G) | -0.209 (0.045) | 3.8 × 10⁻⁶ | -0.078 (0.039) | 3.6 × 10⁻⁴ | 5.0 × 10⁻⁸ | 0.04 |
| rs132985 | 22 | 0.46 (T) | -0.209 (0.043) | 1.0 × 10⁻⁶ | -0.055 (0.037) | 1.5 × 10⁻² | 4.0 × 10⁻⁶ | 4.0 × 10⁻³ |
| rs738322 | 22 | 0.47 (A) | -0.209 (0.043) | 1.4 × 10⁻⁶ | -0.056 (0.037) | 4.6 × 10⁻² | 2.5 × 10⁻⁵ | 2.0 × 10⁻³ |
BTNS Beta and SE are reported on the log scale to make them comparable to the TwinsUK results. P values have been evaluated using cube-root transformation which better fits the BTNS data (See Methods).
Figure 2.

Regional plot for the chromosomes 9p21 (a) and 22q13 (b). Meta analysis log10 P values are plotted as a function of genomic position (Build 36). The P values for the lead SNPs are denoted by large blue (combined discovery and replication) diamonds. Proxies are indicated with diamonds of smaller size, with colours assigned based on the pairwise r2 values with the lead SNP in the HapMap CEU sample: red (r2>0.8), orange (0.5<r2<0.8) or yellow (0.2<r2<0.5). White indicates either no LD with the lead SNP (r2<0.2), or loci where such information was not available. Recombination rate estimates (HapMap Phase II) are given in light blue, Refseq genes (NCBI) in green.
The combined additive effect of rs4636294 and rs2284063 markedly increases the observed number of nevi. Indeed, subjects in the TwinsUK discovery sample homozygous for both variants (7%) had more than double the number of nevi (median number of nevi = 30) compared to subjects homozygous for the protective alleles (median number of nevi = 12.5). Subjects in the Australian BTNS sample are characterized by an overall larger number of nevi (median number of nevi = 93 compared to 21 in the TwinsUK sample). Homozygous subjects for both variants in the Australian population (11%) also showed greater median number of nevi (116) than homozygous individuals for the protective alleles (79) (Figure 3 and Supplementary Table 1). Sun exposure varies greatly between the UK and Australian samples. The number of sunburns over a lifetime and the skin type (measured according to the Fitzpatrick classification) were not related to the number of nevi in either sample (see also Supplementary Table 2 for the distributions in the two countries). Therefore, adjusting for these two measures did not affect our results.
Figure 3.

Box-plot of number of nevi for subjects in the TwinsUK (left) and BNTS (right) samples homozygous for both MTAP SNP rs4636294 and PLA2G6 SNP rs2284063 variants against the subjects homozygous for the protective alleles.
We explored whether these two genetic regions were also involved directly or indirectly in melanoma susceptibility by analysing two melanoma case-control samples: the Queensland study of Melanoma, Environment and Genetic Association (Q-MEGA) which included 1,734 cases and 1,811 controls of northern European origin, and the Leeds melanoma case-control study of North UK including 1,274 incident melanoma cases, 123 cases with a family history of melanoma, and 496 controls plus 1,395 controls from the Wellcome Trust Case-Control Consortium (WTCCC) 1958 birth cohort samples. (Details are provided in Methods).
We derived joint odds ratios (OR) and confidence intervals under a fixed-effects model for each SNP, and associated P values from the standard normal distribution. As expected, we observed a small degree of heterogeneity for some of the SNPs shown by the lack of complete agreement for the highest association signals in the two samples. The highest combined ORs were 1.23 (95% CI = 1.15 - 1.30) for rs10757257 at 9p21 and 1.23 (95% CI = 1.15 - 1.30) for rs132985 at 22q13 (Table 2 and Supplementary Figure 2). ORs at the SNPs giving the most significant results in the nevus count analyses were 1.21 (95% CI = 1.14 – 1.28) for rs4636294, and 1.19 (95% CI = 1.12 – 1.27) for rs2284063. Population attributable risk of the two loci reflected their different effect in the Australian and UK populations, ranging from 20.0% (Australia) to 9.0% (UK) for 9p21 and from 14.8 (Australia) to 29.3 (UK) for 22q13.
Table 2.
Melanoma: summary results for the lead SNPs from the 9p21 and 22q13 loci for cutaneous melanoma. Joint odds ratios and confidence intervals were evaluated under a fixed-effects model for each SNP. Associated P values were estimated from the standard normal distribution.
| Allele reference | Risk allele frequency | ||||||||||
|---|---|---|---|---|---|---|---|---|---|---|---|
| Marker | Chromosome | Sample | Base | Risk | Controls | Cases | OR per risk allele (95% CI) | P | Combined OR per risk allele (95% CI) | Combined P | Heterogeneity P |
| rs4636294 | 9 | Q-MEGA LEEDS2 |
G | A | 0.48 0.48 |
0.55 0.51 |
1.31 (1.19, 1.46) 1.11 (1.01, 1.22) |
1.7 × 10⁻⁷ 0.029 |
1.21 (1.14, 1.28) | 3.7 × 10⁻⁸ | 4.0 × 10⁻³ |
| rs2218220 | 9 | Q-MEGA LEEDS2 |
T | C | 0.49 0.48 |
0.54 0.51 |
1.29 (1.17, 1.44) 1.13 (1.03, 1.25) |
5.7 × 10⁻⁷ 0.011 |
1.21 (1.14, 1.27) | 4.8 × 10⁻⁸ | 0.02 |
| rs7023329 | 9 | Q-MEGA LEEDS2 |
G | A | 0.50 0.49 |
0.54 0.53 |
1.22 (1.11, 1.37) 1.17 (1.06, 1.29) |
1.2 × 10⁻⁴ 0.001 |
1.20 (1.13, 1.26) | 2.7 × 10⁻⁷ | 0.48 |
| rs10757257 | 9 | Q-MEGA LEEDS1 |
A | G | 0.58 0.58 |
0.64 0.62 |
1.30 (1.17, 1.44) 1.16 (1.05, 1.28) |
7.7 × 10⁻⁷ 0.003 |
1.23 (1.15, 1.30) | 3.4 × 10⁻⁸ | 0.06 |
| rs751173 | 9 | Q-MEGA LEEDS1 |
A | G | 0.46 0.46 |
0.51 0.48 |
1.28 (1.16, 1.42) 1.07 (0.97, 1.18) |
1.9 × 10⁻⁶ 0.152 |
1.17 (1.11, 1.24) | 5.6 × 10⁻⁶ | 3.0 × 10⁻³ |
| rs1335510 | 9 | Q-MEGA LEEDS1 |
G | T | 0.58 0.57 |
0.63 0.60 |
1.26 (1.14, 1.40) 1.12 (1.02, 1.24) |
1.1 × 10⁻⁵ 0.020 |
1.19 (1.12, 1.25) | 1.1 × 10⁻⁷ | 0.05 |
| rs1341866 | 9 | Q-MEGA LEEDS1 |
G | A | 0.58 0.58 |
0.63 0.60 |
1.24 (1.13, 1.39) 1.13 (1.02, 1.25) |
2.6 × 10⁻⁵ 0.015 |
1.19 (1.12, 1.26) | 6.9 × 10⁻⁷ | 0.12 |
| rs10811629 | 9 | Q-MEGA LEEDS1 |
G | A | 0.57 0.56 |
0.61 0.62 |
1.19 (1.08, 1.32) 1.28 (1.06, 1.55) |
1.3 × 10⁻⁴ 0.010 |
1.21 (1.12, 1.30) | 1.6 × 10⁻⁵ | 0.41 |
| rs2284063 | 22 | Q-MEGA LEEDS2 |
G | A | 0.65 0.63 |
0.66 0.69 |
1.06 (0.95, 1.19) 1.30 (1.18, 1.44) |
0.275 2.3 × 10⁻⁷ |
1.19 (1.12, 1.27) | 1.5 × 10⁻⁶ | 1.0 × 10⁻³ |
| rs6001027 | 22 | Q-MEGA LEEDS2 |
G | A | 0.65 0.64 |
0.66 0.69 |
1.06 (0.95, 1.19) 1.25 (1.13, 1.38) |
0.275 2.0 × 10⁻⁵ |
1.16 (1.09, 1.24) | 6.8 × 10⁻⁵ | 0.01 |
| rs132985 | 22 | Q-MEGA LEEDS1 |
T | C | 0.53 0.52 |
0.56 0.58 |
1.18 (1.05, 1.30) 1.26 (1.14, 1.38) |
2.7 × 10⁻³ 2.8 × 10⁻⁶ |
1.23 (1.15, 1.30) | 2.6 × 10⁻⁷ | 0.31 |
| rs738322 | 22 | Q-MEGA LEEDS1 |
G | A | 0.53 0.52 |
0.55 0.57 |
1.18 (1.05, 1.30) 1.23 (1.12, 1.36) |
2.8 × 10⁻³ 1.4 × 10⁻⁶ |
1.21 (1.14, 1.28) | 3.0 × 10⁻⁷ | 0.51 |
We used the Leeds sample to evaluate the combined risk for melanoma at both loci (Supplementary Table 3). Subjects homozygous at the two loci have double the risk (OR = 1.94; 95% CI = 1.19 – 3.16).
From the Leeds case-control study 903 cases and 485 controls were assessed for their nevus phenotype through a standardised nevus count protocol, similar to that used in the TwinsUK sample. We used this sub-sample to explore whether the association between the identified loci and melanoma was direct or mediated by nevus count. Using these 485 controls we verified that the effect of the nevus count loci was consistent with what was observed with the TwinsUK and BTNS samples. The results using this sub-sample were still consistent with those reported in Table 2. Odd ratios for melanoma status were then compared with those obtained when the number of nevi was included in the logistic regression (Supplementary Table 4). When the association between melanoma and SNP was adjusted for nevus count, the OR for melanoma risk was reduced toward 1.0 and the P value became less significant, consistent with melanoma risk being mediated via nevus count. It is notable that the OR was midway between the unadjusted OR and 1.0 which might be expected as nevus count would not be a perfect measure of risk (including error in its measurement). Indeed, nevus count is likely modified by other genetic influences as well as lifestyle factors. Supplementary Figure 3 online shows the distribution of nevus count in the Leeds case-control sample stratified by genotype for the highest associations on 9p21 and 22q13.
The location of the key SNPs in the 9p21 region is intriguing. They lie in the proximal promoter, 5′UTR and upstream from the coding region of the house keeping gene MTAP, which encodes a key enzyme in the adenine and methionine salvage pathways. MTAP is often co-deleted [9,10] with the adjacent melanoma susceptibility locus CDKN2A, which encodes p16INK4A and p14ARF (Figure 4). The loss of MTAP in some tumors has generally been attributed to its proximity to CDKN2A, but some studies suggest MTAP might function as an independent tumor suppressor [11-12]. A novel fusion transcript has been reported which comprises the first four exons of MTAP plus exons 2 and 3 of the non-coding RNA ANRIL, which has its first exon in the CDKN2A promoter [13]. This points to complex regulation of several genes within this region (Figure 4). A possible hypothesis parallels common cancer susceptibility variants found earlier where long range regulatory effects on established oncogenes (MYC and FAM84B) have been postulated as a possible mechanism underlying multiple cancer associations mapping to a 1.2 Mb gene desert on 8q24 [14]
Figure 4.

Relative positions of genes in the vicinity of the 9p21 association signal (not drawn to scale). Shaded boxes represent exons (ex), which are numbered, and solid lines connecting exons show the normal splicing patterns. Dotted lines between exons (above the figure) denote alternative splicing that generates an MTAP-ANRIL fusion transcript. Arrows indicate the direction of transcription. Gene product names are indicated. Tel (telomere); cen (centromere).
The PLA2G6 gene on 22p13 belongs to the PLA2 superfamily of genes which encode esterases that cleave glycerophospholipids [8]. These enzymes are normally involved in the maintenance of membrane phospholipids, but have recently been shown to regulate cell growth [15] and apoptosis [16], cell proliferation in human tumors such as insulinoma, colon cancer, ovarian cancer, and prostate cancer [17-19] and to be associated with lung cancer susceptibility [20].
We attempted to refine the location of chromosomes 9 and 22 association signals by imputing genotypes from the HapMap in the TwinsUK sample, and identified ten and four imputed SNPs on 9p21 and 22q13 respectively, which showed P values smaller than the strongest peak observed with the typed genotypes and might be helpful to identify some causal variants (Supplementary Table 5).
In the same issue of this journal Bishop et al [21] report a genome-wide association study for melanoma conducted by the GenoMEL consortium. Melanoma cases from Europe and Australia were carefully selected in order to increase the probability that they were enriched for genetic susceptibility. Three associated regions were replicated in two independent samples, one including cases selected for being genetically enriched while the other one was an unselected population-based case-control study. Among the replicated regions they identified the same locus on chromosome 9p21 described in this study, with top hit at rs7023329 (P = 4.03×10⁻⁷). The authors also successfully attempted replication of our association on 22q13 at rs2284063 (P = 2.40×10⁻⁹). The GenoMEL study involves melanoma cases and controls of diverse European ancestry, so the results presented in this paper generalise beyond English and Anglo-Celtic (Australian) ancestry. Understanding how these loci influence the development of nevi could provide important therapeutic clues to treat melanoma but may also be relevant for other cancers.
Methods
Subjects and phenotypes
TwinsUK
The St. Thomas' U.K. adult twin registry (TwinsUK) cohort is unselected for any disease and is representative of the general UK population. Nevus counts were collected at St Thomas Hospital in London and the study was approved by the St Thomas' Hospital Research Ethics Committee. Written informed consent was obtained from every participant to the study. Examination was performed by trained research nurses following a standardized and reproducible nevus count protocol [22]. The total body nevus count (excluding the genital area, breasts, and posterior scalp) was defined as the sum of all nevi >2 mm in diameter.
Genotypic data were available for 1,524 subjects: 206 singletons, 832 dizygous (DZ) and 486 monozygous (MZ) twins. The median (1st - 3rd) age was 47 (37 – 54). The median (1st - 3rd) number of nevi was 21 (8 – 47).
BTNS and Q-MEGA
The Brisbane Twin Nevus Study (BTNS) is described in detail elsewhere [23] and comprised 4,107 adolescent twins, their siblings and parents (1,148 nuclear families) which have been recruited over sixteen years into an ongoing study of genetic and environmental factors contributing to the development of nevi and other risk factors for skin cancer. The twins are recruited at age twelve years via schools around Brisbane, Australia, and followed up at age fourteen. All controls are screened to be unaffected by cutaneous malignant melanoma (CMM). The sample is overwhelmingly (>95%) of northern European origin (mainly Anglo-Celtic).
Total body nevus counting has been performed on the adolescent twins and singleton siblings on two occasions by a trained nurse (at ages 12 and 14). There were 1,979 twins and singleton siblings where nevus counts and genotypes were available. Of the parents of the twins, 1,470 had self-reported nevus score and genotypes available.
The Australian melanoma cases (Q-MEGA) were a stratified sample of 1,734 subjects including all cases of melanoma diagnosed in the state of Queensland in the period 1982-1990, as described in detail elsewhere [24]. These individuals were originally studied between 1991-1994, but were recontacted and interviewed in 2002-2004.
Controls for the present analysis come from the parents of the BTNS families. An additional 658 individuals were genotyped and contributed as controls for the melanoma case-control analysis. All cases and controls gave informed consent to participation in this study, and the study protocol was approved by appropriate institutional review boards.
Leeds Case-Control Study
1,274 population based incident melanoma cases were recruited in a geographically defined area of Yorkshire and the Northern region of the UK. Overall, the study had a 63% response rate. Patients were diagnosed between September 2000 and December 2006. Cases were identified by clinicians, pathology registers and via the Northern and Yorkshire Cancer Registry and Information Service cancer registry to ensure overall ascertainment. For the first three years of the study all patients with invasive melanoma were invited to participate while subsequently only patients with Breslow thickness of at least 0.75 mm were invited as cases. The case series was supplemented by 123 melanoma cases with a family history of melanoma (at most two affected relatives) who were known to be negative for a CDKN2A mutation. CDKN2A is the most common gene mutated in the germline of multicase melanoma families; such mutations are infrequent in 3 case families in the UK being found in an estimated 21% of families (data not shown).
Controls were ascertained by contacting general practitioners to identify eligible individuals. These controls were frequency matched with cases for age and sex from general practitioners who had also had cases as part of their patient register. Overall there was a 55% response rate among controls (496 subjects). Additional controls were supplemented by a population-based group of 574 women who following informed consent agreed to participate in a study involving recording their history of sun exposure and sun bathing including sun bed usage and for whom various measures of skin aging were recorded. DNA samples were also provided.
All participating individuals gave written informed consent and regional ethical committee approval was obtained.
The first 903 cases and all the controls were asked about UV exposure and other aspects of lifestyle and provided detailed information on the history of residency. A trained nurse interviewed all cases and controls and formed a standardised examination for skin nevi. Nevi were examined by body sector; nevi greater than 2 mm in diameter were counted.
Genotyping
The TwinsUk sample has been genotyped using the Illumina HumanHap 300k duo chip, and population substructure has been detected and removed as described previously [25]. The SNPs rs751173, rs4636294, rs2218220, rs1335510, rs1341866, rs10757257, rs7023329, and rs10811629 for MTAP and rs2284063, rs6001027, rs132985, and rs738322 for PLA2G6 were genotyped both in the Australian BTNS and Q-MEGA samples in multiplex assays designed using the Sequenom MassARRAY Assay Design software (version 3.0). SNPs were typed using Sequenom iPLEX™ chemistry on a MALDI-TOF Compact Mass Spectrometer (Sequenom Inc, San Diego, CA, USA). The 2.5μL PCR reactions were performed in standard 384-well plates using 12.5 ng genomic DNA, 0.8 unit of Taq polymerase (HotStarTaq, Qiagen, Valencia, CA), 500 μmol of each dNTP, 1.625mM of MgCl2, and 100 nmol of each PCRprimers (Bioneer, Korea). Standard PCR thermal cycling conditions and post-PCR extension reactions were carried out as described previously [26]. The iPLEX reaction products were desalted by diluting samples with 15μl of water and adding 3μl of resin. The products were spotted on a SpectroChip (Sequenom Inc, San Diego, CA, USA), and data were processed and analysed by MassARRAY TYPER 3.4 software (Sequenom Inc, San Diego, CA, USA). None of SNPs exhibited Hardy-Weinberg disequilibrium, and there were no effects of ethnicity in both the control and case groups.
For the Leeds sample, genotyping data from the Illumina HumanHap300 v2 array were available for the 123 familial cases and for 148 cases and 167 controls (Leeds1 sample). The SNPs rs4636294, rs2218220, and rs7023329 for MTAP and rs2284063 and rs6001027 for PLA2G6 were genotyped in further 1,126 cases and 574 controls from the Leeds case-control study by Taqman with overall call rate greater then 97%. The Leeds1 sample plus the additional genotypes were part of the Leeds2 sample. None of SNPs exhibited deviation from Hardy-Weinberg equilibrium. Participants in the study were all of UK ancestry and principal component analysis (PCA) involving a subset of the samples included in this analysis found no evidence of population stratification. Both Leeds1 and Leeds2 case-control sample were supplemented with genotyping information from the Wellcome Trust Case-Control Consortium (WTCCC) 1958 birth cohort control samples analysed on the Illumina 550k array. While data on 1,447 controls are provided by the WTCCC, these controls were reduced to 1,395 because of low call rate (call rate < 97%, n = 51) and for apparent non-European ancestry on the basis of PCA (n=1).
Statistical analyses
Power analysis for the TwinsUK discovery sample was performed using the Genetic Power Calculator. Assuming that the tested SNP is a good proxy for an untyped functional variant we have 70% to 90% power of identifying a QTN responsible for 1% to 2% of the total genetic variance showing a P value required for a significant result after Bonferroni correction (P = 0.05/297,108 = 1.68 × 10⁻⁷). The GWA was performed in the TwinsUK sample using a rapid variance component association test implemented in MERLIN software version 1.1.2 [27] on the natural log transformed nevus counts and including age in the model. The method estimates the additive effect of each SNP by fitting a simple regression model to the trait while using a variance component approach to model the correlation between different observed phenotypes within pairs. A quantile-quantile (Q-Q) plot was generated using R and visually inspected to detect strong inflation of the test statistics. The genomic inflation factor was calculated as the ratio of the median of the empirically observed distribution of the test statistic to the expected median to quantify the excess false positive rate [28] and was found to be 1.006, close to its expected value of 1.0. Simulation analysis by gene dropping was carried out with MERLIN in the TwinsUK sample to assess the empirical P values for the most significant SNPs on chromosome 9 (rs10757257) and 22 (rs132985). By using 1 × 10⁻⁶ simulations we observed a single P value of the same magnitude as what observed using the real data for rs10757257 (empirical P value 2 × 10⁻⁶), and none for rs132985 (empirical P value 1 × 10⁻⁶). Replication in the BTNS has been carried out using MENDEL [29], following cube-root transformation of the counts, and including age, age2, year studied, body surface area, estimated cumulative UV exposure, ancestry, hair and skin colour as covariates.
For the Australian data cube-root transformation was significantly better than log transformation based on the Box-Cox analysis, and it closely matched the results of a negative binomial generalized linear mixed model analyses of the BTNS data, which also improved significantly in terms of model fit diagnostics.
Empirical P values were evaluated through straight regression of log(nevus count) versus allele count using MENDEL for gene dropping of the most significant SNPs on chromosomes 9 and 22. By using 1 × 10⁻⁶ iterations we obtained empirical P values of 1 × 10⁻⁶ for rs4636294 and 3.6 × 10⁻³ for rs2284063.
Combined P values from the BTNS and the TwinsUK studies were obtained using METAL. A z statistic is calculated for each marker using the P value and direction of the effect observed in each study. The combined P value is evaluated from the overall z statistic weighting each study proportionally to the square root of the number of subjects. The graphs on Figure 2 were generated by adapting a freely available R script [30].
Given that some cases and all the controls have some relatives in the analysis, the case-control analysis in the Q-MEGA sample was carried out using MENDEL penetrance analysis option, and also the Sib-pair program. The latter was used to calculate simulation-based P values allowing for residual familial resemblance. We selected cases and controls where all four grandparents were reported to be of Northern European ancestry and we also performed quantitative trait TDT analysis of nevus count, confirming that the observed associations were not due to population stratification. For the Leeds analysis, case-control comparisons by SNP for melanoma were made by unconditional logistic regression. Analyses including nevus count involved age and sex adjusted nevus count. Tests of nevus count by SNP genotype were based on a test of linear trend of age and sex adjusted nevus count.
Meta-analysis for the melanoma case control association results was performed using the rmeta package of R. To refine the location of chromosomes 9 and 22 association signals and help the identification of some causal variants we imputed genotypes from the HapMap in the TwinsUK sample, as described previously [31]. An additional 665 and 309 SNPs in the 9p21 and 22q13 regions respectively were tested for association with nevus count.
Supplementary Material
Acknowledgments
The KCL authors acknowledge financial support from the Wellcome Trust, the Department of Health via the National Institute for Health Research (NIHR) comprehensive Biomedical Research Centre award to Guy's & St Thomas' NHS Foundation Trust in partnership with King's College London, EC Framework 7 Health-2007-A ENGAGE project and the Chronic Disease Research Foundation (CDRF). TDS is an NIHR senior investigator. We would also like to thank all the nurses and Research assistants who collected the skin data, including Ursula Perks, Gail Clement, Dan Glass, Emad Qweitin as well as the volunteer twins who gave their time.
The Leeds case-control study and genotyping was supported by Cancer Research UK Programme Award (C588/A4994), NIH (R01 CA83115) and EU FP6 to GenoMEL (LSHC-CT-2006-018702). This study makes use of data generated by the Wellcome Trust Case Control Consortium. A full list of the investigators who contributed to the generation of the data is available from www.wtccc.org.uk. Funding for the project was provided by the Wellcome Trust under award 076113. The Leeds second control series were recruited through an award from the Department of Health in conjunction with Dr Isabel dos Santos Silva and Prof Anthony Swerdlow. We would like to thank John Taylor for statistical analyses relating to the Leeds dataset.
TP holds a Canada Research Chair and is supported by Genome Canada/Quebec and CIHR.
The Australian Studies were supported by the National Institutes of Health/National Cancer Institute (CA88363), the National Health and Medical Research Council of Australia (NHMRC) and the Cancer Council Queensland. DLD, GWM and NKH are supported by the NHMRC Fellowships scheme. We thank David Whiteman, Adele Green, Joanne Aitken, Anjali Henders, Megan Campbell, Mitchell Stark, Amanda Baxter, Monica de Nooyer, Isabel Gardner, Dixie Statham, Barbara Haddon, Jane Palmer, Lisa Bardsley, David Smyth, and Harry Beeby for their input into project management, sample processing, database and questionnaire development. We are grateful to all the participants of the BTNS and Q-MEGA as well as the research interviewers and examiners for these studies.
Footnotes
Author Contributions: M.F., T.D.S., N.G.M., D.T.B., N.K.H. designed the study.
M.F., D.D.L., J.H.B., A.C. analysed the data.
B.V, N.G.M., J.A.N.B. contributed to data collection and phenotype definitions.
T.D.S., E.D., P.D., D.E., N.G.M., N.K.H., J.A.N.B. obtained funding.
Z.Z., P.D., N.S., G.W.M. contributed to genotyping.
M.F., V.B., T.D.S. wrote the first draft of the paper and all authors made important contributions to the final version of the paper.
COMPETING INTERESTS STATEMENT: The authors declare no competing financial interests.
URL Genetic Power Calculator: http://pngu.mgh.harvard.edu/∼purcell/gpc/
METAL: http://www.sph.umich.edu/csg/abecasis/metal/
GenoMEL: http://www.genomel.org/
References
- 1.Karim-Kos HE, et al. Recent trends of cancer in Europe: a combined approach of incidence, survival and mortality for 17 cancer sites since the 1990s. Eur J Cancer. 2008;44:1345–89. doi: 10.1016/j.ejca.2007.12.015. [DOI] [PubMed] [Google Scholar]
- 2.Goldstein AM, et al. Features associated with germline CDKN2A mutations: a GenoMEL study of melanoma-prone families from three continents. J Med Genet. 2007;44:99–106. doi: 10.1136/jmg.2006.043802. [DOI] [PMC free article] [PubMed] [Google Scholar]
- 3.Palmieri G, et al. Definition of the role of chromosome 9p21 in sporadic melanoma through genetic analysis of primary tumours and their metastases. The Melanoma Cooperative Group. Br J Cancer. 2000;83:1707–14. doi: 10.1054/bjoc.2000.1513. [DOI] [PMC free article] [PubMed] [Google Scholar]
- 4.Gandini S, et al. Meta-analysis of risk factors for cutaneous melanoma: I. Common and atypical naevi. Eur J Cancer. 2005;41:28–44. doi: 10.1016/j.ejca.2004.10.015. [DOI] [PubMed] [Google Scholar]
- 5.Fountain JW, Bale SJ, Housman DE, Dracopoli NC. Genetics of melanoma. Cancer Surv. 1990;9:645–71. [PubMed] [Google Scholar]
- 6.Falchi M, Spector TD, Perks U, Kato BS, Bataille V. Genome-wide search for nevus density shows linkage to two melanoma loci on chromosome 9 and identifies a new QTL on 5q31 in an adult twin cohort. Hum Mol Genet. 2006;15:2975–9. doi: 10.1093/hmg/ddl227. [DOI] [PubMed] [Google Scholar]
- 7.Zhu G, et al. A genome-wide scan for naevus count: linkage to CDKN2A and to other chromosome regions. Eur J Hum Genet. 2007;15:94–102. doi: 10.1038/sj.ejhg.5201729. [DOI] [PubMed] [Google Scholar]
- 8.Ma Z, Wang X, Nowatzke W, Ramanadham S, Turk J. Human pancreatic islets express mRNA species encoding two distinct catalytically active isoforms of group VI phospholipase A2 (iPLA2) that arise from an exon-skipping mechanism of alternative splicing of the transcript from the iPLA2 gene on chromosome 22q13.1. J Biol Chem. 1999;274:9607–16. doi: 10.1074/jbc.274.14.9607. [DOI] [PMC free article] [PubMed] [Google Scholar]
- 9.Garcia-Castellano JM, et al. Methylthioadenosine phosphorylase gene deletions are common in osteosarcoma. Clin Cancer Res. 2002;8:782–7. [PubMed] [Google Scholar]
- 10.Hori Y, et al. The methylthioadenosine phosphorylase gene is frequently co-deleted with the p16INK4a gene in acute type adult T-cell leukemia. Int J Cancer. 1998;75:51–6. doi: 10.1002/(sici)1097-0215(19980105)75:1<51::aid-ijc9>3.0.co;2-0. [DOI] [PubMed] [Google Scholar]
- 11.Christopher SA, Diegelman P, Porter CW, Kruger WD. Methylthioadenosine phosphorylase, a gene frequently codeleted with p16(cdkN2a/ARF), acts as a tumor suppressor in a breast cancer cell line. Cancer Res. 2002;62:6639–44. [PubMed] [Google Scholar]
- 12.Behrmann I, et al. Characterization of methylthioadenosin phosphorylase (MTAP) expression in malignant melanoma. Am J Pathol. 2003;163:683–90. doi: 10.1016/S0002-9440(10)63695-4. [DOI] [PMC free article] [PubMed] [Google Scholar]
- 13.Pasmant E, et al. Characterization of a germ-line deletion, including the entire INK4/ARF locus, in a melanoma-neural system tumor family: identification of ANRIL, an antisense noncoding RNA whose expression coclusters with ARF. Cancer Res. 2007;67:3963–9. doi: 10.1158/0008-5472.CAN-06-2004. [DOI] [PubMed] [Google Scholar]
- 14.Easton DF, Eeles RA. Genome-wide association studies in cancer. Hum Mol Genet. 2008;17:R109–15. doi: 10.1093/hmg/ddn287. [DOI] [PubMed] [Google Scholar]
- 15.Hooks SB, Cummings BS. Role of Ca2+-independent phospholipase A2 in cell growth and signaling. Biochem Pharmacol. 2008;76:1059–67. doi: 10.1016/j.bcp.2008.07.044. [DOI] [PMC free article] [PubMed] [Google Scholar]
- 16.Atsumi G, et al. Fas-induced arachidonic acid release is mediated by Ca2+-independent phospholipase A2 but not cytosolic phospholipase A2, which undergoes proteolytic inactivation. J Biol Chem. 1998;273:13870–7. doi: 10.1074/jbc.273.22.13870. [DOI] [PubMed] [Google Scholar]
- 17.Bao S, et al. Effects of stable suppression of Group VIA phospholipase A2 expression on phospholipid content and composition, insulin secretion, and proliferation of INS-1 insulinoma cells. J Biol Chem. 2006;281:187–98. doi: 10.1074/jbc.M509105200. [DOI] [PMC free article] [PubMed] [Google Scholar]
- 18.Song Y, et al. Inhibition of calcium-independent phospholipase A2 suppresses proliferation and tumorigenicity of ovarian carcinoma cells. Biochem J. 2007;406:427–36. doi: 10.1042/BJ20070631. [DOI] [PMC free article] [PubMed] [Google Scholar]
- 19.Sun B, Zhang X, Talathi S, Cummings BS. Inhibition of Ca2+-independent phospholipase A2 decreases prostate cancer cell growth by p53-dependent and independent mechanisms. J Pharmacol Exp Ther. 2008;326:59–68. doi: 10.1124/jpet.108.138958. [DOI] [PubMed] [Google Scholar]
- 20.Hosgood HD, 3rd, et al. Pathway-based evaluation of 380 candidate genes and lung cancer susceptibility suggests the importance of the cell cycle pathway. Carcinogenesis. 2008;29:1938–43. doi: 10.1093/carcin/bgn178. [DOI] [PMC free article] [PubMed] [Google Scholar]
- 21.Bishop TD, et al. Genome-wide association study identifies three loci associated with melanoma risk. doi: 10.1038/ng.411. (Submitteds) [DOI] [PMC free article] [PubMed] [Google Scholar]
- 22.Bataille V, Snieder H, MacGregor AJ, Sasieni P, Spector TD. Genetics of risk factors for melanoma: an adult twin study of nevi and freckles. J Natl Cancer Inst. 2000;92:457–63. doi: 10.1093/jnci/92.6.457. [DOI] [PubMed] [Google Scholar]
- 23.Sturm RA, et al. A single SNP in an evolutionary conserved region within intron 86 of the HERC2 gene determines human blue-brown eye color. Am J Hum Genet. 2008;82:424–31. doi: 10.1016/j.ajhg.2007.11.005. [DOI] [PMC free article] [PubMed] [Google Scholar]
- 24.Baxter AJ, et al. The Queensland Study of Melanoma: environmental and genetic associations (Q-MEGA); study design, baseline characteristics, and repeatability of phenotype and sun exposure measures. Twin Res Hum Genet. 2008;11:183–96. doi: 10.1375/twin.11.2.183. [DOI] [PMC free article] [PubMed] [Google Scholar]
- 25.Richards JB, et al. Bone mineral density, osteoporosis, and osteoporotic fractures: a genome-wide association study. Lancet. 2008;371:1505–12. doi: 10.1016/S0140-6736(08)60599-1. [DOI] [PMC free article] [PubMed] [Google Scholar]
- 26.Zhao ZZ, et al. Genetic variation in tumour necrosis factor and lymphotoxin is not associated with endometriosis in an Australian sample. Hum Reprod. 2007;22:2389–97. doi: 10.1093/humrep/dem182. [DOI] [PubMed] [Google Scholar]
- 27.Chen WM, Abecasis GR. Family-based association tests for genomewide association scans. Am J Hum Genet. 2007;81:913–26. doi: 10.1086/521580. [DOI] [PMC free article] [PubMed] [Google Scholar]
- 28.Devlin B, Roeder K, Wasserman L. Genomic control, a new approach to genetic-based association studies. Theor Popul Biol. 2001;60:155–66. doi: 10.1006/tpbi.2001.1542. [DOI] [PubMed] [Google Scholar]
- 29.Lange K, Weeks D, Boehnke M. Programs for Pedigree Analysis: MENDEL, FISHER, and dGENE. Genet Epidemiol. 1988;5:471–2. doi: 10.1002/gepi.1370050611. [DOI] [PubMed] [Google Scholar]
- 30.Saxena R, et al. Genome-wide association analysis identifies loci for type 2 diabetes and triglyceride levels. Science. 2007;316:1331–1336. doi: 10.1126/science.1142358. [DOI] [PubMed] [Google Scholar]
- 31.Prokopenko I, et al. Variants in MTNR1B influence fasting glucose levels. Nat Genet. 2009;41:77–81. doi: 10.1038/ng.290. [DOI] [PMC free article] [PubMed] [Google Scholar]
Associated Data
This section collects any data citations, data availability statements, or supplementary materials included in this article.