Abstract
In this paper, a new model of self-organized criticality is introduced. This model, called the gene expression paradigm, is motivated by the problem of gene expression initiation in the newly-born daughter cells after mitosis. The model is fundamentally different in dynamics and properties from the well known sand-pile paradigm. Simulation experiments demonstrate that a critical total number of proteins exists below which transcription is impossible. Above this critical threshold, the system enters the regime of self-sustained oscillations with standard deviations and periods proportional to the genes’ complexities with probability one. The borderline between these two regimes is very sharp. Importantly, such a self-organization emerges without any deterministic feedback loops or external supervision, and is a result of completely random redistribution of proteins between inactive genes. Given the size of the genome, the domain of self-organized oscillatory motion is also limited by the genes’ maximal complexities. Below the critical complexity, all the regimes of self-organized oscillations are self-similar and largely independent of the genes’ complexities. Above the level of critical complexity, the whole-genome transcription is impossible. Again, the borderline between the domains of oscillations and quiescence is very sharp. The gene expression paradigm is an example of cellular automata with the domain of application potentially far beyond its biological context. The model seems to be simple enough for staging an experiment for verification of its remarkable properties.
Keywords: self-organized criticality, transcription initiation, genetic regulatory systems, stochastic oscillations
1. Introduction
Immediately after cell division, the DNA molecules in daughter cells are largely “naked”, that is, they lack the regulatory elements which are necessary for launching the gene expression machinery. As in the classical problem of the chicken and the egg, genes are waiting for transcription factors to initiate transcription, but the gene expression machinery should be launched first in order to produce them. Figuratively speaking, after the major disruption caused by mitosis, the cell is in the state of turmoil and uncertainty regarding initiation of gene expression. No deterministic process to trigger gene expression in the newly-born daughter cells is yet known. In1 we have briefly discussed a conceivable scenario of gene expression initiation. Due to random partitioning of mRNAs during mitosis,2,3 it is possible that at least some of them are inherited in quantities sufficient for starting the translation of some proteins. Selective growth of protein concentrations, in turn, increases the probability that some genes receive an adequate collection of transcription factors (TFs) for producing the first burst of mRNA. This first burst triggers a positive feedback loop and initiates an avalanche of transcription events randomly propagating throughout the entire genome. Qualitatively, this process resembles the avalanches considered in the theory of self-organized criticality. 4 However, without deeper conceptual modeling, it is difficult to envision whether or not some kind of asymptotic regime may be reached in this process, how this asymptotic regime will be structured, and what are the major systemic parameters governing the process.
In this work, we propose a simple model which is intended to elucidate these issues. Despite its simplicity, the properties of the model are rather remarkable. Conceptually, this is a paradigm model. This means that the model is not intended to describe the process of gene expression initiation in its entirety and with much realistic biological detail; instead, it directs attention to some of its fundamental facets. Within this paper, we will refer to this model as the gene expression paradigm. By invoking such terminology, we draw a parallel with the celebrated sand-pile paradigm in the theory of self-organized criticality. As is well known, the sand-pile paradigm reflects the most fundamental properties of sand-piles without incorporating much realistic detail. This is because the physical properties of sand grains and the specifics of their interaction are too numerous to be included into a grossly simplified model. One true value of this paradigm is that it introduces the notion of criticality as a new type of dynamic stability and provides deep insight into the origins of scaling laws known in many domains of science.5,6 In this capacity of a paradigm (that is, a framework of thinking about certain class of phenomena), this model has important applications far beyond the sand-pile dynamics.7 In its logical and mathematical essence, the sand-pile model is a cellular automaton with very simple rules of updating. Despite this simplicity, the model is very rich in properties, its behavior is very complex, and it would be hardly possible to describe such behavior by other mathematical tools in equivalently parsimonious manner. Likewise, the gene expression paradigm is in essence a cellular automaton with simple rules of updating which elucidates some core issues in gene expression dynamics. Similar to the sand-pile paradigm, there is also a hope that, due to its logical simplicity and mathematical generality, the gene expression paradigm may be applied to many problems far beyond the initial biological context.
2. Gene Expression Paradigm
Let us imagine a set of sites, which we will call genes, g1:N, organized as a one-dimensional string called a genome. In gene expression paradigm, we make no attempts to depict our genes with any sort of biological realism; essentially, they are stripped of all real-life properties except just one: in order to be transcribed, each gene requires a certain number of transcription factors. We do not explicitly include translation stage into our model. Instead, we simply assume that there exist a one-to-one correspondence between the transcriptions and translations, that is, each act of transcription leads to the birth of one protein capable to serve as transcription factor. In our model, the gene-specific numbers of transcription factors which are required to spark transcription, t1:N, are considered to be variable (which includes, of course, the particular cases of very low or zero variations). Suppose that initially there is a certain supply of proteins distributed randomly and with equal probabilities between the genes’ regulatory sites. If the total number of genes is N, and the total number of protein molecules available in the system is L, then the joint probability distribution of individual gene-specific numbers of proteins, Li, i = 1: N is multinomial
| (1) |
Due to random variations of {Li}, each with variance L (N−1)/N2, it may happen that there are some genes (say, gi1, ..., gik) which are fully equipped with all the necessary transcription factors to initiate the transcription. In the gene expression paradigm, we consider these particular genes as being ready for launching the transcription process; that is, the mRNA production followed by the synthesis of new proteins. Upon transcription, the TFs that participate in this process abandon corresponding regulatory sites and go for redistribution among all other genes. This concludes the first step in the genome dynamics. This process is updated iteratively until some kind of asymptotic regime is reached. In principle, three scenarios are conceivable. In the first scenario, the total initial number of proteins available in the system, L, is too small to cause even one transcription. In this case the genome will reside in its initial state of quiescence forever. In the second scenario, L is sufficiently high to initiate a certain number of transcriptions, but after several cycles, the number of active genes begins to dwindle and eventually comes to zero. This occurs if all of the available proteins end up with a distribution below all the individual thresholds; hence, none of the genes may be able to function. In the third and the most interesting scenario, after a period of fairly chaotic fluctuations, the system enters a long period of stable whole-genome oscillations. The bulk of this paper will be devoted to demonstrating existence and studying the properties of this asymptotic regime. We believe that behavior of the system is well qualified to serve as an example of self-organizing criticality. The element of self-organization is seen from the fact that, despite the completely stochastic nature of redistribution of proteins between the genes and despite the absence of any deterministic feedback loops, the asymptotic regime features strong periodicity with sustained individual periods of oscillations. The element of criticality is seen from the fact that there is a bifurcation parameter, L, in the system. If this parameter is too low, the genome will remain quiescent. If this parameter is sufficiently high, the whole-genome oscillatory regime will be reached with the probability one. As it will be shown in subsequent sections, the transition from the regime of quiescence to the regime of sustained oscillations is very sharp. It should be noted also that the type of self-organized criticality embodied in the gene expression paradigm is not reduced to the popular sand-pile or forest-fire paradigms. At this point, to the best of the author’s knowledge, the gene expression paradigm introduced in this paper is a new model for studying self-organized criticality in systems of very large dimensions.
3. Some Technicalities
The majority of computations presented below have been performed with the size of genome N = 1000, unless stated otherwise. For brevity, the gene-specific numbers of TFs which are necessary for sparking transcription, t1:N, are called thresholds. These numbers have been generated probabilistically as a part of set up prior to launching the simulation. Specifically, they have been generated in accordance with the gamma distribution (and rounded to integers), in which shape, r, and rate, θ−1,8 have been selected in such a way as to fix the pre-specified genome-wide average threshold, t̄ = r/θ. Since the variance of the gamma distribution is r/θ2 = (t̄)2/r, the asymptotic limit r → ∞ (with fixed t̄) provides the transition to constant thresholds. In the opposite case of small r, the procedure generates skewed distributions with high variability of gene-specific thresholds. Note that selection of the gamma distribution has been motivated only by considerations of technical convenience and bears no further meaning. All the results will be valid with any other reasonable probabilistic parameterization of the thresholds. The parameter t̄ serves as a characteristic of the average complexity of the genes: the greater is t̄, the more TFs are required, on average, to spark the transcription. The dimensionless critical parameter controlling the dynamics of the system is λ = L/Nt̄. Its meaning is the ratio of the total number of proteins available in the system to the total capacity of all the regulatory sites. We will refer to this parameter as the degree of completeness.
4. Regime of Self-Sustained Oscillations
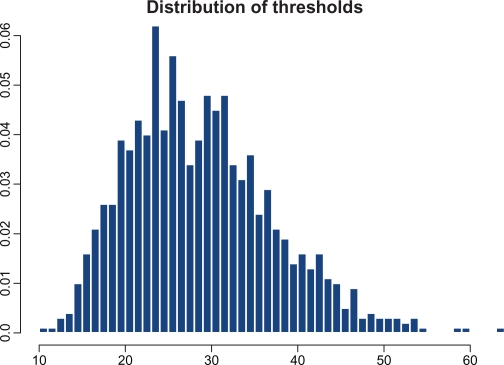
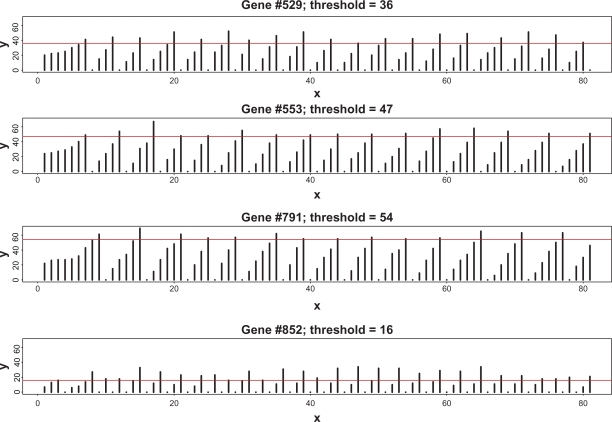
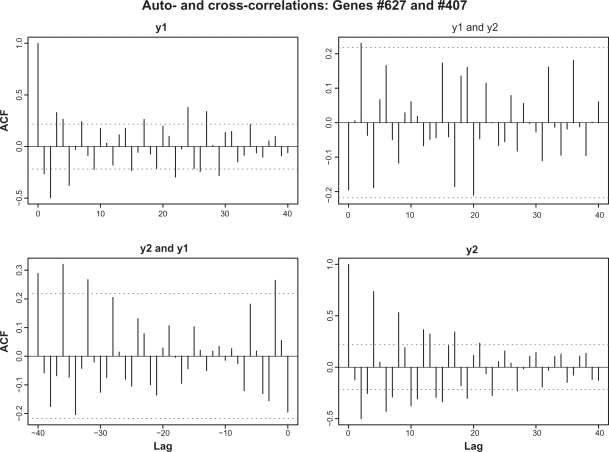
We first consider a typical case when the average complexity, t̄ = 30, and the coefficient of variation of the thresholds, . Figure 1 shows the sample distribution of thresholds corresponding to this choice. It is worth noting that the majority of the thresholds lie between 10 and 50 with a negligible number of thresholds too close to zero. In this computation, the degree of completeness is set to λ = 0.6. This means that from the total Nt̄ = 30,000 TFs which are required for completely filling all the regulatory sites, only 18,000 are actually available. This lack of proteins makes it impossible for all the genes to transcribe simultaneously. Figure 2 depicts the temporal evolution of gene-specific levels of TFs (hereafter, we will call these numbers loads). For the purpose of this demonstration, four genes have been selected at random from the totality of 1000 genes. As stated above, initial loads are distributed multinomially; hence, due to random fluctuations of initial loads and presence of the genes with comparatively low thresholds, a certain number of genes may be fully equipped for transcription from the very beginning. Subsequent behavior of the loads has a number of notable features. After a certain initial period when the proteins randomly travel from one site to another, some additional loads sooner or later reach the threshold level, thus producing transcriptions of the corresponding genes. After that, according to the rules of the gene expression paradigm, these regulatory sites are emptied, all the TFs are released for random repossession between all other genes, and the process begins anew. The most surprising result is that, despite purely random redistribution of newly available proteins between the non-empty regulatory sites, strict periodicity emerges for all the genes, each with its own autocorrelation structure. Generally, the oscillatory motions of different genes are not mutually correlated. Figure 3 shows examples of auto-and cross-correlation structure for a pair of genes selected at random. As seen from this graph, the autocorrelation structures of the genes are markedly different. In order to assign a global measure of cross-correlations to the entire set of 1000 individual time-series, we have computed the average of absolute values of non-diagonal correlations; in this case it was found to be 0.23.
Figure 1.
Sample distribution of the gene-specific thresholds (ie, numbers of TFs required for transcription initiation) for t̄ = 30 and r = 0.3.
Figure 2.
Examples of temporal dynamics of gene-specific transcription factors for four genes selected at random from the genome of size 1000.
Figure 3.
Auto- and cross-correlations for two genes selected at random. Individual autocorrelations are markedly different. Cross-correlations are small.
It is easy to envision from Figure 2 a connection between the periods of oscillations and thresholds of corresponding genes: for those genes with larger thresholds, the number of cycles necessary to reach the transcription status are greater; hence, their periods are longer. In order to quantify this dependence, we have parameterized the autocorrelation structures of individual time series using autoregressive stochastic sequences. Namely, the time series of loads, xi (t), for the gene i, were presented as
| (2) |
where are autoregressive coefficients, εi(t) are the Gaussian renovations, and f is the order of autoregressive processes.9 It is of particular convenience to use the third order process (AR3) which combines simplicity of interpretation with flexibility in representation of a wide variety of autocorrelation structures. For an AR3 process, the autocorrelation function, ρ(τ), takes the general form
| (3) |
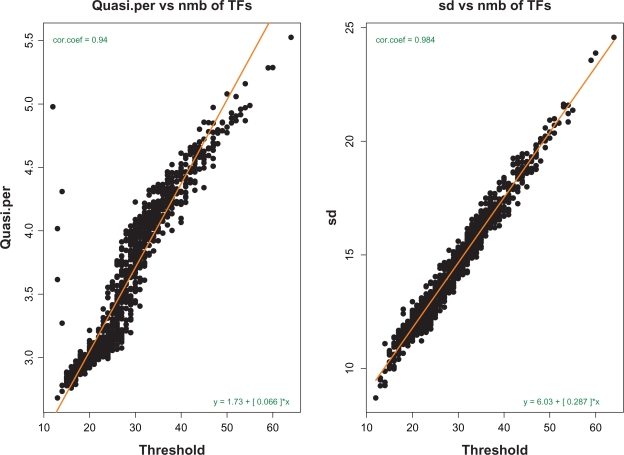
where tp is the characteristic time of pure attenuation, tq is the time of attenuation of oscillations, and t0 is the quasi-period. (For reference purposes, explicit expressions for A, B and ψ are given in Appendix A.) Each load has been represented as an AR3 series, and the parameters tp, tq, t0 have been estimated from simulated data. Figure 4, left panel, reveals an almost linear dependence between the periods of oscillations, t0, and the thresholds of corresponding genes. In other words, more complex genes oscillate slower. The right panel of Figure 4 shows an obvious linear relationship between standard deviations of fluctuations and the thresholds: loads of more complex genes fluctuate with greater amplitude.
Figure 4.
Left panel: dependence of quasi-periods of oscillations on the genes’ complexities (thresholds). Right panel: the same for standard deviations of fluctuations. This picture shows that the genes with greater complexities oscillate slower and with greater amplitude.
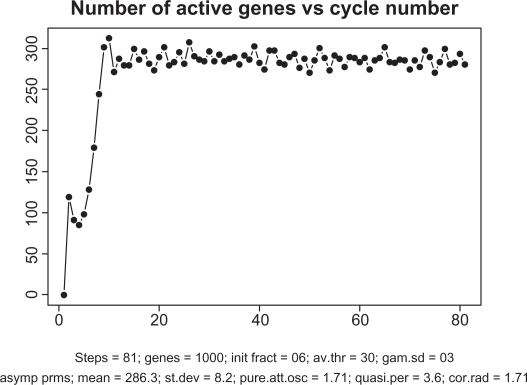
Figure 5 depicts the overall dynamics of the system in terms of the number of simultaneously active genes. As seen from this picture, after a relatively rapid “take-off” consisting of about 15 cycles, the system enters a self-organized mode with an almost constant level of activity with ∼300 genes (out of 1000) transcribing simultaneously. Note that about 9000 TFs are engaged in this activity which is a half of all the TFs available in the system. While these 300 genes are in the transcription mode, the remaining 700 genes are busy redistributing the remaining 9000 proteins among one another.
Figure 5.
Time course of transcription dynamics. Note: in asymptotic regime, the total number of simultaneously active genes fluctuate with quasi-period 3.6.
6. Criticality
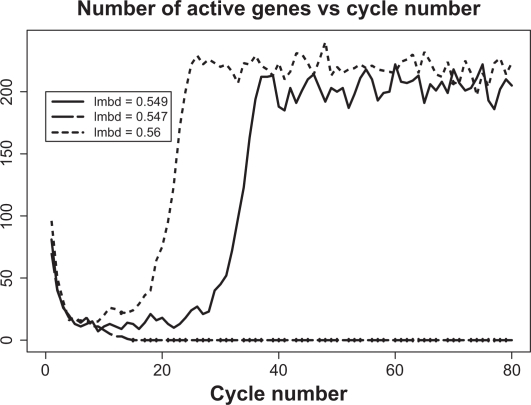
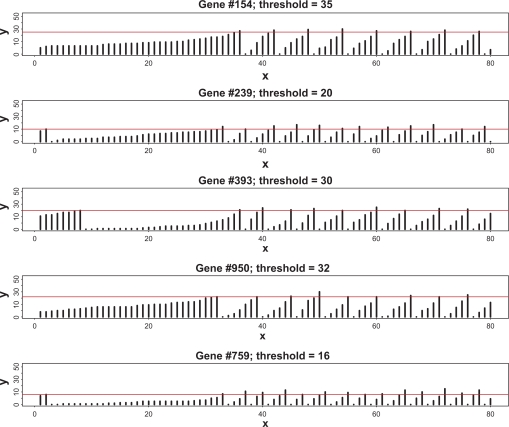
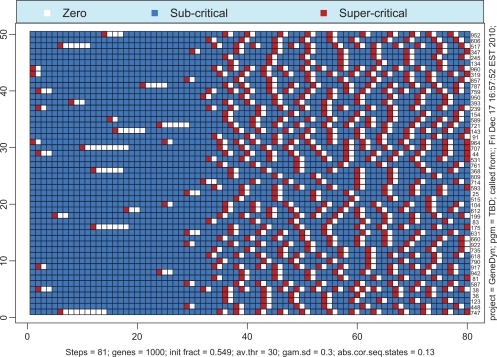
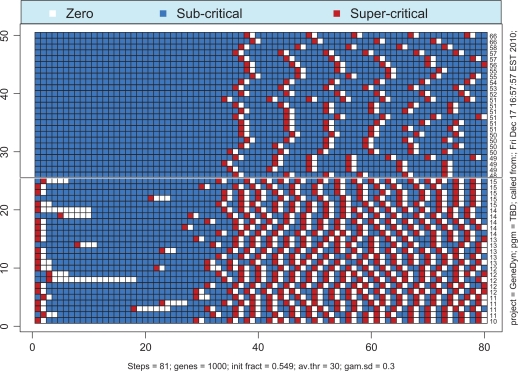
If the total number of proteins available in the system is not sufficiently large then the probability of simultaneous transcription initiation by a large number of genes may be too small to launch the whole-genome gene expression. Remarkably, the borderline between the regime of whole-genome oscillatory motion and the regime of quiescence is very sharp, in the essence, critical. Figure 6 illustrates this premise. The solid line corresponds to the super-critical parameter, λ+ = 0.549, whereas the dashed line corresponds to the sub-critical parameter, λ– = 0.547. If one runs the simulation repeatedly for λ = λ+ then one would always end up with the whole-genome oscillatory transcription with identical asymptotic levels of activity. For the reference, we provide the time course of activity above the critical region, that is, for λ = 0.56 (dotted line). In contrast, if the simulation is run repeatedly with λ = λ–, then the asymptotic limit will always be complete quiescence. The critical value of λ lies somewhere in the interval [λ–, λ+], and our best estimate for it is λc = 0.5748. The behavior of the system with λ = λc may vary. In approximately half of all simulations, the dynamics of expression follows the path of λ = λ+ (with some variations during the transition period). In all other cases, the dynamics follows the path λ = λ–. No intermediate scenarios noticeably different from the two described above appear for λ = λc. The transition of gene-specific loads to their asymptotic limits is illustrated in Figures 7 and 8. As seen from Figure 7, the genes make a number of uncoordinated transcriptions prior to entering the mode of coherent self-sustained oscillations. The effect of spontaneous self-organization is vividly seen in Figure 8 in which the time courses of 50 randomly selected genes are shown as a heat map. It is worth noting that, although the asymptotic level of activity is maintained at an approximately constant level, the genes themselves perpetually change their status from the quiescent to the preparatory sub-critical stage and further to the super-critical transcription stage. This process may be characterized as random walk in the N-dimensional space of the genome’s states. The correlation between the sequential states is low. In order to demonstrate this fact we have computed the correlation matrix between the sequential N-vectors of state. Thus, in Figure 8, the average of absolute non-diagonal correlations is as low as 0.13.
Figure 6.
Example of criticality for the genome of size 1000 and average complexity 30. Critical value of degree of completeness, λ, is 0.5748.
Figure 7.
Time series of loads for five genes selected at random from 1000. Despite wide variations in behavior during the transition period, the regime of self-sustained oscillations emerges almost simultaneously for all genes.
Figure 8.
Heat map of time courses of 50 genes selected at random from 1000. Despite widely varying behaviors during the transition period, the regime of self-sustained oscillations emerges simultaneously for all the genes.
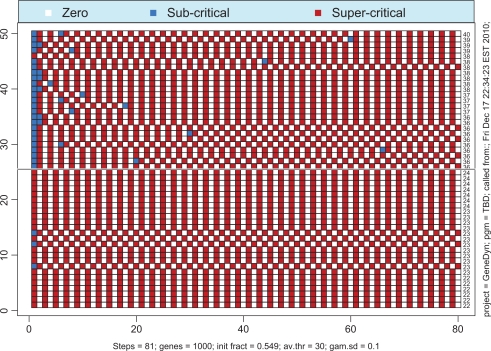
The heat map in Figure 9 provides a deeper insight into the dynamics of transition to the regime of self-sustained oscillation. In this picture, the bottom half depicts the timelines of loads for 25 genes with the smallest thresholds (ie, the simplest genes) while the top half depicts the timelines of loads for 25 genes with the largest thresholds (the most complex genes). As seen from this picture, the paths of these two groups of genes towards their corresponding asymptotic regimes are markedly different. However, these diametrically opposite groups of genes enter the regime of self-sustained oscillations almost simultaneously. This tells us that we are dealing here with the whole-genome self-synchronization phenomenon emerging without any external organizing forces or deterministically introduced feedback loops.
Figure 9.
Comparison of transitions to asymptotic oscillatory mode for the 25 simplest genes (minimal thresholds) with those for the most complex genes (maximal thresholds). The thresholds are given in ascending order on the left side of the graph with the smallest ones in the bottom. Transcription fires up from simple genes and propagates towards complex genes. The whole-genome oscillations emerge almost simultaneously.
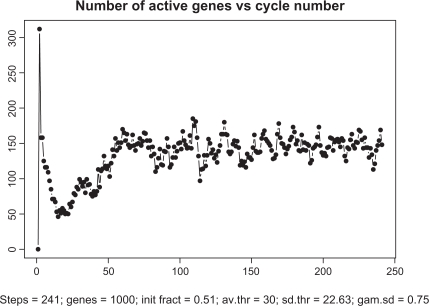
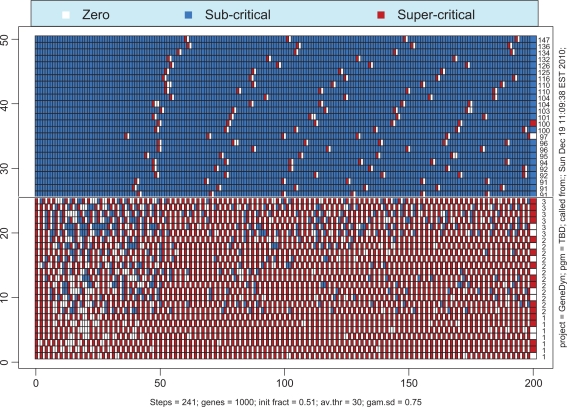
The position of the critical region, [λ–, λ+] on the scale of λ depends on the width of the distribution of the thresholds. When the variability of the thresholds increases, the borderline between the regimes of quiescence and oscillations moves down towards smaller values of λc. In a biological context this means that the greater the diversity of genes’ complexities, the easier it is to find some low-threshold genes which initiate the whole-genome self-organization. To illustrate this premise, we have simulated the case with λ = 0.53 and ζ = 0.75. This value of λ lies far below the critical value, λc, computed above for ζ = 0.3. As seen from Figures 10 and 11, the regime of self-sustained oscillations which was unachievable with ζ = 0.3 is now achievable with ζ = 0.75. In our estimates, critical value of λ for the latter case is ∼0.5. We were unable to obtain oscillatory solutions with λ < 0.5 no matter what other parameter values were selected. This means that if the degree of completeness is smaller than 0.5 then the genome-wide transcription initiation becomes impossible.
Figure 10.
Time course of transcriptional activity for wider distribution of the thresholds (coefficient of variation ζ = 0.75). Transition period is longer than for the case ζ = 0.3, but asymptotic oscillatory mode is achievable anyways.
Figure 11.
Heat maps of time courses for the 25 simplest (bottom half) and 25 of the most complex genes (top half) for the coefficient of variation ζ = 0.75.
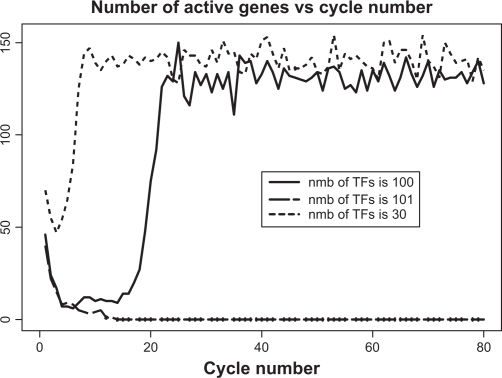
There exists another type of criticality in the gene expression paradigm. For a given genome size, there exists a certain maximal complexity of genes above which the transcription initiation becomes impossible. Similarly, the borderline between the full-fledged transcription and complete quiescence is amazingly thin. As an example, the solid line in Figure 12 depicts the time course of transcriptional activity when the genome size N = 500 and average threshold is t̄ = 100. It shows that under these conditions the whole-genome oscillation does exist and that the asymptotic level of activity is approximately the same as in the entire region of smaller thresholds (ie, for much simpler genes). As a reference, we provide the time course of activity for t̄ = 30 (dotted line). However, when the genes’ complexity is just one step above the critical value, ie, t̄ = 101, the gene expression excitation is no longer possible, periodic or otherwise (dashed line).
Figure 12.
Criticality in terms of maximal complexity of genes. Note that asymptotic behavior of genes with complexity 100 is almost identical to those with the much smaller complexity 30. However, just one step up to the complexity 101 makes transition to oscillatory mode impossible.
6. Stiff Excitation and Oscillations
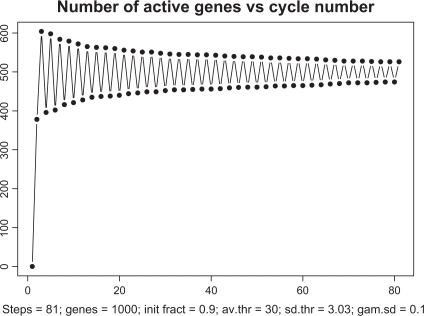
When λ is well above the critical value, and the variations in genes’ thresholds are small (say, ζ = 0.1), an interesting phenomenon of almost simultaneous excitation and highly synchronized oscillations occurs. As seen from Figure 13, for λ = 0.9 the whole-genome oscillatory regime is established almost immediately upon starting the process. This oscillatory mode features not only oscillations of loads of individual genes, but also the periodic oscillations of the total number of active genes. Another notable feature of this regime transpires in Figure 14. All the individual oscillations are tightly synchronized and have identical periods of oscillations, regardless of their individual complexities. During the onset of the oscillatory regime, the genes with the highest thresholds are just one step behind those with the smallest thresholds. Oscillations are synchronized not only between each other but also with the total number of active genes. In this oscillatory mode, a majority of all the periods reach their minimal possible value 2. One may refer to this regime as a regime of stiff oscillations. In this regime, the total number of proteins available in the system is so large that each gene is forced to reside in only one of two possible stages, that is, to be either overloaded or transcribed.
Figure 13.
Stiff oscillations for high degree of completeness 0.9 and narrow distribution of genes’ complexities (coefficient of variation 0.1).
Figure 14.
Regime of stiff oscillations. Oscillations throughout the entire genome are tightly synchronized in terms of lengths of transition periods. It takes just one cycle of simulation to trigger the oscillatory mode. Periods of all the individual oscillations are identical regardless of thresholds.
7. Gene Expression Initiation
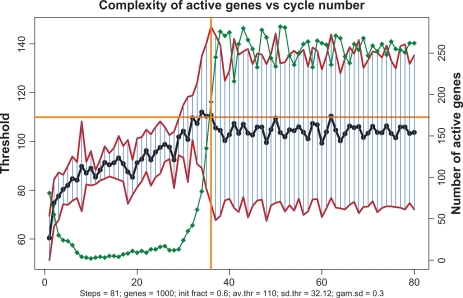
As mentioned in Introduction, in1 the author has made a conjecture that the whole-genome gene expression starts with those genes which require the smallest number of TFs, and propagates upward on the scale of complexity as an avalanche-like process. The simulations within the gene expression paradigm corroborate this premise. Figure 15 shows how the complexities of active genes change with time. First, the transcription follows a narrow path involving a small fraction of all the genes, and these genes are predominantly the ones of relatively low complexity. Complexity of the transcribing genes, as well as their total number, gradually increase. Upon reaching some critical state the number and complexity grows explosively, encompassing the entire genome.
Figure 15.
Transcription begins with the genes with lower thresholds, propagates upwards and finally entrains all the genes. Red lines show the corridor of standard deviations. Horizontal yellow line shows the prespecified average threshold. Green diamond curve shows the time course of numbers of actives genes. When these numbers reach their asymptotic limit (to the right of vertical yellow line) the entire genome gets involved in transcription.
Discussion
The gene expression paradigm that we have introduced in this paper emerged from our long-standing interest in the fundamentals of nonlinear dynamics of genetic regulatory networks.1,10–16 However, given the popularity and importance of the sand-pile paradigm in the science of self-organized criticality, it makes some sense to formulate the gene expression paradigm in terms of sand dynamics as well, thus emphasizing its simplicity and generality. Let us imagine a large number of sand pits and an equal number of children standing with shovels next to each of them. Suppose that each pit has a certain limiting capacity. The game goes as follows. When the content of a pit reaches its limiting capacity, the child responsible for it randomly shovels the sand from his pit to all other pits and does it until his pit is emptied. In this process, some other pits may become overloaded, and the corresponding child takes care about his pit in the same manner. A remarkable property of this game is that shortly after starting the process, the content of each pit enters the quasi-periodic mode, with the amplitudes and periods of oscillations being proportional to the pits’ limiting capacities. It is easy to notice the fundamental difference of this process with the sand-pile paradigm. In the latter, the excess of sand is randomly redistributed between the neighboring sites, thus causing an avalanche. In our model, the sand is randomly redistributed between all the sites, thus causing a somewhat opposite phenomenon of the self-organized oscillations. As often happens in the dynamics of cellular automata,17 this simple modification of the rules of updating leads to a completely different behavior.
In a sense, the model we have considered is one-dimensional. To wit, we have assumed that all the proteins are equivalent in their roles as TFs; hence, only their total quantity was of importance. Perhaps a more realistic approach would require reformulation of the entire problem in terms of very high-dimensional configuration space in which each TF plays a unique role and a certain assortment of them would be necessary to start a transcription. Such a move towards realism, albeit intriguing, would probably mean a death sentence to the model due to tremendous computational difficulties.
In natural sciences, simplified theoretical models of complex phenomena are often called toy models. This terminology explicitly highlights the fact that a toy model is not intended to serve as a comprehensive theory of the phenomenon; rather, it attempts to provide a description of its certain core elements. Obviously, it would be a fallacy to attack a toy model on the basis that it is unable to provide a realistic description of the phenomenon in its entirety. In biology, a contrast between the theoretical toy models and the functionality of complex biological entities is tremendous. In this sense, the theoretical considerations offered in this paper do not intend to provide a comprehensive framework for description of cellular dynamics in its entirety. It only focuses on one fundamental property of gene expression machinery, that is, on the possibility of self-organized self-sustained oscillations without any deterministic mechanism behind it. In the literature, there is no lack of experimental evidence and theoretical considerations regarding oscillations in gene expression. Thus, in the Atlas of Cellular Oscillations18 published as early as in 1979, more than 450 experimental sources were cited featuring various types of intracellular oscillations. Rhythms in gene expression have been discussed in much detail in more recent reviews.19,20 Numerous theoretical models have been developed to explain this class of phenomena.21,22 An attempt to demonstrate the possibility of whole-genome oscillations has been undertaken through introducing the model of artificial genome.23 Similar to the gene expression paradigm, the artificial genome may be also seen as a version of cellular automata but with much more complex rules of updating. The gene expression paradigm vividly demonstrates that behind all the intricacies of gene expression machinery there exist simple, general and inescapable rules that lead to the whole-genome self-sustained oscillations.
Summary
We have introduced a new model of self-organized criticality called the gene expression paradigm. We have shown that in this model a critical total number of proteins exist below which transcription is impossible. Above the critical threshold, the system enters the regime of self-sustained stochastic oscillations with standard deviations and periods proportional to the genes’ thresholds with probability one. Importantly, such a self-organization appears without any deterministic feedback loops or external supervision.
Given the size of the genome, the domain of self-organized oscillatory motion is also limited by the maximal genes’ complexities. Below the critical complexity, the regimes of self-organized oscillations are self-similar and largely independent of the genes’ complexities. Above the level of critical complexity, the whole-genome transcription is impossible. The borderline between the domains of oscillations and quiescence is very sharp.
The gene expression paradigm is an example of cellular automata with the domain of application potentially far beyond its biological context. The model seems to be simple enough for staging an experiment for verification of its remarkable properties.
Appendix A. AR3 parameterization of autocorrelations
For a general autoregressive process of order f
the autocorrelation structure may be presented as
where s1:f are the (complex) roots of the characteristic equation of autoregression and H1:f are the (complex) coefficients. Explicit expressions for H through the roots are
where
The roots s1:f may be found per solution of the difference equation with respect to x(t) and presenting the solution as
with  being a shift operator: Âε(t) = ε(t − 1). For the third order process, when one root, s1, is real and two roots, s2:3 = ρ exp(±iθ), are complex-conjugate
Footnotes
Disclosure
This manuscript has been read and approved by the author. This paper is unique and is not under consideration by any other publication and has not been published elsewhere. The author and peer reviewers of this paper report no conflicts of interest. The author confirms that he has permission to reproduce any copyrighted material.
References
- 1.Rosenfeld S. Stochastic cooperativity in non-linear dynamics of genetic regulatory networks. Math Biosci. 2007;210:121. doi: 10.1016/j.mbs.2007.05.006. [DOI] [PubMed] [Google Scholar]
- 2.McAdams HH, Arkin A. Stochastic mechanisms in gene expression. Proc Natl Acad Sci U S A. 1997;94:814. doi: 10.1073/pnas.94.3.814. [DOI] [PMC free article] [PubMed] [Google Scholar]
- 3.McAdams HH, Arkin A. It’s a noisy business! Genetic regulation at the nanomolar scale. Trends Genet. 1999;15:65. doi: 10.1016/s0168-9525(98)01659-x. [DOI] [PubMed] [Google Scholar]
- 4.Turcotte DL. Self-organized criticality. Rep Prog Phys. 1999;62:1377. [Google Scholar]
- 5.Bak P. How Nature Works The Science of Self-Organized Criticaliy. Springer Verlag; 1996. [Google Scholar]
- 6.Scott A. Encyclopedia of Nonlinear Science, Taylor & Francis Books; Abington, UK: 2005. [Google Scholar]
- 7.Turcotte DL, Rundle JB. Self-organized complexity in the physical, biological, and social sciences. Proc Natl Acad Sci U S A. 2002;99(Suppl 1):2463. doi: 10.1073/pnas.012579399. [DOI] [PMC free article] [PubMed] [Google Scholar]
- 8.Johnson NL, Kotz S, Balakrishnan N. Continuous Univariate Distributions. Wiley-Interscience; 1994. [Google Scholar]
- 9.Jenkins GM, Watts DG. Spectral Analysis and Its Applications. Holden Day; 1968. [Google Scholar]
- 10.Rosenfeld S. A nonlinear continuous stochastic model for genetic regulatory networks. Caveats for microarray data analysis. 2006:28–34. ALIFE-X. [Google Scholar]
- 11.Rosenfeld S. Stochastic Oscillations in Genetic Regulatory Networks. Applications to Microarray Experiment. In: Rizzi A, Vichi M, editors. Physica-Verlag. 2006. pp. 1609–18. COMPSTAT-2006. [DOI] [PMC free article] [PubMed] [Google Scholar]
- 12.Rosenfeld S. Stochastic Oscillations in Genetic Regulatory Networks, EURASIP. Journal of Bioinformatics and Systems Biology. 2006:1. doi: 10.1155/BSB/2006/59526. [DOI] [PMC free article] [PubMed] [Google Scholar]
- 13.Rosenfeld S. Why do high-dimensional networks seem to be stable?-A reflection on stochasticity of dynamically unstable nonlinear systems. In: Gauges R, Kummer U, Pahle J, Willy P, editors. Fifth Workshop on Computation of Biochemical Pathways and Genetic Networks; University of Heidelberg, Heidelberg. 2008. pp. 101–12. [Google Scholar]
- 14.Rosenfeld S. Origins of Stochasticity and Burstiness in High-Dimensional Biochemical Networks, EURASIP. Journal of Bioinformatics and Systems Biology. 2009 doi: 10.1155/2009/362309. [DOI] [PMC free article] [PubMed] [Google Scholar]
- 15.Rosenfeld S. Characteristics of transcriptional activity in nonlinear dynamics of genetic regulatory networks. Gene Regul Syst Bio. 2009;3:159. doi: 10.4137/grsb.s3119. [DOI] [PMC free article] [PubMed] [Google Scholar]
- 16.Rosenfeld S. Patterns of stochastic behavior in dynamically unstable high-dimensional biochemical networks. Gene Regul Syst Bio. 2009;3:1. doi: 10.4137/grsb.s2078. [DOI] [PMC free article] [PubMed] [Google Scholar]
- 17.Wolfram S. 2002. A New Kind of Science, Wolfram Media.
- 18.Rapp PE. An Atlas of Cellular Oscillations. Jounal of Experimental Biology. 1979;81:281. doi: 10.1242/jeb.81.1.281. [DOI] [PubMed] [Google Scholar]
- 19.Nitabach MN, Blau J. Cellular Clockwork. Nature Genetics. 2002;32:559. doi: 10.1038/ng1202-559. [DOI] [PubMed] [Google Scholar]
- 20.Schriber U, Naef F. Cellular oscillations: rhytmic gene expression and metabolism. Current Opinion in Cell Biology. 2005;17:223. doi: 10.1016/j.ceb.2005.01.007. [DOI] [PubMed] [Google Scholar]
- 21.Goldbeter A. Complex oscillatory phenomena, including multiple oscillations, in regulated biochemical systems. Biomed Biochim Acta. 1985;44:881. [PubMed] [Google Scholar]
- 22.Goldbeter A. Computational approaches to cellular rhythms. Nature. 2002;420:238. doi: 10.1038/nature01259. [DOI] [PubMed] [Google Scholar]
- 23.Reil T. Dynamics of Gene Expression in an Artificial Genome—Implications for Biological and Artificial Ontogeny, Advances in Artificial Life. 5th European Conference; 1999. pp. 457–66. ECAL’99. [Google Scholar]


