Abstract
Transcription factor p63, a p53 family member, plays a role in epithelial cell development, cell cycle arrest, apoptosis, and tumorigenesis. Point mutations, primarily in the DNA binding domain (p63DBD), lead to malformation syndromes. To gain insight into differences between p63 and p53 and the impact of mutations on the structure, we have determined two crystal structures of p63DBD in complex with A/T-rich response elements. One complex contains a 10-bp DNA half-site response element (5′AAACATGTTT3′) and the other contains a 22-bp DNA full response element with a 2-bp spacer between two half-sites (5′AAACATGTTTTAAAACATGTTT3′). In both structures, each half-site binds a p63DBD dimer. The two p63DBD dimers do not interact in the presence of the DNA spacer, whereas they interact with one another in the p63DBD/10-bp complex where the DNA simulates a full response element by packing end-to-end. A unique dimer–dimer interaction involves a variable loop region, which differs in length and sequence from the counterpart loop of p53DBD. The DNA trajectories in both structures assume superhelical conformations. Surface plasmon resonance studies of p63DBD/DNA binding yielded Kd = 11.7 μM for a continuous full response element, whereas binding was undetectable with the 22-bp DNA, suggesting an important contribution of a p63DBD interdimer interface to binding and establishing that p63DBD affinity to the response element is approximately 1,000-fold lower than that of p53DBD. Analyses of the structural consequences of p63DBD mutations that cause developmental defects show that, although some mutations affect DNA binding directly, the majority affects protein stability.
The transcription factor p63 controls the development and morphogenesis of epithelial tissues (1–3). Mutations in the gene cause limb and orofacial defects, many of which occur in the DNA binding domain (4). Overexpression of the isoforms lacking the transactivation domain promotes tumorigenesis in some cancers (5–7). p63 is a member of a transcription factor family that also includes the p53 tumor suppressor and p73 (8). These are multidomain proteins that contain an N-terminal transactivation (TA) domain, a DNA binding domain (DBD), and a tetramerization domain (TD). Additionally, p63 and p73, but not p53, contain at their C termini a domain known to interact with other proteins, the sterile alpha motif (SAM), followed by a transcription inhibitory domain (TID) (8, 9). Alternative promoters of the p53, p63, and p73 genes yield the respective gene products with truncated TA domains. Several alternative splicing sites at the 3′ end of both the p63 and p73 transcripts truncate the SAM and TID domains and result in additional isoforms (10). In contrast to p53-null mice, which are developmentally normal, p63-null mice revealed a complex relationship between the gene and development, with severe deleterious effects (2, 3).
p53 family members function as tetramers. Their response elements contain two tandem repeats of 10-bp half-sites without a spacer or with a spacer of 1–22 bp in length. The first structure of p53DBD in complex with DNA revealed key protein–DNA interactions (11). This structure was followed by a number of crystal structures with DNA molecules representing half or full response elements, which revealed the mode of protein oligomerization when bound to the DNA. Moreover, whereas the TD defines the functional oligomerization state, these crystal structures exhibited DBD tetrameric association as well (12–15). When bound to a DNA half-site, two p53DBD monomers assemble into a dimer placed across a twofold axis, referred to as the D axis, which is located at the center of the DNA half-site and perpendicular to the DNA axis. With the exception of the first structure (11), all p53DBD/DNA crystal structures exhibit the same dimer architecture. Two dimers associate into a tetramer by a second twofold axis, referred to as the T axis, located at the ends of the DNA half-sites and also perpendicular to the DNA axis. Two types of the T axes have been observed in p53DBD/DNA crystals, resulting in two types of p53DBD tetramers, which have been denoted type I and type II. They differ substantially in the relative orientation of the dimers and the nature of the interdimer interfaces (14). The type II T axis is parallel to the D axis, whereas the type I T axis rotates approximately 17° clockwise relative to the D axis or the type II T axis. As a consequence, the two dimers of the type II tetramer are parallel to one another, whereas they rotate 33° to one another about the DNA helix axis in the type I tetramer. The interface of the type I tetramer involves mainly contacts between a single subunit of each dimer and creates 700 Å2 of embedded interdimer surface area (12), whereas that of the type II tetramer involves two identical contacts of both dimer subunits and creates 1,500 Å2 of embedded interdimer surface area (13–15). The protein regions involved in dimer–dimer contacts are different in the type I and type II tetramers. A notable difference is the involvement of a segment connecting the H1 α-helix and S5 β-strand, termed here the L2B loop (Fig. 1A), which plays a role in the formation of the type I tetramer but not the type II tetramer. Moreover, the detailed interactions that define the type II tetramer vary in different crystal structures.
Fig. 1.
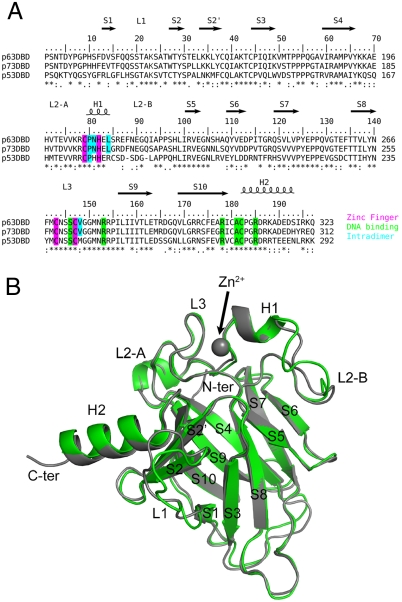
(A) Sequence alignment of DBDs of human p53 family members. Key amino acid residues are highlighted. (B) Superposition of p63DBD (chain A of the p63DBD/22-bp structure) and p53DBD (chain A in the PDB ID code 2AHI). The p63DBD and p53DBD molecules are colored green and gray, respectively.
The DBDs of p63 and p53 share 60% amino acid sequence identity. However, data have accumulated that suggest different mechanisms of TA and (or) DNA binding. Firstly, the DNA binding consensus motif of p63 appears to deviate significantly from that of p53 (16, 17). A SELEX study showed that the tetranucleotide core motif (positions 4–7 in the half-site) for p63 is similar but not necessarily identical to that for p53. A cytosine base is allowed in position 5 and the flanking regions prefer A/T-rich sequences. The recent discovery of the p63 and p73 response elements in BRCA2 and mre11 promoters is consistent with the SELEX study (18). Secondly, the L2B loop, which discriminates the type I and type II p53DBD tetramers, differs in sequence and length in p53 and p63 (Fig. 1). Thirdly, some of the genes activated by p63 are not activated by p53 (18, 19). Fourthly, a microarray study shows that the target sites for p63 differ from those of p53; in particular, p63 targets are enriched for genes involved in cell adhesion, proliferation, and death (20).
The structural and binding studies of p63DBD/DNA described here were undertaken to gain insight into p63 function and mechanism at the atomic level. They reveal that p63DBD and p53DBD greatly differ in response elements binding affinities. Two different p63DBD/DNA crystal structures highlight similarities and differences between p63DBD and p53DBD, and provide the framework for interpreting the structural consequences of mutations causing developmental defects.
Results
Overall Structures.
Cocrystals of the p63DBD and DNA were obtained with two types of self-complementary blunt-end sequences: a 10-bp 5′AAACATGTTT3′ and a 22-bp 5′AAACATGTTTTAAAACATGTTT3′. Both DNA molecules contained the same “CATG” core motif, and A/T-rich flanking regions. The two structures were determined by molecular replacement and refined to a resolution limit of 3.2 and 2.5 Å, respectively (Table S1). Although at different space groups, the DNA molecules in both crystals assume the B-form conformation and pack end-to-end throughout the crystal lattice, simulating a continuous DNA double helix. The overall monomer structure of the p63DBD resembles closely that of the p53DBD (Fig 1B), with a root mean square deviation of 0.9 Å in α-carbon atom positions. The most notable difference originates from the two-amino acid insertion in the p63DBD L2B loop and the different sequence compared with the p53DBD L2B loop, which lead to a different loop conformation. A second loop, L1, also differs from its p53DBD counterpart, exhibiting very high crystallographic temperature factors or complete disorder. Structural variability of the human and mouse p53DBD L1 loop was noticed previously (21).
In the absence of DNA, p63DBD exists in solution as monomers, as estimated by size-exclusion chromatography and static light scattering. In both p63DBD and p53DBD, it is the binding to the DNA that induces protein dimerization. The p63DBD/10-bp DNA crystal contains four dimer complexes in the asymmetric unit whereas the asymmetric unit of the p63DBD/22-bp DNA crystal contains a single copy of a DNA double helix bound to two p63DBD dimers. The length of 10-bp DNA (approximately 30 Å) matches the dimension of the p63DBD molecule. Consequently, the p63DBD dimers in the p63DBD/10-bp DNA complex interact with neighboring half-site dimers, whereas the protein dimers do not interact along the 22-bp DNA that contains a 2-bp spacer (although either dimer interacts with another dimer of a neighboring response elements).
p63DBD/10-bp DNA Crystal Packing Reveals Multiple Types of Tetramers.
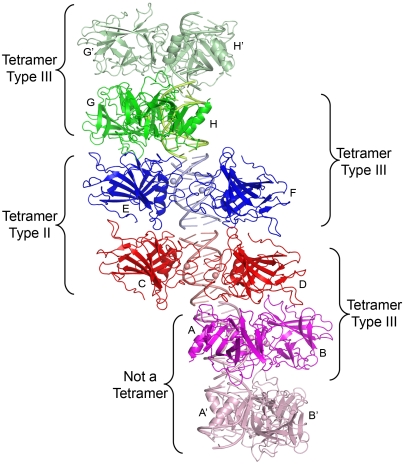
p63DBD dimer–dimer contacts are expected for response elements that lack a spacer between the two half-sites. Because the asymmetric unit of the p63DBD/10-bp DNA complex contains four dimers (Fig. 2), there is more than one way of viewing the interdimer interactions. Consequently, two types of tetramers can be described as follows. The first type of dimer–dimer association is unique and occurs twice in the asymmetric unit. We refer to this mode of association as the type III tetramer. In the following discussion, the eight p63DBD molecules in the asymmetric unit are labeled A–H consistent with the coordinates deposited in the Protein Data Bank (PDB), and the molecules E–H are transformed from another asymmetric unit such that all the p63DBD dimers may be viewed along a continuous DNA axis (Fig. 2). The A-B/C-D type III dimer–dimer interaction is nearly identical to that of the E-F/G-H dimers. This pattern of oligomeric partners extends throughout the entire crystal lattice. Molecule A interacts with molecule D, whereas molecule B does not interact with molecule C. Similarly, molecule E and H interact with one another, whereas molecules F and G do not. This tetramer association embeds 1,010 Å2 protein surface in the interdimer interface using a 1.4-Å probe radius in the calculation (Table S2).
Fig. 2.
p63DBD/10-bp DNA packing along the crystal lattice showing the type II and type III tetramers. The asymmetric unit encompasses molecules A–H. Molecules related by crystallographic symmetry operators are labeled with an apostrophe. Zinc ions are shown as spheres.
The second pattern of dimer–dimer partnership corresponds to one type II tetramer and one type III tetramer. Dimers C-D and E-F associate into type II tetramer, which embeds 1,700 Å2 surface area in the interdimer interface. The p63DBD type II tetramer is similar to that of p53DBD (13–15) (Fig. S1). The type III tetramer corresponds to dimer G-H and a second G-H dimer generated by a crystallographic twofold symmetry operator (Fig. 2). The remaining A-B dimer barely makes contact with a crystallographic symmetry related A-B dimer, generating only 270 Å2 embedded surface area.
In the following discussion, secondary structure units are labeled following the p53DBD convention except that the L2 loop is split into L2A and L2B because the two segments flank the H1 α-helix (Fig. 1A). As discussed in the Introduction, the twofold D and T axes in the type II tetramer are parallel, which places the two dimers antiparallel to one another and generates two identical contact surfaces. In the p63DBD structure, one contact surface occurs between molecules C and E and the second between molecules D and F (Fig. 2). Each of these surfaces involves two discontinuous patches: (i) Ser128 and Thr130 on the N-terminal segment together with Arg298 on the β-strand S10 interact with Gln255, Val256, and Thr258 on the loop connecting β-strands S7 and S8, and (ii) Ala195, Glu196, and Val198 on the loop L2A connecting the β-strand S4 and the helix H1 interact with residues on the β-strands S2, S2′, and S8 (Thr152, Thr169, Leu264). Interestingly, although the architecture of the p63DBD type II tetramer is similar to that of p53DBD and the contact involves similar surface regions, the specific amino acid residues involved in interactions are different. Moreover, the type II tetramers observed in different p53DBD structures also exhibit different interacting residues (14, 15), suggesting plasticity in the type II interface.
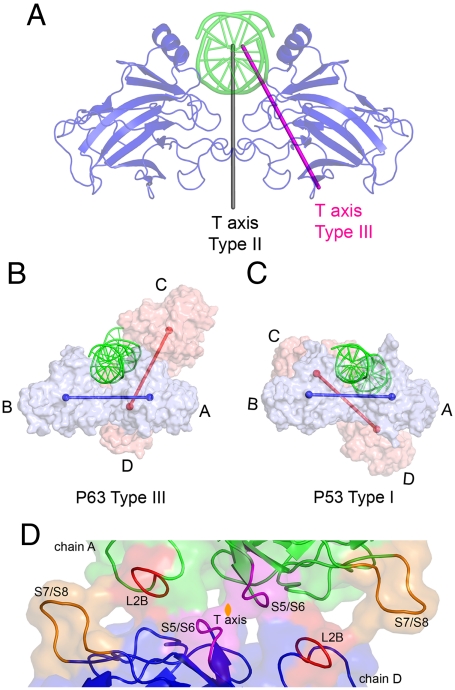
In contrast to the type II tetramer, the T axis in the type III tetramer is tilted 30° counterclockwise with respect to the D axis (Fig. 3A), which generates a “winged” tetramer assembly with a 120° angle between the lines connecting the centers of mass of the two dimer’s subunits (Fig. 3B). The type III tetramer engages only one subunit of each dimer, forming a symmetrical interface involving the loops L2B, S5/S6, and S7/S8 of each interacting molecule (Fig. 3D).
Fig. 3.
Relationship between modes of tetramerization in structures of p53 sequence family members. (A) The difference between the type II and type III T axis. The D axis runs parallel to the type II T axis but is displaced along the DNA axis, so that the two axes overlap at the shown orientation. (B) Surface representation of the type III tetramer and its relationship to the DNA. The centers of mass of dimer subunits are connected by lines that show the 120° angle between the two dimers, A-B and C-D. (C) The relative orientation of p53DBD dimers and DNA in the type I tetramer using the same orientation of the A-B dimer as in B. The coordinates of the PDB ID code 2AHI were used. (D) The interdimer interface of the type III p63DBD tetramer. The two subunits are colored in green and blue, respectively, except that contacting regions are highlighted in different colors. The loops involved in interdimer interactions are labeled following the secondary structure assignment shown in Fig. 1A.
Notably, the type I tetramer observed in the p53DBD/DNA structure contains a T axis that is also tilted with respect to the D axis (12). However, the tetramer orientation is quite different from that of the type III tetramer. The T axis tilts 17° clockwise from the D axis, generating two different contact surfaces, one with 550 Å2 embedded surface area and the other with 150 Å2 embedded surface area (Fig. 3C). Loop L2B is involved in the interface, but the interactions do not resemble those observed in the type III tetramer. Moreover, the amino acid sequence of L2B is different in p63DBD and p53DBD, as is the loop length. A type III p53DBD tetramer was modeled by superposing the p53DBD (chain A of PDB ID code 2AHI) with the type III p63DBD tetramer. This model shows that a p53DBD type III interdimer interface exhibits merely 190 Å2 of embedded surface area in contrast to the 1,010 Å2 of that observed in the p63DBD structure, suggesting that the type III mode of tetramerization is incompatible with the p53DBD amino acid sequence.
p63DBD Dimers Do Not Interact When Bound to the 22-bp DNA.
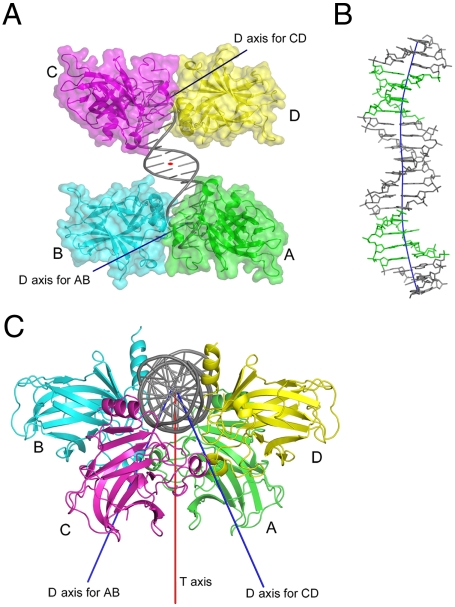
The 22-bp DNA represents a continuous full response element with 2-bp spacer. The DNA binds two p63DBD dimers. The dimer subunits obey the same D axis observed in all p53 family structures, as detailed in the following section. However, the two dimers do not interact with one another owing to the 2-bp insertion (Fig. 4A), and the DNA trajectory is curved (Fig. 4B). Moreover, because of the 2-bp insertion, the two dimers are oriented with respect to one another differently than in any previous structure, with a crossing angle of 48° (Fig. 4C). This value is lower than the expected 72° of an ideal helix in solid state owing to DNA bending as discussed later. The absence of nucleotide insertion between DNA molecules of neighboring asymmetric units generates dimer–dimer contacts across asymmetric units. The interface resembles closely the type II interdimer interface observed in p63DBD/10-bp DNA structure, with minor differences in a couple of side-chain conformations.
Fig. 4.
(A) A view of the p63DBD in complex with the 22-bp DNA, down the T axis (shown as a red oval at the center of the DNA). Two D axes are depicted, one for each dimer. There is no interdimer contact in this structure. (B) Structure and the trajectory of the 22-bp response element, showing that the DNA is bent. The DNA is shown in a stick model and colored in gray except that the CATG core regions are highlighted in green. The DNA trajectory is colored in blue. (C) Top view of the complex, showing the 48° crossing orientation of the two dimers and the two D axes oriented 24° with respect to the T axis.
p63DBD Dimer Interface and Protein–DNA Interactions.
The protein–protein dimer interactions and protein–DNA interactions are conserved in the two p63DBD/DNA structures and resemble closely those of the p53DBD/DNA dimer (Fig. S1). The interactions are described based on the p63DBD/22-bp DNA complex because of the higher resolution of the structure. Two p63DBD molecules, related by the same D axis as that defining the p53DBD dimer, bind to the response element half-site. In the p53DBD dimer, the dimer interface is symmetric and each subunit forms the same interactions mediated by the side chains of Pro177, His178, and Arg181 located on the H1 α-helix, and Met243 located on the L3 loop. The p63DBD dimer interface contains analogous residues. The proline is conserved (Pro206 in p63), but the remaining three residues, Asn207, Leu210, and Val274, are different. Leu210 of p63DBD is the counterpart of Arg181 of p53DBD, which forms an intermolecular ion pair with Glu180 in several crystal structures (14, 15). The two Asn207 side chains in p63DBD form hydrogen bonds, each to the Asn207 backbone nitrogen and Val274 backbone oxygen atoms of the partner subunit. In contrast, the pair of p53DBD counterpart residues, His178, adopts side-chain orientations that project away from one another. Together, the pairs of Pro206, Leu210, and Val274 surround the Asn207 pair and form a slightly larger hydrophobic patch than that of the p53DBD counterpart. Although the protein–protein dimer interactions are not extensive, they may nevertheless be important for function. For example, p53DBD dimer interface mutations occur in human cancer (http://www-p53.iarc.fr/).
In general, the p63DBD-DNA interactions are similar to those of p53DBD. Relevant to the sequence specificity toward the core tetranucleotide, Arg311 guanidinium group forms bidentate hydrogen bonds with the O6 and N7 atoms of the G7 (Fig. S2 A and B). This interaction also defines the requirement for a cytosine in position 4 because the C4 pairs with the core G7 of the complimentary DNA strand, facilitating an interaction with the Arg311 guanidinium group of the partner p63DBD subunit. Two more protein–nucleobase interactions are present, but not with the core tetranucleotide: The Ala307 Cβ and the Cys308 Sγ form van der Waals interactions with the methyl group of the T8. The same interactions were observed in the crystal structure of p53DBD in complex with a response element half-site (12). In all other p53DBD/DNA structures, the DNA contains a cytosine in position 8 instead of a thymine and the cysteine thiol group interacts with the cytosine amino group. The two possible types of interactions explain the lack of strict specificity for a particular purine and pyrimidine in positions 3 and 8, respectively, and in addition, they highlight the requirement for a pyrimidine in position 8. A SELEX study showed that p63DBD prefers an adenine in position 3 of the half-site and a thymine in position 8 (22). Finally, the structure shows that the bases at positions 1,2, 9, and 10 do not interact with the protein at all, consistent with the lack of base discrimination observed in the SELEX experiments (22).
The remaining protein–DNA interactions are with the DNA phosphate groups and include the Arg304 guanidinium group forming an ion pair with the phosphate of T6, the Ser272 forming a hydrogen bond with a phosphate’s oxygen of G7, and the Ala307 amide group forming a hydrogen bond with a second phosphate oxygen of G7. In addition, the Arg279 side chains of two subunits, each on a different dimer, project toward the DNA to form electrostatic interactions with the phosphate groups of T20 or T21 of the complementary DNA strand, albeit the guanidinium-phosphate distances are too long for formal salt bridges. Again, equivalent interactions and similar arginine side-chain conformation are present in p53DBD/DNA structures (13–15). These phenomena were attributed to narrowing of the minor groove in the regions flanking the CATG core motif (14), and such narrowing also occurs in the p63DBD/DNA structures.
DNAs Form Superhelices Through Crystal Packing.
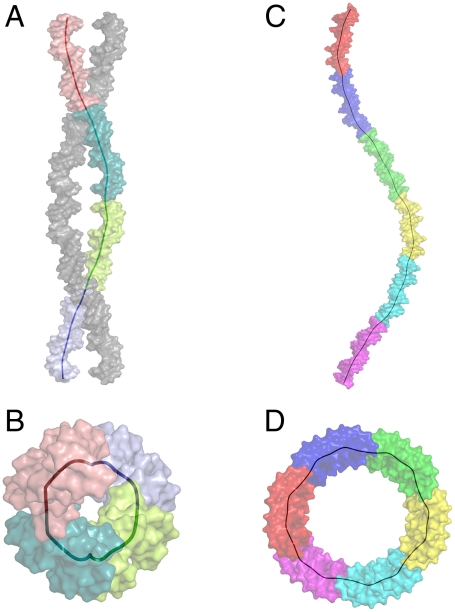
A structural feature revealed in the two p63DBD/DNA crystal structures, which has not been observed in any of the reported p53DBD/DNA complexes, is that the packing of the DNA throughout the crystal lattices mimics superhelix. In the p63DBD/10-bp DNA structure, the DNA trajectory assumes left-handed superhelix, with four tetramers per superhelical turn (Fig. 5 A and B). In the p63DBD/22-bp DNA structure, the DNA trajectory assumes right-handed superhelix, and six tetramers comprise a complete superhelical turn (Fig 5 C and D). The parameters of the two DNA molecules are summarized in Table S3. In the p63DBD/10-bp DNA structure, crystal packing creates two interwoven DNA trajectory, which is not observed in the complex with 22-bp DNA.
Fig. 5.
Superhelical DNA trajectories in the crystals. The trajectory of the global axes of the colored coil depicts the superhelix. DNA molecules are represented as surface models. Each color of the multicolored DNA coil corresponds to a full response element. A and B show the 10-bp DNA packing perpendicularly and down the DNA left-handed superhelical axis, respectively (A shows the two interwoven coils). There is a quarter-superhelical turn per 20-bp DNA. C and D show the 22-bp DNA perpendicularly and down the right-handed superhelix. There is a one-sixth superhelical turn per 22-bp DNA.
The DNA sequences used in this study have the same core CATG motif as that recognized by the p53DBD. However, the flanking DNA sequences are A/T rich, which an in vitro study showed to be optimal for p63 binding (16). The A/T content may affect the DNA stiffness, the protein/DNA affinity (23), and therefore the tendency to form a superhelix. However, because crystal-packing forces may affect the DNA conformation, the forces that give rise to the superhelix must be viewed with caution. Nevertheless, the presence of superhelix mimicries in two different crystal forms, which incorporate two different DNA sequences, is intriguing. Obviously, with response elements that lack spacers, the dimer–dimer orientation, which is determined by the interdimer interface, needs to be consistent with the DNA superhelix conformation, and the type II and III dimer–dimer interfaces of p63DBD meet this requirement.
p63DBD-DNA Binding Studies.
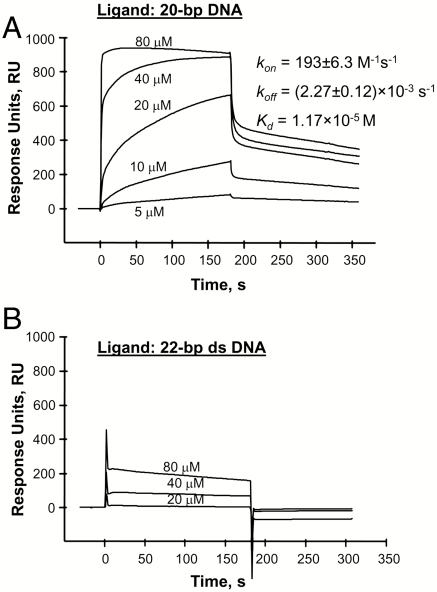
Nitrocellulose filter DNA binding assay, useful for affinities with Kd lower than micromolar size, did not detect p63DBD binding to either the 22-bp DNA or the corresponding 20-bp DNA lacking the 2-bp spacer, using p63DBD concentrations as high as 1 μM. These results are consistent with previous studies that observed no binding of free p63DBD to p53 response element sequences using gel shift assays as well as fluorescence correlation assays (24). Therefore, we employed surface plasmon resonance (SPR), suitable for measuring dissociation constants at the micromolar ranges (SI Text). The 20- and 22-bp double-stranded DNA fragments were captured on a streptavidin-coated sensor chip through a biotin group, followed by a flexible tether consisting of a single-stranded 11 thymine deoxynucleotides that assured protein accessibility to the two response element half-sites. A nonspecific 22-bp double-stranded DNA, generated and captured onto the chip in the same manner, served as the reference. The 20-bp response element exhibited a Kd = 11.7 μM (Fig. 6A) and a stoichiometry of 4.1 p63DBD molecules per full response element using a 1∶1 Langmuir binding model. This binding affinity is three orders of magnitude weaker than that of p53DBD to 20-bp response elements (25). Moreover, a Kd value could not be derived from the sensograms measured with the 22-bp DNA using up to 80-μM protein concentration (Fig. 6B) because the SPR signal is indistinguishable from that with the nonspecific DNA reference. Thus, the disparity between p63DBD and p53DBD affinities to a spacer-containing 22-bp response element is even greater than that to a 20-bp response element (12).
Fig. 6.
Sensorgrams of p63DBD/DNA binding. The half-site response element contain the same sequences as those in the crystal structures. (A) A 20-bp DNA containing two continuous half-sites. (B) A spacer-containing 22-bp DNA. Nonspecific 22-bp DNA served as reference. Biotinylated DNAs were captured on streptavidin-coated CM-5 sensor chip. The binding curves were corrected for background and bulk refractive index contribution using the reference DNA. SI Text provides the experimental detail.
Discussion
p63DBD/DNA Affinity.
Gel shift assay did not detect free p63DBD binding to response elements (24). Similarly, in the current study, we did not detect binding using nitrocellulose filter DNA binding assay and consequently we used SPR to determine approximately three order of magnitude lower p63DBD binding affinity to a 20-bp response element compared with p53DBD. In contrast, Klein et al. (24) showed that p63DBD fused to gluthatione S-transferase formed dimers in solution, which dramatically enhanced binding to response elements and yielded apparent dissociation constants comparable to those of the monomeric p53DBD alone or the fusion version. Thus, preformed dimer is clearly important for p63DBD function. Because all the response elements tested in that study contained tandem repeats without spacers, the contribution of dimer–dimer interaction to protein–DNA binding remained unknown. In the current study, we discovered that the p63DBD binding affinity to the 20-bp response element was measurable with an apparent Kd of 11.7 μM whereas the binding affinity to the spacer-containing 22-bp response element could not be measured. This finding supports the notion that the dimer–dimer interactions play an important role in p63DBD/DNA specific binding.
A recent study showed that the p63 recognized the BRCA2 and mre11 promoter regions that contain 1- and 22-bp spacers between half-sites, respectively (18), a result that motivated the structure determination of p63DBD in complex with a 22-bp response element. Despite the undetectable association between the p63DBD and the spacer-containing response element, the complex crystallized and yielded a structure (in contrast to our failure so far to crystallize a complex with 20-bp DNA). We note that the protein concentration in the crystallization experiments reached 250 μM, and both protein–protein and DNA–DNA interactions mediated crystal contacts. Nevertheless, the protein–DNA interactions and the dimer interface observed in the two p63DBD/DNA complexes are the same. When compared with the p53DBD/DNA structures, differences exist in the L1 loop conformation and in the residues involved in the dimer interface, both of which may contribute to differences in the binding affinities. Additional binding determinants may be the interdimer interactions and DNA “bendability.” For example, DNA conformational perturbations have been postulated to alter binding cooperativity and affinity to p53DBD upon changing the second and third base pairs of the response element core, not involved in direct protein interaction (26). Dissection of the affinity determinants requires further investigation not only of the p63DBD alone but together with other p63 domains. Indeed, the p53 tetramerization domain contributes to the response element binding affinity, as demonstrated by a p53DBD-TD construct containing a mutation that impairs tetramerization, which exhibited sixfold reduced DNA binding affinity (27).
Structural Consequences of Mutants Associated with Developmental Defects.
p63 mutations cause several malformation genetic syndromes, of which ectrodactyly ectodermal dysplasia-cleft syndrome (EEC) is the most common one. The p63 mutations also cause nonsyndromic single malformation such as split hand/foot malformation-4 (SHFM4) and nonsyndromic cleft lip (NSCL). Most of the mutations associated with EEC and several of those associated with SHFM4 and NSCL occur in the p63 DBD at 22 primary sequence positions (4). Inspection of the crystal structure along with a SNPs3D analysis (28) highlights the likely structural consequences of these mutations (Table S4). Of the 22 positions, four (Ser272, Arg279, Arg304, and Cys308) are involved directly in p63-DNA interactions; hence the mutations (S272N, R279C/H/Q, R304P/Q/W, and C308S/Y) are expected to impair DNA binding. Sixteen additional mutations appear to reduce protein stability, three of which eliminate zinc coordination (H208Y, C269Y, C273Y), and some of which indirectly impact DNA binding, zinc binding, or tetramerization (type II or type III). Those destabilizing mutations suggest that the cellular level of the protein is critical to development. In contrast, two lysine residues, K193 and K194, whose mutations to glutamic acids are associated with SHFM4, locate on the protein surface and such mutations are not expected to reduce protein stability or DNA affinity. However, both lysine residues are targets of ubiquitination and their replacement by glutamic acid inhibits proteasome-mediated degradation of p63 (29). An increase in protein half-life would be expected to have the reverse effect on transcription compared with the mutations that destabilize p63 or abolish DNA binding. Rossi et al. (29) proposed that the elevated p63 level due to the prolonged half-life leads to misexpression of target genes. Reduced p63 half-life by destabilizing mutations might also alter the normal balance of expression of target genes. This hypothesis and the mechanism by which similar developmental abnormalities are associated with opposing effects on protein stability need further investigation.
Methods
A detailed description of the methods is available in SI Text. Briefly, the p63DBD was expressed in Escherichia coli and purified to homogeneity. SPR experiments were performed on a Biacore T100 optical biosensor (GE Health Sciences), using biotinylated DNA captured on streptavidin-coated sensor chip, and analyzing the data with the BIAevaluation software, version 3.1 (BIAcore). Crystals were obtained by vapor diffusion in hanging drops using protein and self-complementary DNA at room temperature. Drops containing 1∶1 volumes of protein/DNA complex and reservoir solution were equilibrated against reservoir solution containing 0.2 M ammonium formate, 0.1 M 2-[Bis-(2-hydroxyethyl)-amino]-2-hydroxymethyl-propane-1,3-diol (Bis-Tris) (pH 6.8), and 10% polyethylene glycol 3350 for the p63DBD/10-bp DNA structure and 0.2 M ammonium acetate, 0.1 M Bis-Tris (pH 6.8), and 14% polyethylene glycol 3350 for the p63DBD/22-bp DNA structure. Crystals were cryoprotected and flash cooled to liquid nitrogen temperature. X-ray diffraction data were collected at 100 K on the General Medical Sciences and National Cancer Institute Collaboration Access Team 23-ID beamline at the Advanced Photon Source (Argonne National Laboratory). The structures were determined by molecular replacement.
Supplementary Material
Acknowledgments.
We thank Drs. Sidransky, Ratovitski, and Fomenkov at Johns Hopkins School of Medicine for the p63 cDNA. We are grateful to Drs. Scott Walsh and Kap Lim at the Institute for Bioscience and Biotechnology Research (IBBR) and the Advanced Photon Source General Medical Sciences and National Cancer Institute Collaboration Access Team staff for help in data collection, and Dr. Jane Ladner at National Institute of Standards and Technology for help in static light scattering measurements. The discussions with Dr. John Moult at IBBR and Dr. Zippora Shakked at the Weizmann Institute are much appreciated. This work was supported by National Institutes of Health Grants P01-GM057890 and R01-GM087922.
Footnotes
The authors declare no conflict of interest.
*This Direct Submission article had a prearranged editor.
Data deposition: The atomic coordinates and structure factors have been deposited in the Protein Data Bank, www.pdb.org (PDB ID codes 3QYM and 3QYN).
This article contains supporting information online at www.pnas.org/lookup/suppl/doi:10.1073/pnas.1013657108/-/DCSupplemental.
References
- 1.Crum CP, McKeon FD. p63 in epithelial survival, germ cell surveillance, and neoplasia. Annu Rev Pathol. 2010;5:349–371. doi: 10.1146/annurev-pathol-121808-102117. [DOI] [PubMed] [Google Scholar]
- 2.Mills AA, et al. p63 is a p53 homologue required for limb and epidermal morphogenesis. Nature. 1999;398:708–713. doi: 10.1038/19531. [DOI] [PubMed] [Google Scholar]
- 3.Yang A, et al. p63 is essential for regenerative proliferation in limb, craniofacial and epithelial development. Nature. 1999;398:714–718. doi: 10.1038/19539. [DOI] [PubMed] [Google Scholar]
- 4.Rinne T, Brunner HG, van Bokhoven H. p63-associated disorders. Cell Cycle. 2007;6:262–268. doi: 10.4161/cc.6.3.3796. [DOI] [PubMed] [Google Scholar]
- 5.Mills AA. p63: Oncogene or tumor suppressor? Curr Opin Genet Dev. 2006;16:38–44. doi: 10.1016/j.gde.2005.12.001. [DOI] [PubMed] [Google Scholar]
- 6.Rocco JW, Leong CO, Kuperwasser N, DeYoung MP, Ellisen LW. p63 mediates survival in squamous cell carcinoma by suppression of p73-dependent apoptosis. Cancer Cell. 2006;9:45–56. doi: 10.1016/j.ccr.2005.12.013. [DOI] [PubMed] [Google Scholar]
- 7.Trink B, Osada M, Ratovitski E, Sidransky D. p63 transcriptional regulation of epithelial integrity and cancer. Cell Cycle. 2007;6:240–245. doi: 10.4161/cc.6.3.3803. [DOI] [PubMed] [Google Scholar]
- 8.Yang A, Kaghad M, Caput D, McKeon F. On the shoulders of giants: p63, p73 and the rise of p53. Trends Genet. 2002;18:90–95. doi: 10.1016/s0168-9525(02)02595-7. [DOI] [PubMed] [Google Scholar]
- 9.Serber Z, et al. A C-terminal inhibitory domain controls the activity of p63 by an intramolecular mechanism. Mol Cell Biol. 2002;22:8601–8611. doi: 10.1128/MCB.22.24.8601-8611.2002. [DOI] [PMC free article] [PubMed] [Google Scholar]
- 10.Yang A, et al. p63, a p53 homolog at 3q27-29, encodes multiple products with transactivating, death-inducing, and dominant-negative activities. Mol Cell. 1998;2:305–316. doi: 10.1016/s1097-2765(00)80275-0. [DOI] [PubMed] [Google Scholar]
- 11.Cho Y, Gorina S, Jeffrey PD, Pavletich NP. Crystal structure of a p53 tumor suppressor-DNA complex: Understanding tumorigenic mutations. Science. 1994;265:346–355. doi: 10.1126/science.8023157. [DOI] [PubMed] [Google Scholar]
- 12.Kitayner M, et al. Structural basis of DNA recognition by p53 tetramers. Mol Cell. 2006;22:741–753. doi: 10.1016/j.molcel.2006.05.015. [DOI] [PubMed] [Google Scholar]
- 13.Malecka KA, Ho WC, Marmorstein R. Crystal structure of a p53 core tetramer bound to DNA. Oncogene. 2009;28:325–333. doi: 10.1038/onc.2008.400. [DOI] [PMC free article] [PubMed] [Google Scholar]
- 14.Kitayner M, et al. Diversity in DNA recognition by p53 revealed by crystal structures with Hoogsteen base pairs. Nat Struct Mol Biol. 2010;17:423–429. doi: 10.1038/nsmb.1800. [DOI] [PMC free article] [PubMed] [Google Scholar]
- 15.Chen Y, Dey R, Chen L. Crystal structure of the p53 core domain bound to a full consensus site as a self-assembled tetramer. Structure. 2010;18:246–256. doi: 10.1016/j.str.2009.11.011. [DOI] [PMC free article] [PubMed] [Google Scholar]
- 16.Ortt K, Sinha S. Derivation of the consensus DNA-binding sequence for p63 reveals unique requirements that are distinct from p53. FEBS Lett. 2006;580:4544–4550. doi: 10.1016/j.febslet.2006.07.004. [DOI] [PubMed] [Google Scholar]
- 17.Perez CA, Pietenpol JA. Transcriptional programs regulated by p63 in normal epithelium and tumors. Cell Cycle. 2007;6:246–254. doi: 10.4161/cc.6.3.3801. [DOI] [PubMed] [Google Scholar]
- 18.Lin YL, et al. p63 and p73 transcriptionally regulate genes involved in DNA repair. PLoS Genet. 2009;5:e1000680. doi: 10.1371/journal.pgen.1000680. [DOI] [PMC free article] [PubMed] [Google Scholar] [Retracted]
- 19.Yan W, Chen X. GPX2, a direct target of p63, inhibits oxidative stress-induced apoptosis in a p53-dependent manner. J Biol Chem. 2006;281:7856–7862. doi: 10.1074/jbc.M512655200. [DOI] [PubMed] [Google Scholar]
- 20.Yang A, et al. Relationships between p63 binding, DNA sequence, transcription activity, and biological function in human cells. Mol Cell. 2006;24:593–602. doi: 10.1016/j.molcel.2006.10.018. [DOI] [PubMed] [Google Scholar]
- 21.Ho WC, Fitzgerald MX, Marmorstein R. Structure of the p53 core domain dimer bound to DNA. J Biol Chem. 2006;281:20494–20502. doi: 10.1074/jbc.M603634200. [DOI] [PubMed] [Google Scholar]
- 22.Perez CA, Ott J, Mays DJ, Pietenpol JA. p63 consensus DNA-binding site: identification, analysis and application into a p63MH algorithm. Oncogene. 2007;26:7363–7370. doi: 10.1038/sj.onc.1210561. [DOI] [PubMed] [Google Scholar]
- 23.Hogan ME, Austin RH. Importance of DNA stiffness in protein-DNA binding specificity. Nature. 1987;329:263–266. doi: 10.1038/329263a0. [DOI] [PubMed] [Google Scholar]
- 24.Klein C, et al. High thermostability and lack of cooperative DNA binding distinguish the p63 core domain from the homologous tumor suppressor p53. J Biol Chem. 2001;276:37390–37401. doi: 10.1074/jbc.M103801200. [DOI] [PubMed] [Google Scholar]
- 25.Balagurumoorthy P, et al. Four p53 DNA-binding domain peptides bind natural p53-response elements and bend the DNA. Proc Natl Acad Sci USA. 1995;92:8591–8595. doi: 10.1073/pnas.92.19.8591. [DOI] [PMC free article] [PubMed] [Google Scholar]
- 26.Beno I, Rosenthal K, Levitine M, Shaulov L, Haran TE. Sequence-dependent cooperative binding of p53 to DNA targets and its relationship to the structural properties of the DNA targets. Nucleic Acids Res. 2011;39:1919–1932. doi: 10.1093/nar/gkq1044. [DOI] [PMC free article] [PubMed] [Google Scholar]
- 27.Weinberg RL, Veprintsev DB, Fersht AR. Cooperative binding of tetrameric p53 to DNA. J Mol Biol. 2004;341:1145–1159. doi: 10.1016/j.jmb.2004.06.071. [DOI] [PubMed] [Google Scholar]
- 28.Yue P, Li Z, Moult J. Loss of protein structure stability as a major causative factor in monogenic disease. J Mol Biol. 2005;353:459–473. doi: 10.1016/j.jmb.2005.08.020. [DOI] [PubMed] [Google Scholar]
- 29.Rossi M, et al. Itch/AIP4 associates with and promotes p63 protein degradation. Cell Cycle. 2006;5:1816–1822. doi: 10.4161/cc.5.16.2861. [DOI] [PubMed] [Google Scholar]
Associated Data
This section collects any data citations, data availability statements, or supplementary materials included in this article.


