Abstract
Purpose
To use EM simulations to study the effects of body type, landmark position, and RF body coil type on peak local SAR in 3T MRI.
Materials and Methods
Numerically computed peak local SAR for four human body models (HBMs) in three landmark positions (head, heart, pelvic) were compared for a high-pass birdcage and a transverse electromagnetic 3T body coil. Local SAR values were normalized to the IEC whole-body average SAR limit of 2.0 W/kg for normal scan mode.
Results
Local SAR distributions were highly variable. Consistent with previous reports, the peak local SAR values generally occurred in the neck-shoulder area, near rungs, or between tissues of greatly differing electrical properties. The HBM type significantly influenced the peak local SAR, with stockier HBMs, extending extremities towards rungs, displaying the highest SAR. There was also a trend for higher peak SAR in the head-centric and heart-centric positions. The impact of the coil-types studied was not statistically significant.
Conclusion
The large variability in peak local SAR indicates the need to include more than one HBM or landmark position when evaluating safety of body coils. It is recommended that a HBM with arms near the rungs be included, to create physically realizable high-SAR scenarios.
Keywords: SAR, specific absorption rate, human body models, local SAR
The biological effects on human subjects in the presence of radio-frequency (RF) power in MR scans have been widely studied due to the potential thermal damage that might inadvertently occur in tissues. In a typical MR scan, induced and conservative electric fields are generated from the time-varying magnetic B1 field and the scalar potential differences across rung components, respectively. Ignoring displacement currents, the superpositioned E-field in a medium of finite conductivity results in an electrical current density distribution that creates a spatially varying local power deposition distribution (1). This implies that only power deposition due to moving charges is considered. The local power deposition per unit volume can then be divided by the volumetric density of the medium to obtain the power deposition per unit mass (W/kg). This quantity is commonly known as the specific absorption rate (SAR).
International standards have set safety limits on time-averaged local SAR, whole body and whole head average SAR during radio-frequency (RF) power deposition in MRI. In addition, recommendations on limits on core body and localized temperature rise have also been issued (2). While temperature rise is a more direct indicator of potential tissue damage due to heat, the global average SAR during an MRI scan is easier to estimate in vivo, and has become an accepted proxy to assess thermal risk to the patient. The global average SAR can be estimated in vivo by using power monitors to measure the total power deposited into a subject and dividing that power by the mass of the patient (3). This has been an adequate indicator of patient safety in body coils at lower MRI field strengths. However, at higher field strengths, the wavelengths of the radiated RF signals are reduced to the same order of size as anatomical features, and thus, interact with the tissues in a complicated manner to produce inhomogeneous B1+ distributions, as well as higher levels and higher incidences of peak local SAR spots in the subject. In addition, at higher field strengths, RF shimming (4–6) and parallel transmit (7,8) techniques may be necessary to obtain homogeneous B1+ or magnetization profiles. These techniques allow for different RF signals to be used in different channels, and thus, may increase the risk of constructive electric field interferences in some locations, which could lead to regions with undesirably high local SAR values. Thus, at higher fields, local SAR distributions must be studied in conjunction with global average SAR as the latter may no longer be an independently adequate measure of patient safety.
The accurate measurement of in vivo local SAR (9) or temperature rise during an MRI scan is a very challenging problem, and, thus many studies still rely on electromagnetic numerical simulations to understand local SAR under different conditions (10–12). It is observed that, due to the long computation time and the lack of suitable human body models (HBMs), many studies on local SAR have limited their experiments to the use of a few HBMs that are generally held in fixed positions. Our work aims to assess the variability of local SAR across four HBMs in three landmark positions in 16-rung high-pass birdcage (HPBC) and transverse electromagnetic (TEM) body coils at 3T. The high pass birdcage (HPBC) coil is commonly used as a body coil for homogeneous excitation while the TEM volume coil (13) is increasingly utilized in MRI because of its high efficiency at high frequencies, and is often used in multi-channel systems (6).
Methods
EM Simulation Models
A TEM body coil (diameter=61.0 cm, length=42.2 cm) is modeled with 16 copper rungs attached to a copper shield (diameter=65.0 cm, length=100.0 cm) via copper strips (2.5 cm×2.0 cm). Each TEM rung consists of 3 separate copper strips, each of length 13.0 cm and width 2.5 cm, with four capacitor junctions. The 16-rung HPBC body coil (diameter=61.0 cm, length=62.0 cm) is shielded by a copper shield (diameter=66.0 cm, length=122.0 cm). The dimensions of the shields and coils are based on typical body coil dimensions. The relative peak SAR values in the imaging mode (homogeneous B1+) across experiments are of primary interest in this work.
Both body coils are tuned unloaded. For the HPBC coil, a 4-port drive (16) is modeled such that four voltage sources are inserted in gaps on the rear (superior end of head-first body model) end-ring at the 45°, 135°, 225° and 315° angular positions. The voltage sources have the same voltage amplitudes, and voltage phase values of 0°, 90°, 180° and 270°. When tuning the HPBC in xFDTD, point |B1+| sensors are placed in several locations including the middle of the coil, and Gaussian pulses are fed to the voltage sources. By observing the spectral peaks of the |B1+| sensors, the capacitor values are varied until the desired homogeneous mode frequency shifts to 127.74 MHz. For the TEM coil, each rung has a voltage source at the rear end of the rung (between the rung and a copper strip attaching it to the shield). The voltage sources in the TEM coil have phases that are dependent on the azimuthal positions of the rungs that they drive, e.g., the sources that drive the first, second, and, third rungs have phase values of 0°, 22.5°, and, 45.0°, respectively. The TEM coil is iteratively tuned one rung at a time by varying the capacitor values of each rung until the reactance of that rung is zero at 127.74 MHz. This is performed by feeding a broadband Gaussian pulse to one voltage source at a time while the respective rung is tuned. After the tuning process, the voltage sources excite each coil with sinusoidal continuous wave signals at 127.74 MHz with the same voltage amplitudes (for each coil). Fig. 1 shows axial slices of the homogeneous B1+ distributions obtained in the center of the unloaded HPBC and TEM coils after the coil tuning process. We verified that the numerically computed |B1+| distributions correlate qualitatively with measured data from an oil-water disc phantom in a birdcage coil and from human pelvic scans in a TEM coil. Informed consent was obtained for all human volunteer scans.
Fig. 1.
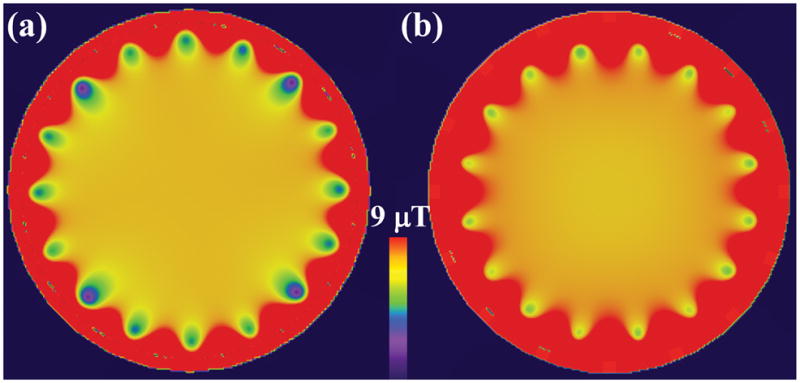
|B1+| of axial slices in unloaded high-pass birdcage (left) and TEM (right) RF body coils (normalized such that peak |B1+|=7.1 μT in the middle of the coils).
The visible man, visible woman (10), NORMAN, and, NAOMI (17,18) human body models, with 23, 34, 37, and, 40 tissue types, respectively, are used in the experiments. The HBMs are positioned with their heads (head-first entry into scanner with voltage feeds at the superior end of the coil), hearts (head-first entry), and pelvises (feet-first entry) in the center of the coil rungs, and remeshed to a finite-difference time-domain (FDTD) cell size of 3mm×3mm×3mm. A Liao absorption boundary condition is used for all simulations. The back of each HBM is located 17.5cm away from the furthest rung in the posterior direction. Each HBM in each landmark position is placed in the same location for both TEM and HPBC coils, i.e., any coordinate within the HBM in the TEM coil points to the same body location in the HPBC coil. A 4-Cole-Cole extrapolation method is used to compute the frequency-dependent dielectric properties of the various tissue types. All numerical FDTD simulations (approximately 20 mins each) are performed with the commercial software xFDTD (Remcom, State College, PA) on an Intel Xeon quad-core 2.13 GHz CPU with two Nvidia Tesla C1060 GPUs.
EM Simulation Experiments and SAR Computation
The raw local SAR distribution of an object that is irradiated with RF power can be expressed as
| [1] |
where σ is the electrical conductivity of the tissue, ρ is the volumetric density, r is the three-component spatial location vector (x,y,z), Epeak is the three-component peak electric field vector, f is the RF frequency, and, t is the time elapsed. When continuous wave RF power is applied, |Epeak(r,t,f)|, and hence, SARraw(r,t,f), are constant with time, i.e., the steady-state solution of E can be used directly to compute SARraw. In this work, we use continuous wave RF sources in all EM simulations. If a time-dependent RF waveform is applied instead, then SARraw will be a time-varying distribution.
Assuming a fixed RF frequency and removing f for convenience, the local SAR in 10g tissue regions can be expressed as
| [2] |
where S10g,r is the set of spatial locations in a neighborhood centered on r that contains 10g of tissue. According to IEC’s definitions of SAR limits (2), the time averaged SAR10g and whole body average SAR (3) can be expressed as
| [3] |
and,
| [4] |
respectively, where SARWB average(t′) is the whole body average SAR at some time point (spatially averaged over the body), T is the RF exposure time during which the local and whole body average SAR are temporally averaged, e.g., T=6 mins for IEC’s global and local SAR limits. Similar equations may be written for SAR1g. Since continuous wave excitation is used in our work, i.e., RF pulses with 100% duty cycle, the use of steady state SAR quantities is sufficient to elicit the relative differences in local SAR distributions for the various experiments.
Twenty-four numerical simulations are performed (4 HBMs×3 landmark locations×2 body coils). After each EM simulation with continuous wave sources, the whole body average SAR is normalized to 2.0 W/kg, which is the IEC 6-minute whole-body average SAR limit in the normal mode (2). The resultant maximum local SAR values, averaged over 10g (SAR10g) and 1g (SAR1g) regions, are then tabulated. Temporal averaging of whole body average SAR and local SAR (Eqns. 3 and 4) is not necessary as this work is primarily concerned with the relative change in peak SAR between different EM simulation experiments.
Statistical Analysis
To determine if the body coil type, HBM type, and, landmark position have a significant effect on either SAR1g or SAR10g, homogeneity of variance and one-way analysis of variance (ANOVA) tests are performed separately for peak SAR1g and SAR10g quantities. A multivariate analysis of variance (MANOVA) is also performed using the Lawley-Hotelling test statistic to determine if the factors considered have a significant effect on both peak SAR1g and SAR10g. All statistical analyses are performed with Minitab (Minitab, State College, PA).
Results
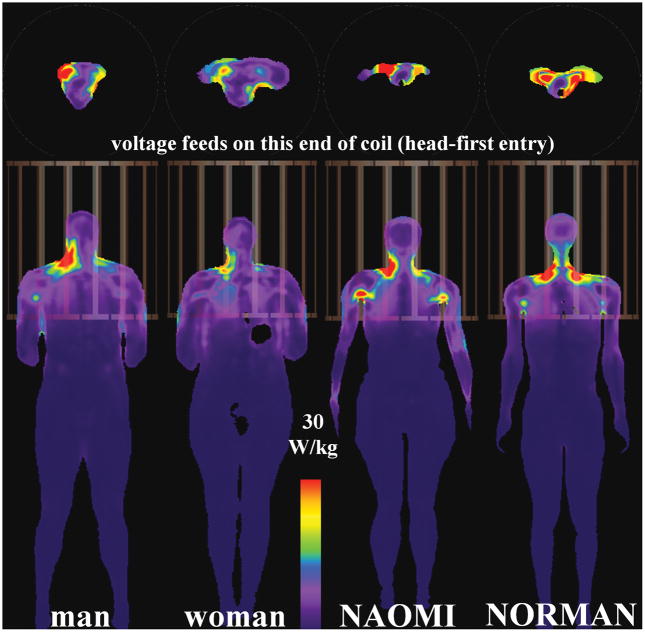
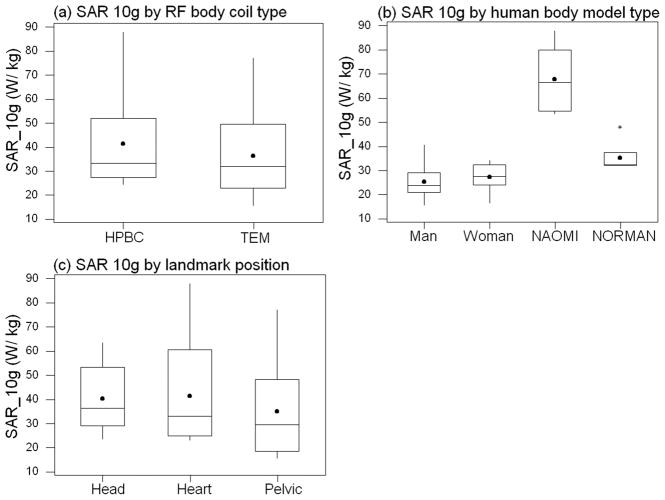
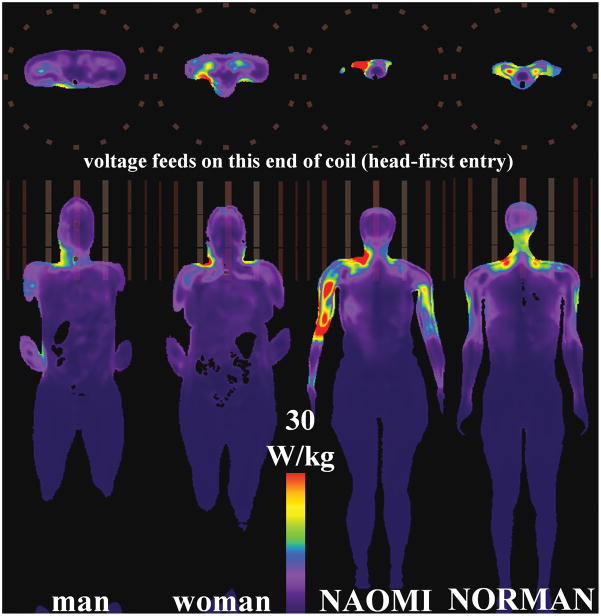
Tables 1 and 2 show the peak SAR1g and SAR10g values, respectively, for various experiments when the whole body average SAR is normalized to 2.0 W/kg. Tables 3 and 4 list the locations where the peak local SAR values (1g and 10g) are observed in all the experiments. Table 5 shows the results of the ANOVA and MANOVA tests with the peak SAR1g and SAR10g as the independent variables. Figs. 2 to 7 show the axial and coronal slices where the maximum SAR10g locations are observed for all 24 experiments. The display scales for these figures are identical and limited to a range of 0 to 30.0 W/kg to facilitate better visualization of the peak SAR spots across all experiments. Fig. 8 displays box plots of the peak SAR10g data (Table 2) with respect to the three parameters of interest: coil type, HBM type, and landmark position. In general, the peak local SAR values and locations show significant variation across all experiments.
Table 1.
Maximum normalized SAR1g for various landmark positions for HPBC and TEM body coils
| Landmark | Max. SAR1g (W/kg) normalized to whole body SARaverage of 2.0 W/kg |
|||||||
|---|---|---|---|---|---|---|---|---|
| Visible Man (1.77m) | Visible Woman (1.73m) | NAOMI (1.58m) | NORMAN (1.74m) | |||||
| HPBC | TEM | HPBC | TEM | HPBC | TEM | HPBC | TEM | |
| Head | 60.9 | 45.7 | 54.8 | 59.4 | 90.5 | 78.2 | 75.6 | 48.1 |
| Heart | 32.3 | 37.1 | 50.0 | 35.9 | 125.6 | 106.2 | 47.8 | 64.0 |
| Pelvic | 54.0 | 33.0 | 54.8 | 32.8 | 78.4 | 112.2 | 68.1 | 66.0 |
Table 2.
Maximum normalized SAR10g for various landmark positions for HPBC and TEM body coils
| Landmark | Max. SAR10g (W/kg) normalized to whole body SARaverage of 2.0 W/kg |
|||||||
|---|---|---|---|---|---|---|---|---|
| Visible Man (1.77m) | Visible Woman (1.73m) | NAOMI (1.58m) | NORMAN (1.74m) | |||||
| HPBC | TEM | HPBC | TEM | HPBC | TEM | HPBC | TEM | |
| Head | 40.7 | 23.4 | 28.1 | 31.8 | 63.6 | 54.9 | 48.1 | 32.3 |
| Heart | 24.4 | 22.9 | 34.5 | 26.6 | 88.1 | 69.2 | 32.3 | 33.9 |
| Pelvic | 25.4 | 15.6 | 27.1 | 16.4 | 53.4 | 77.3 | 32.1 | 32.6 |
Table 3.
Locations of maximum normalized SAR1g
| Landmark | Location of max. SAR1g (W/kg) normalized to whole body SARaverage of 2.0 W/kg |
|||||||
|---|---|---|---|---|---|---|---|---|
| Visible Man (1.77m) | Visible Woman (1.73m) | NAOMI (1.58m) | NORMAN (1.74m) | |||||
| HPBC | TEM | HPBC | TEM | HPBC | TEM | HPBC | TEM | |
| Head | neck interior | neck surface | neck interior | neck surface | right armpit | neck surface | neck interior | neck surface |
| Heart | neck surface | right abdomen interior (small hot spot) | upper right arm | right armpit | right wrist | mid-right arm interior | neck interior | mid-right arm surface |
| Pelvic | left abdomen interior (small hot spot) | right armpit | upper left thigh | upper left thigh | left upper arm | left wrist | left abdomen | upper left back (~2cm small hot spot at fat-muscle interface) |
Table 4.
Locations of maximum normalized SAR10g
| Landmark | Location of max. SAR10g (W/kg) normalized to whole body SARaverage of 2.0 W/kg |
|||||||
|---|---|---|---|---|---|---|---|---|
| Visible Man (1.77m) | Visible Woman (1.73m) | NAOMI (1.58m) | NORMAN (1.74m) | |||||
| HPBC | TEM | HPBC | TEM | HPBC | TEM | HPBC | TEM | |
| Head | neck interior | neck surface | neck interior | neck surface | neck interior | neck surface | neck interior | neck surface |
| Heart | upper right arm | right arm-torso contact | upper right arm | right armpit | right wrist | mid-right arm interior | neck interior | mid-right arm surface |
| Pelvic | right arm-torso contact | right armpit | upper right thigh | upper left thigh | mid-left arm interior | left wrist | upper left thigh | upper right thigh |
Table 5.
ANOVA and MANOVA results for all peak local SAR datasets
| Dependent Variables | ANOVA p-value |
MANOVA p-value (SAR1g and SAR10g) | |
|---|---|---|---|
| SAR1g | SAR10g | ||
| Body coil | 0.564 | 0.533 | 0.351 |
| Human body model | 0.000 | 0.000 | 0.000 |
| Landmark position | 0.988 | 0.787 | 0.039 |
Fig. 2.
Axial (top) and coronal (bottom) slices showing peak SAR10g locations for HBMs in HPBC body coil at the head-centered landmark position.
Fig. 7.
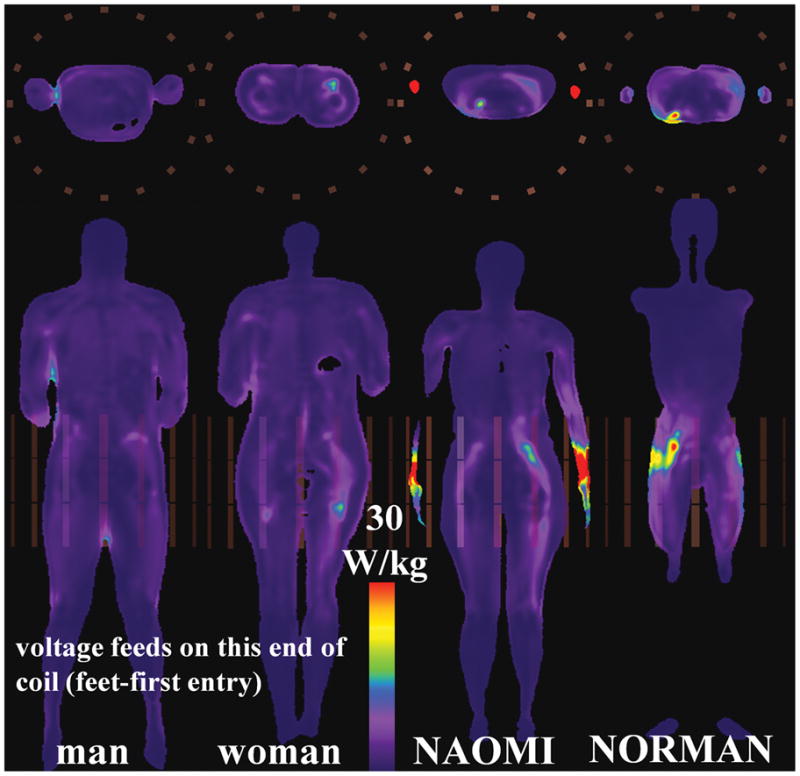
Axial (top) and coronal (bottom) slices showing maximum SAR10g for HBMs in TEM coil at pelvic-centered landmark position.
Fig. 8.
Box plots showing spread of peak SAR10g values for different (a) body coils, (b) human body models, and, (c) landmark positions. The dots denote the mean SAR10g values of the respective datasets.
SAR1g versus SAR10g – Qualitative Analysis
There is not always a direct correlation between the peak SAR1g and SAR10g tabulated in Tables 1 and 2, as the peak SAR1g and SAR10g locations are not always in the same vicinity. The Euclidean distances between peak SAR1g and peak SAR10g locations are computed for all experiments. There are only 16 out of 24 experiments in Tables 3 and 4 where the peak SAR1g and SAR10g locations are within 5.0 cm of each other, i.e. peak SAR1g and SAR10g locations in Tables 3 and 4 are in the same general area. The differences in the peak local SAR positions for SAR1g and SAR10g occur because spatial averaging is performed over different size regions for both quantities. The larger averaging volumes used in SAR10g calculations yield a greater spatial smoothing effect that typically underestimates the local SAR in regions where SAR hot spots are relatively focused and small in size. For example, the pelvic-centered NORMAN HBM in the TEM coil has a peak SAR1g hot spot in a small region in its upper-left back (Table 3), which diminishes in magnitude upon the computation of SAR10g. The peak SAR10g location is then observed in its upper-right thigh instead (Table 4).
Local SAR across HBMs in HPBC Body Coil – Qualitative Analysis
When the HPBC body coil isocenter is aligned over the heads of the four different HBMs, the peak SAR1g and SAR10g (first row of Tables 1 and 2, in the HPBC columns) have values of (mean ± standard deviation) 70.5 ± 16.0 W/kg, and 45.1 ± 14.8 W/kg, respectively. The associated peak SAR locations are mostly in the neck region (Tables 3 and 4) - only the NAOMI HBM has peak SAR1g in a non-neck region (armpit). This is illustrated in Fig. 2, which shows the SAR10g distributions for various head-centered HBMs in the HPBC. For the HPBC heart-centered experiments, the peak SAR1g and SAR10g have values of (mean ± standard deviation) 63.9 ± 41.9 W/kg, and 44.8 ± 29.2 W/kg, respectively. The peak SAR10g (Fig. 4) locations are found in the upper right arm (male, female), neck (NORMAN), and the wrist (NAOMI). In this landmark position, the wrists of the NAOMI HBM are only 11 mm away from the rungs but still within the patient space of the magnet bore. For the pelvic-centered experiments, the peak SAR1g and SAR10g have values of (mean ± standard deviation) 63.8 ± 11.7 W/kg, and 34.5 ± 11.7 W/kg, respectively. The peak SAR10g is observed in the abdomen (male), arms (NAOMI), and the thighs (woman, NORMAN). It is observed that, even for the same landmark position in the same HPBC body coil, there is a relatively wide range of peak local SAR values and locations across the four HBMs.
Fig. 4.
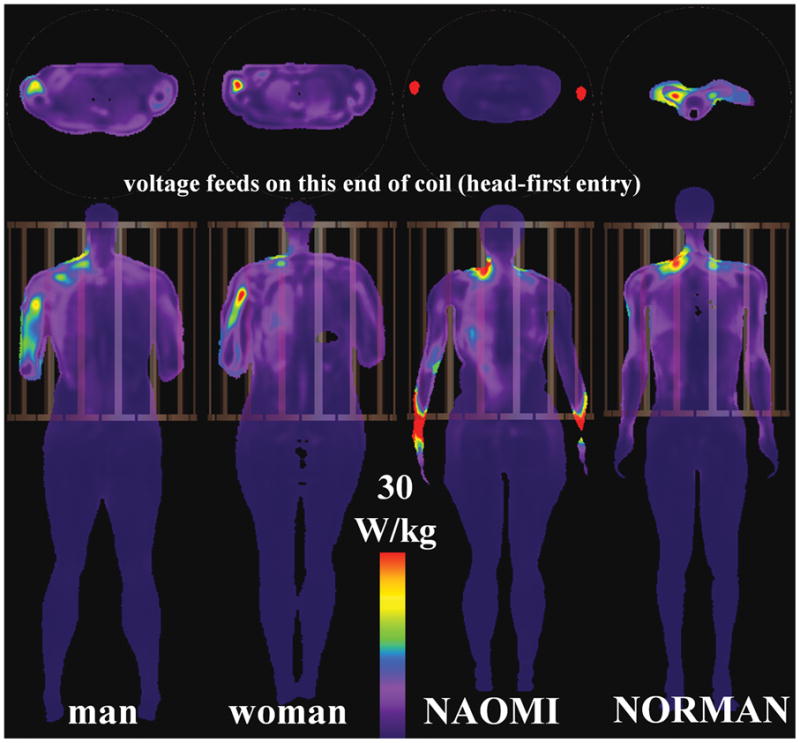
Axial (top) and coronal (bottom) slices showing peak SAR10g for HBMs in HPBC coil at heart-centered landmark position.
Local SAR across HBMs in TEM Body Coil – Qualitative Analysis
As in the HPBC experiments, the peak SAR1g and SAR10g in the head-centered HBMs in the TEM coil are located mainly in the neck region (Tables 3 to 4 and Fig. 3). The associated peak SAR1g and SAR10g have values of (mean ± standard deviation) 57.9 ± 14.8 W/kg, and 35.6 W/kg ± 13.5 W/kg, respectively. For the heart-centric TEM body coil experiments, the peak SAR locations are found in various parts of the arms as shown in Fig. 5. The peak SAR1g and SAR10g have values of (mean ± standard deviation) 60.8 ± 32.9 W/kg, and 38.2 ± 21.2 W/kg, respectively. In the heart-centric male HBM, the peak SAR1g is a small hot spot in the interior of the right abdomen (fat-muscle interface), and the peak SAR10g is at the interface of the right forearm and the torso. The latter is due to the high current density at the arm-torso interface when current loops are formed through the hands touching the torso. In the NAOMI HBM, the close proximity of the arms to the rungs and their distributed capacitors yields high local SAR due to the combined induced and conservative E-fields. The same phenomenon is observed in the arms of the NORMAN HBM, but with less severity, as the arms are not as close to the rungs as the NAOMI HBM. The peak SAR1g and SAR10g for the pelvic-centric TEM coil experiments have values of (mean ± standard deviation) 61.0 ± 37.5 W/kg, and 35.5 ± 37.5 W/kg, respectively.
Fig. 3.
Axial (top) and coronal (bottom) slices showing peak SAR10g locations for HBMs in TEM body coil at the head-centered landmark position.
Fig. 5.
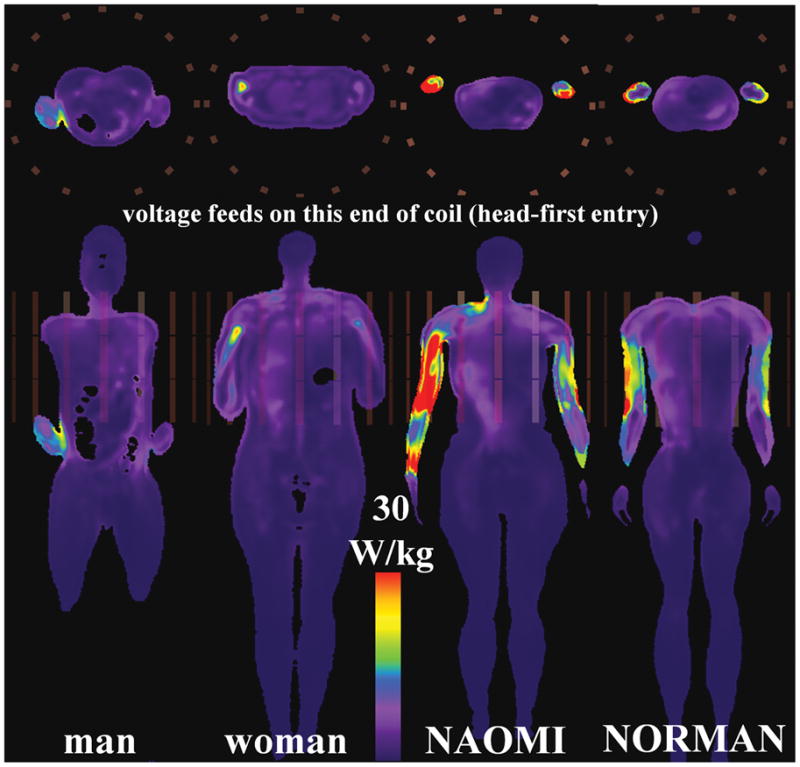
Axial (top) and coronal (bottom) slices showing peak SAR10g for HBMs in TEM coil at heart-centered landmark position.
Local SAR Comparison between HPBC and TEM Body Coils
All head-centered HBMs and the heart-centered woman HBM have similarly located peak SAR10g locations for both TEM and HPBC coils (41.7 % of 12 comparisons). The other 7 HPBC versus TEM coil comparisons (Tables 1 to 4 and Figs. 2 to 7) do not show any strong observable trends between the two coils in the values or locations of the peak local SAR.
ANOVA and MANOVA Results
Analysis of All Peak Local SAR Datasets
To ascertain if the variances for the different levels are equal, Levene’s homogeneity of variance tests, which do not assume normality in the underlying data, are performed. The p-values obtained for SAR1g are 0.591 (body coil type), 0.224 (HBM type), and 0.480 (landmark positions). The p-values obtained for SAR10g are 0.952 (body coil type), 0.186 (HBM type), and 0.899 (landmark positions). These p-values indicate that the null hypothesis of equal variances cannot be rejected at a significance level of 0.05. Thus, the basic requirement of equal variances in the ANOVA tests is fulfilled. The p-values in the ANOVA tests in Table 5 indicate that the human body model type has a statistically significant (p<0.05) effect on the resultant means of peak SAR1g and SAR10g quantities, separately. The MANOVA results indicate that the HBM type has a significant effect on both peak SAR1g and SAR10g. Separate ANOVA tests for SAR1g and SAR10g indicate that the landmark position does not have a statistically significant effect on the local SAR quantities However, the MANOVA test (p=0.039) indicates that landmark position does have a statistically significant impact on the combined SAR1g and SAR10g quantities. The much higher p-values for the body coil type in the ANOVA and MANOVA tests provide stronger evidence that the coil type does not have a statistically significant impact on the peak SAR1g and/or SAR10g quantities, at least for the two coils studied here. All inferences on statistical significance based on the ANOVA and MANOVA tests remain unchanged after the application of a Bonferroni adjustment to account for multiple comparisons.
Discussion
Consistent with previous reports (14,15,19), our results highlight that local SAR (SAR1g and SAR10g) can be significantly higher than global average SAR. In all our experiments, the global average SAR values are normalized to 2.0 W/kg, which is the IEC’s six-minute time-averaged whole body SAR limit in normal scan mode. In Tables 1 and 2, the normalized peak SAR values are larger than the global SAR limit (2 W/kg) by factors ranging from 16.2 to 62.8 for SAR1g (i.e., maximum and minimum values in Table 1 ÷ 2.0 W/kg), and 7.8 to 44.1 for SAR10g (i.e., maximum and minimum values in Table 2 ÷ 2.0 W/kg). While IEC recommendations do allow for higher short-term local SAR limits than global average SAR limits (SAR10g averaged over 10 secs cannot exceed 20.0 W/kg for head and trunk, and, 40.0 W/kg for extremities in normal scan mode), our results, obtained by covering a larger set of scenarios than previously investigated, indicate that local SAR can be relatively high in some cases. It is possible that some of these high peak local SAR scenarios may result in tissue damage to the subject, particularly in cases where the hot spots are located in deep regions of the body. In such situations, the patient may experience an unfamiliar dull pain for an extended period of time before alerting the scan operator of the potential danger.
Since it is highly challenging to measure local SAR values in real time, our results highlight, yet again, the importance of EM simulations in deciding safety factors for each patient/landmark position/body coil combination. In practice, such safety evaluations may take the form of extensive simulations covering a matrix of possible scenarios (similar to the one described in this paper) prior to the introduction of a body coil, and the selection of a SAR de-rating factor, which would render all clinically relevant situations (landmark position/HBM type) safe. Alternatively, a per-patient simulation may be performed at the beginning of each scan with fast numerical methods (20) to yield a global average SAR safety factor for a specific body coil, landmark position, and patient anatomy to mitigate the risk of encountering high peak local SAR. While the first approach may be easier to implement, the observation of just a few high peak local SAR scenarios, e.g., NAOMI heart-centric position in HPBC or TEM coil, may lead one to set a conservative (low) global average SAR limit for the coil. This may force the use of longer RF pulses and scan times, and thus, unnecessarily slow down scans for a large numbers of subjects. Note that our study cannot predict the local SAR cutoff limit with respect to when tissue damage will occur. In effect, it is temperature rise that causes tissue damage, not local SAR. For example, higher local SAR values in a highly vascularized region are less dangerous than lower local SAR values in less perfused regions.
Among the factors studied (body coil type, landmark position, and subject type), only the subject type impacts local SAR in a statistically significant manner in both the ANOVA and MANOVA tests. The different subject types have different sizes, tissue morphologies, geometries, hand positions, tissue types, etc. For any given landmark position and coil type, however, there is a large variation in the peak local SAR values and their locations across the different HBMs (Tables 1 to 4 and Figs. 2 to 7). As shown in Fig. 8b, the NAOMI model consistently has the highest SAR10g values for most of the simulations; this was due to the fact that, among all HBMs, her hands were closest to the rungs. In fact, when the local SAR data for NAOMI is removed from the ANOVA tests, one finds that the p-values for the landmark parameter reduces to 0.251 and 0.127 for SAR1g and SAR10g, respectively (but remain not statistically significant). The p-values for the SAR1g and SAR10g ANOVA tests for the HBM type increase slightly to 0.04 and 0.065, respectively. The ANOVA tests’ p-values for the body coil type are reduced but remain not statistically significant in predicting the level of peak local SAR (p-values are 0.181 and 0.087 for SAR1g and SAR10g, respectively). It is, however, not justifiable to remove NAOMI as a data outlier since NAOMI fits within the patient space of the body coils, and illustrates a scenario that can be encountered in the clinic. It is one’s goal to ensure the safety of all subjects to be scanned, and not just the safety of the average subject to be scanned. Consequently, due to its much higher incidences of high peak local SAR, it may be useful to include the NAOMI HBM or similarly positioned body models in any repertoire of HBMs used for body coil safety evaluations.
There is no statistical evidence to suggest that the TEM or HPBC coils studied here consistently yielded worse local SAR values across all HBMs. Note that these two body coils have dimensions that are based on typical coils and are not identical in size, i.e., similar diameters but different rung lengths. Despite the lack of observable trends in local SAR values across these two body coils, it is clear that several qualitative HBM factors consistently increased peak local SAR. As seen in the NAOMI HBM in the TEM and HPBC coils, proximity to rung elements and capacitors will subject the body to high levels of inductive and conservative E-fields, which increase SAR significantly. Another well-known source of high local SAR are the points of contact of body parts or external apparatus that form current loops, as observed in the hands of the visible man model in Fig. 5. This phenomenon can be averted with proper patient monitoring and the use of electrically insulating materials to break these current loops. Another cause of high local SAR is the peak E-field observed at the edge of tissues with dielectric constants or electrical conductivities that differ significantly, e.g., muscle-fat/bone, skin-fat interfaces. For example, the hot spot in the upper-left back of the NORMAN HBM in the TEM coil (Table 3) lies on a sliver of fat (σ=0.04 S/m, εr=5.92) surrounded by muscle (σ=0.72 S/m, εr=65.51).
In conclusion, it has been shown that peak local SAR values vary significantly across the four human body models, with the NAOMI model showing significantly higher local SAR values in most simulations. There is also a trend for the head and heart landmarks to yield higher local SAR values than the pelvic-centric landmark. There is no statistical evidence that the body coil type has any effect on the peak local SAR values, at least for the two body coils considered in this work. Thus, peak local SAR studies evaluating the safety of MR transmit coils need to consider a diverse range of human body models and landmark positions (including models like NAOMI) to ensure the safety of all MRI exams.
Fig. 6.
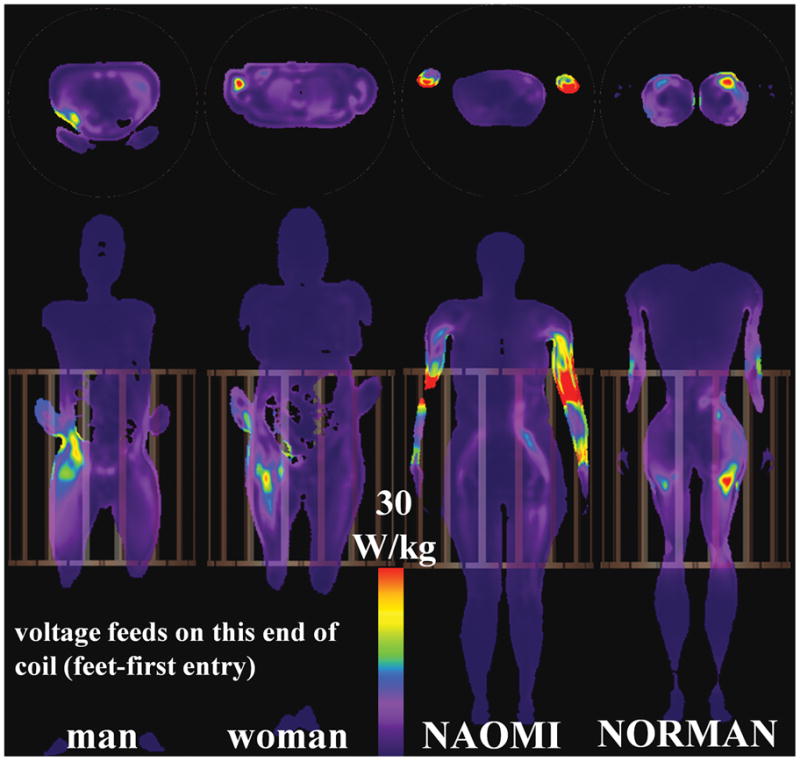
Axial (top) and coronal (bottom) slices showing maximum SAR10g for HBMs in HPBC coil at pelvic-centered landmark position.
Acknowledgments
The authors would like to thank Dr. Christopher Collins and Dr. Peter Dimbylow for providing the human body models.
This work was funded in part by NIH grant R01EB005307.
References
- 1.Brix G, Reinl M, Brinker G. Sampling and evaluation of specific absorption rates during patient examinations performed on 1.5-Tesla MR systems. Magn Reson Imag. 2001;19:769–779. doi: 10.1016/s0730-725x(01)00395-2. [DOI] [PubMed] [Google Scholar]
- 2.IEC. Particular requirements for the basic safety and essential performance of magnetic resonance equipment for medical diagnosis. 3. 2010. IEC 60601-2-33. [Google Scholar]
- 3.Brix G, Seebass M, Hellwig G, Griebel J. Estimation of heat transfer and temperature rise in partial-body regions during MR procedures: An analytical approach with respect to safety considerations. Magn Reson Imag. 2002;20:65–76. doi: 10.1016/s0730-725x(02)00483-6. [DOI] [PubMed] [Google Scholar]
- 4.Van den Bergen B, Van den Berg CAT, Bartels LW, Lagendijk JJW. 7 T body MRI: B1 shimming with simultaneous SAR reduction. Phys Med Biol. 2007;52:5429–5441. doi: 10.1088/0031-9155/52/17/022. [DOI] [PubMed] [Google Scholar]
- 5.Hoult DI. Sensitivity and power deposition in a high-field imaging experiment. Jour Magn Reson Imag. 2000;12:46–67. doi: 10.1002/1522-2586(200007)12:1<46::aid-jmri6>3.0.co;2-d. [DOI] [PubMed] [Google Scholar]
- 6.Ibrahim TS, Lee R, Baertlein A, Abduljalil AM, Zhu H, Robitaille PL. Effect of RF coil excitation on field inhomogeneity at ultra high fields: a field optimized TEM resonator. Magn Reson Med. 2001;19:1339–47. doi: 10.1016/s0730-725x(01)00404-0. [DOI] [PubMed] [Google Scholar]
- 7.Katscher U, Börnert P, Leussler C, Van den Brink JS. Transmit SENSE. Magn Reson Med. 2003;49:144–150. doi: 10.1002/mrm.10353. [DOI] [PubMed] [Google Scholar]
- 8.Zhu Y. Parallel excitation with an array of transmit coils. Magn Reson Med. 2004;51:775–784. doi: 10.1002/mrm.20011. [DOI] [PubMed] [Google Scholar]
- 9.Katscher U, Voigt T, Findeklee C, Vernickel P, Nehrke K, Dössel O. Determination of electric conductivity and local SAR via B1 mapping. IEEE Trans Med Imag. 2009;28:1365–74. doi: 10.1109/TMI.2009.2015757. [DOI] [PubMed] [Google Scholar]
- 10.Collins CM, Smith MB. Calculations of B1 distribution, SNR, and SAR for a surface coil adjacent to an anatomically-accurate human body model. Magn Reson Imag. 2001;45:692–699. doi: 10.1002/mrm.1092. [DOI] [PubMed] [Google Scholar]
- 11.Liu W, Collins CM, Smith MB. Calculations of B1 distribution, specific energy absorption rate, and intrinsic signal-to-noise ratio for a body-size birdcage coil loaded with different human subjects at 64 and 128 MHz. Appl Magn Reson. 2005;29:5–18. doi: 10.1007/BF03166953. [DOI] [PMC free article] [PubMed] [Google Scholar]
- 12.Mao W, Wang Z, Smith MB, Collins CM. Calculation of SAR for transmit coil arrays. Concept Magn Reson B. 2007;31B:127–131. doi: 10.1002/cmr.b.20085. [DOI] [PMC free article] [PubMed] [Google Scholar]
- 13.Vaughan JT, Adriany G, Snyder CJ, Tian J, Thiel T, Bolinger L, Liu H, DelaBarre L, Ugurbil K. Efficient high-frequency body coil for high-field MRI. Magn Reson Med. 2004;52:851–859. doi: 10.1002/mrm.20177. [DOI] [PubMed] [Google Scholar]
- 14.Reza S, Vijayakumar S, Limkeman M, Huang F, Saylor C. SAR simulation and the effect of mode coupling in a birdcage resonator. Concepts in Magn Reson Part B. 2007;31:133–139. [Google Scholar]
- 15.Wang Z, Lin JC, Mao W, Liu W, Smith MB, Collins CM. SAR and temperature: simulations and comparison to regulatory limits for MRI. Jour Magn Reson Imag. 2007;26:437–441. doi: 10.1002/jmri.20977. [DOI] [PMC free article] [PubMed] [Google Scholar]
- 16.Bridges JF. Cavity resonator with improved magnetic field uniformity for high frequency operation and reduced dielectric heating in NMR imaging devices. 4751464. US Patent. 1988
- 17.Dimbylow PJ. Induced current densities from low-frequency magnetic fields in a 2 mm resolution, anatomically realistic model of the body. Phys Med Biol. 1998;43:221–230. doi: 10.1088/0031-9155/43/2/001. [DOI] [PubMed] [Google Scholar]
- 18.Dimbylow P. Development of the female voxel phantom, NAOMI, and its application to calculations of induced current densities and electric fields from applied low frequency magnetic and electric fields. Phys Med Biol. 2005;50:1047–1070. doi: 10.1088/0031-9155/50/6/002. [DOI] [PubMed] [Google Scholar]
- 19.Wang Z, Yeo D, Collins CM, Jin J, Robb FJ. SAR comparison for multiple human body models at 1.5T and 3.0T. Proceedings of the ISMRM 18th Scientific Meeting; Stockholm, Sweden. 2010. (abstract 3776) [Google Scholar]
- 20.Van den Bergen B, Stolk CC, Van den Berg JB, Lagendijk JJW, Van den Berg CAT. Ultra fast electromagnetic field computations for RF multi-transmit techniques in high field MRI. Phys Med Biol. 2009;54:1253–1264. doi: 10.1088/0031-9155/54/5/010. [DOI] [PubMed] [Google Scholar]


