Abstract
Purpose
To present a novel technique for measuring tissue enhancement in breast fibroglandular tissue regions on contrast-enhanced breast MR images aimed at quantifying the enhancement of breast parenchyma, also known as “background enhancement”.
Materials and Methods
Our quantitative method for measuring breast MRI background enhancement was evaluated in a population of 16 healthy volunteers. We also demonstrate the use of our new technique in the case study of one subject classified as high risk for developing breast cancer who underwent 3 months of tamoxifen therapy.
Results
We obtained quantitative measures of background enhancement in all cases. The high-risk patient exhibited a 37% mean reduction in background enhancement with treatment.
Conclusion
Our quantitative method is a robust and promising tool that may allow investigators to quantify and document the potential adverse effect of background enhancement on diagnostic accuracy in larger populations.
Keywords: Background enhancement, breast MRI, breast density, contrast-enhanced breast MRI, breast cancer
INTRODUCTION
Magnetic Resonance Imaging is an information-rich imaging modality that produces clear anatomic representation of soft tissue and also reflects underlying tissue biology. Breast MRI is increasingly used in clinical practice both for diagnostic and screening purposes. It is particularly effective for demonstrating the extent of disease in the breast (1–2) and for detecting residual disease (3). Breast cancer diagnosis by MRI is made on the basis of differences between the level of signal enhancement between malignant lesions and benign or normal tissue following the injection of gadolinium contrast agent, and exploits the phenomena of neoangiogenesis by which tumors recruit an increased vascular supply. The 2007 guidelines issued by the NCI recommend screening patients with a 20–25% risk of breast cancer with contrast-enhanced breast MRI, and have increased the use of this modality.
MRI has been shown to be highly sensitive for breast cancer with sensitivity >90%, however the specificity levels vary (40 to 79%) depending on studies (4). Radiologic interpretation of MRI lesions considers the magnitude, shape, distribution and time course of their enhancement (5). Breast parenchyma (or “normal” breast tissue) is also known to display enhancement variations due to fluctuations in hormonal levels during the menstrual cycle (6–7). Enhancing normal breast tissue or “background enhancement” has been assessed in (8) and correlated with breast density. Background enhancement results in reduced contrast between lesion and surrounding normal tissue and makes it more difficult for cancers to be visualized (9,10).
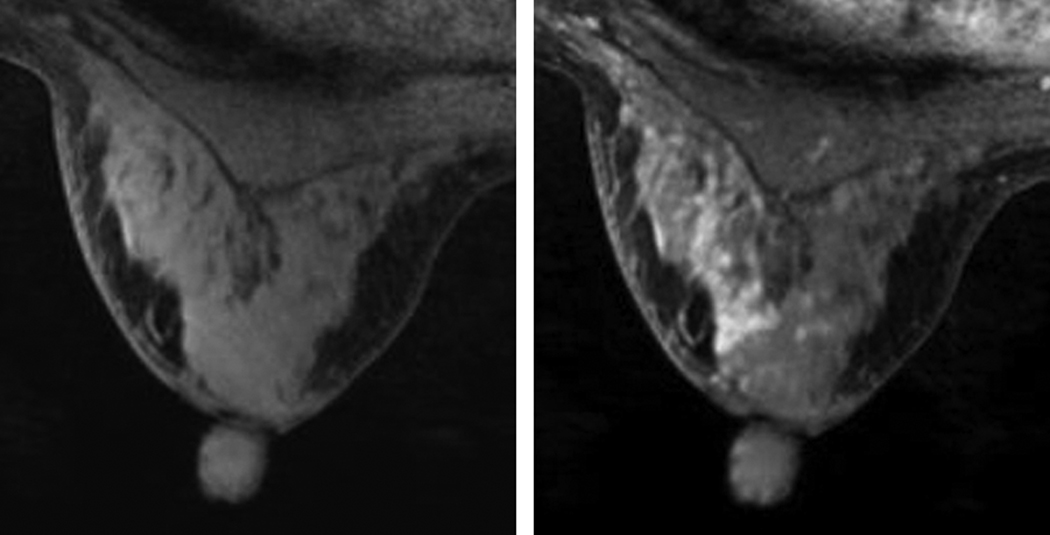
Background enhancement was shown to vary in pre- and post-menopausal women (6) and is routinely observed in clinical practice. Since it may limit clinical interpretation, this phenomenon has led to the recommendation that breast MRI not be performed during the luteal phase of the menstrual cycle when background enhancement tends to be greater (7). False positive findings due to background enhancement may also lead to unnecessary biopsies, and can influence a woman’s choice regarding mastectomy instead of breast conservation therapy. Figure 1 presents an example of background enhancement in the left breast of a 44-year old premenopausal woman with a history of biopsy proven, high-grade, right breast Ductal Carcinoma in Situ (DCIS). This woman underwent MRI guided biopsy of the left breast for suspicious enhancement; pathology determined the area of suspicious enhancement to show no breast carcinoma.
Figure 1.
Background enhancement in the left breast of pre-menopausal woman with a history of right breast DCIS. a) T1-weighted axial MR image of the left breast before contrast injection; b) first post-injection acquisition showing regions of enhancement in the breast parenchyma. Biopsy showed no breast carcinoma.
A lexicon for MR background enhancement is currently not a part of BI-RADS, but recognition of background enhancement as a factor affecting diagnostic accuracy has also led to interest in the addition of this variable to a future edition of the ACR BIRADS-MRI (11). Nonetheless, there have been no systematic studies to date documenting the adverse effects of background enhancement on diagnostic accuracy, due to the lack of robust, quantitative techniques to measure background enhancement.
We have developed quantitative techniques to measure breast tissue composition in the breast from MRI data (12). Our semi-automated segmentation technique measuring fibroglandular tissue volumes has been applied to measure volumetric density in normal and high-risk populations (13) and to quantify treatment effects in cancer patients (14). In the current study, we measured background enhancement on breast MRI data of 16 healthy premenopausal women using our novel method. We also measured the change in background enhancement in a high-risk volunteer who had undergone a 3-month treatment with tamoxifen, a selective estrogen receptor modulator (SERM).
MATERIALS AND METHODS
Healthy Volunteers
Sixteen healthy, premenopausal female volunteers were included in the study. Approval for the study was granted by our institutional review board, and all volunteers provided informed consent. Fourteen volunteers had regular, approximately 28-day, menstrual cycles while two volunteers had irregular cycles. The ages of the volunteers ranged from 21–45, with a mean age of 29 years. Each volunteer underwent a Dynamic Contrast Enhanced (DCE) MRI scan. To control for fluctuations in enhancement due to high levels of estrogen and progesterone during the luteal phase of the menstrual cycle, each MRI scan was scheduled during days 5–13 of the menstrual cycle, generally corresponding to the follicular phase. Visual reader interpretation of background enhancement was recorded from radiological reports of all patients.
Case Study: High-Risk Patient
One healthy, high risk, 41-year old premenopausal female was followed at our institution with screening MRIs after giving informed consent. Her high-risk status was defined using the following criteria:
Strong family history (Gail index 3.8%)
Very dense breast (mammographic density >75% area)
Fibrocystic disease (bilateral), clinical exam: lumpy breasts
No genetic testing was available for this patient.
This volunteer received a 3-month course of tamoxifen (20 mg per day) to potentially reduce breast density and modify enhancement levels on MRI. This volunteer was scanned with DCE-MRI prior to and following treatment.
Image Acquisition
Imaging was performed on a 1.5T GE Signa HDx Scanner (GE Healthcare, Milwaukee, WI) using a bilateral 8-channel array breast coil (Sentinelle Medical, Toronto, Canada). DCE-MRI data were acquired using a 3D T1 weighted fast gradient recalled echo pulse sequence (TR = 8.8 ms, TE = 4.3 ms, flip angle = 10°, FOV = 28–38 cm, slice thickness = 2 mm, imaging matrix = 512 × 320). The contrast agent, gadopentetate dimeglumine (Gd-DPTA) (Magnevist; Schering, Berlin, Germany) was administered at a dose of 0.1 mmol/kg body weight. Total scan time was 3.7 minutes per time point, with a pre-contrast scan and a minimum of two post-contrast time points acquired. The low order phase encoding data were acquired at the center of the scan, giving temporal sampling points of 1.8 and 5.5 minutes after injection.
Image Processing
Background enhancement quantification requires the segmentation of the fibroglandular breast tissue from surrounding tissue types. A semi-automated segmentation algorithm based on a soft Fuzzy C-Means (FCM) technique was used to measure breast tissue composition parameters such as fibroglandular and adipose volumes from non-contrast T1-weighted MRI data (12,13). This method was tested against manual delineation and classical thresholding techniques and proved to be robust and to have very low variability between users (12). Based on this segmentation, the 3D MR density, or volumetric breast density, was calculated as the ratio of fibroglandular tissue volume to the total volume of the breast.
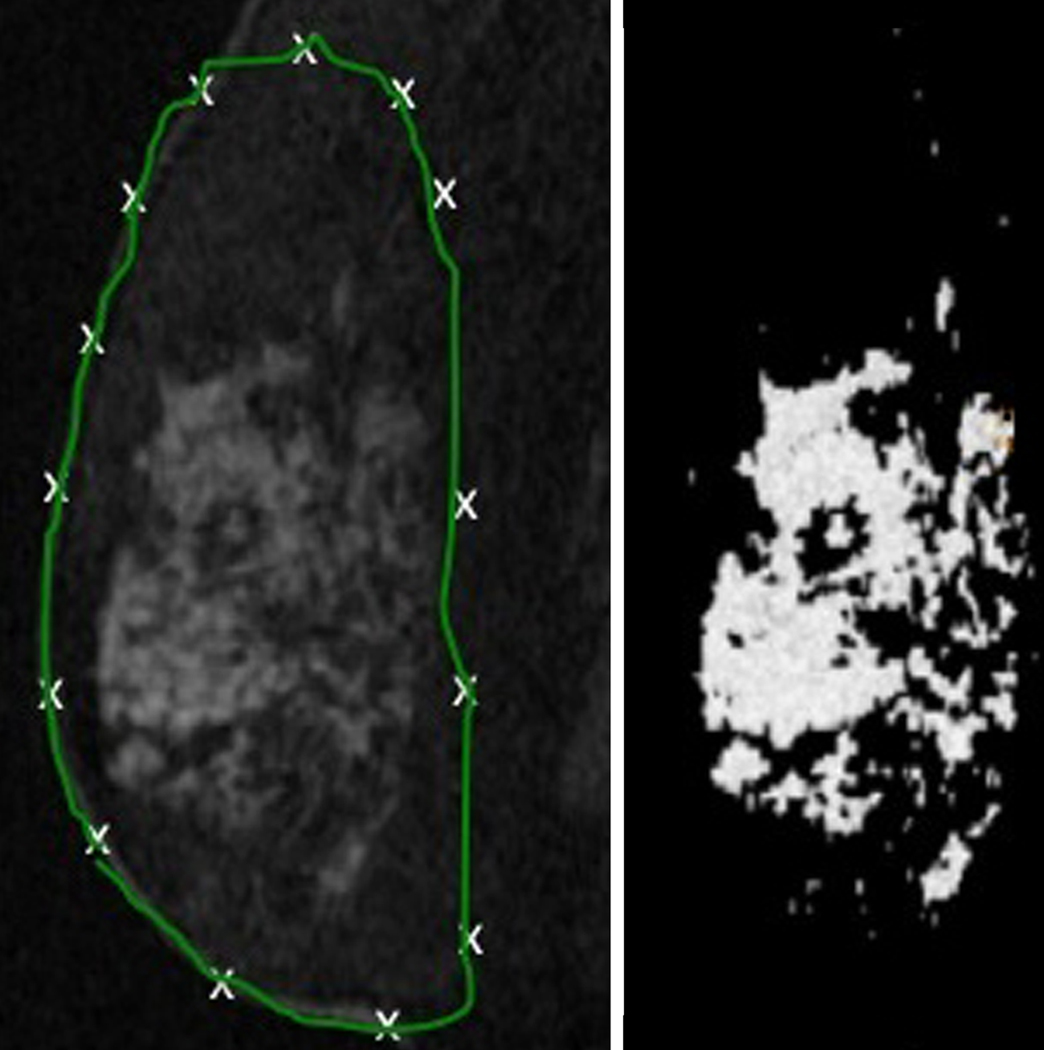
Figure 2 displays the steps involved in the quantification of breast fibroglandular volume from the original non-contrast MRI data. The user defines the full breast outline on several slices in the pre-contrast image volume by manually laying down control points for a closed b-spline contour (Figure 2(a)). Contours are then automatically interpolated to identify the entire breast volume. The technique then iteratively assigns all voxels into different tissue classifications, and the user selects the groups to be assigned to an “MR fibroglandular tissue” group. Figure 2(b) presents a typical map of fibroglandular tissue obtained through this segmentation process. The 3D map can then be used to obtain quantitative measures of fibroglandular tissue functional properties.
Figure 2.
a) Delineation of the whole breast volume from non-contrast MRI data; b) Fibroglandular tissue volume extracted from the original non-contrast MRI (a).
Using the fibroglandular tissue map, the quantification of Percent Enhancement (PE) was measured in that same volume on a voxel by voxel basis as defined in equation [1]:
| [1] |
where S1 is the signal intensity in the first post-contrast image and S0 is the signal intensity in the pre-contrast image. We obtained a global PE value representing the general enhancement of the breast parenchyma for each patient by averaging the voxel PE values over the entire tissue map.
RESULTS
Background Enhancement In Normal Volunteers
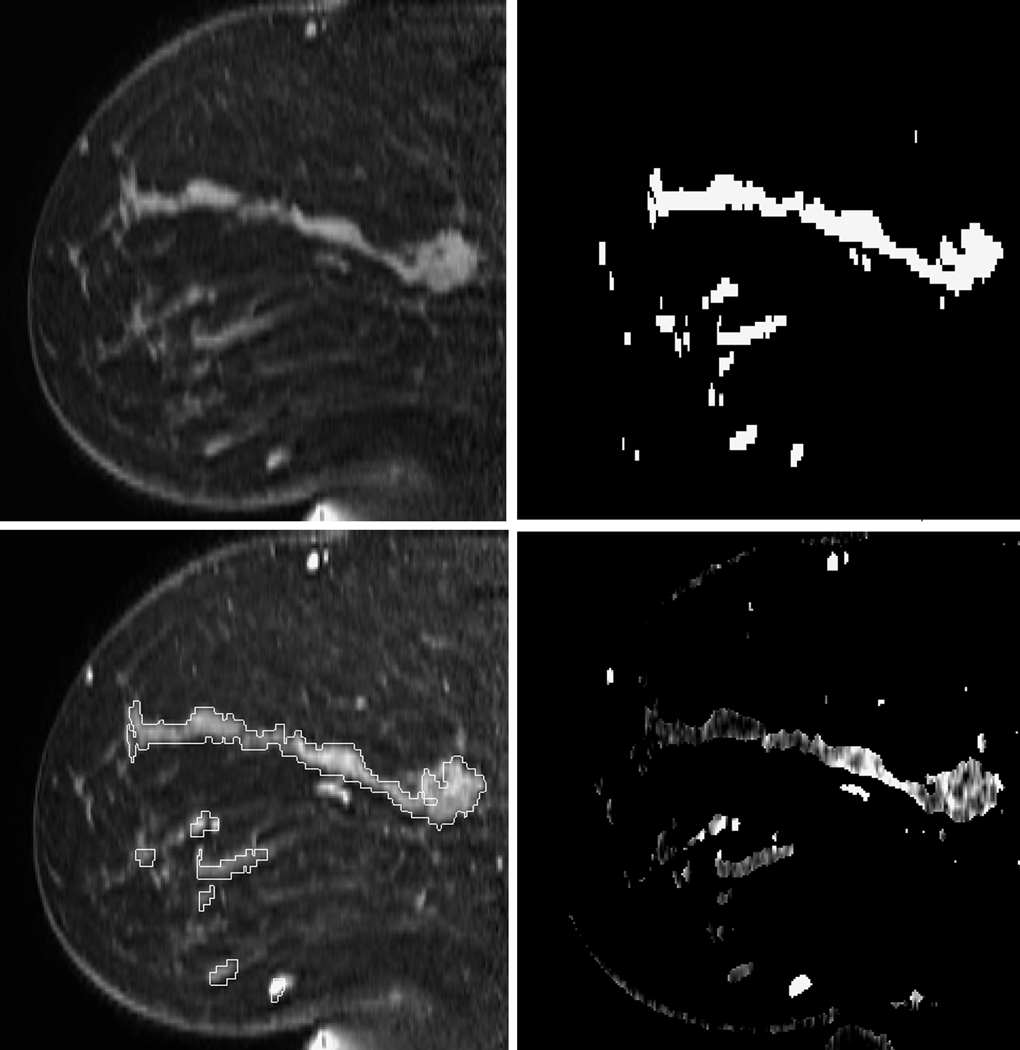
Figure 3 shows the MRI data of the normal volunteer with lowest 3D MR density, illustrating the steps of our analysis. This volunteer had a global enhancement of approximately 10%. Figures 3a and 3b show the pre contrast MRI data and the corresponding segmented breast tissue map, respectively. Figure 3c shows the post-contrast image overlaid with the regions derived from the breast tissue map, and 3d shows the PE map.
Figure 3.
Sagittal images of a normal volunteer with low 3D MR density: a) Pre-contrast; b) Segmented fibroglandular tissue; c) First post-contrast image with overlaid ROI from the tissue mask; d) PE map.
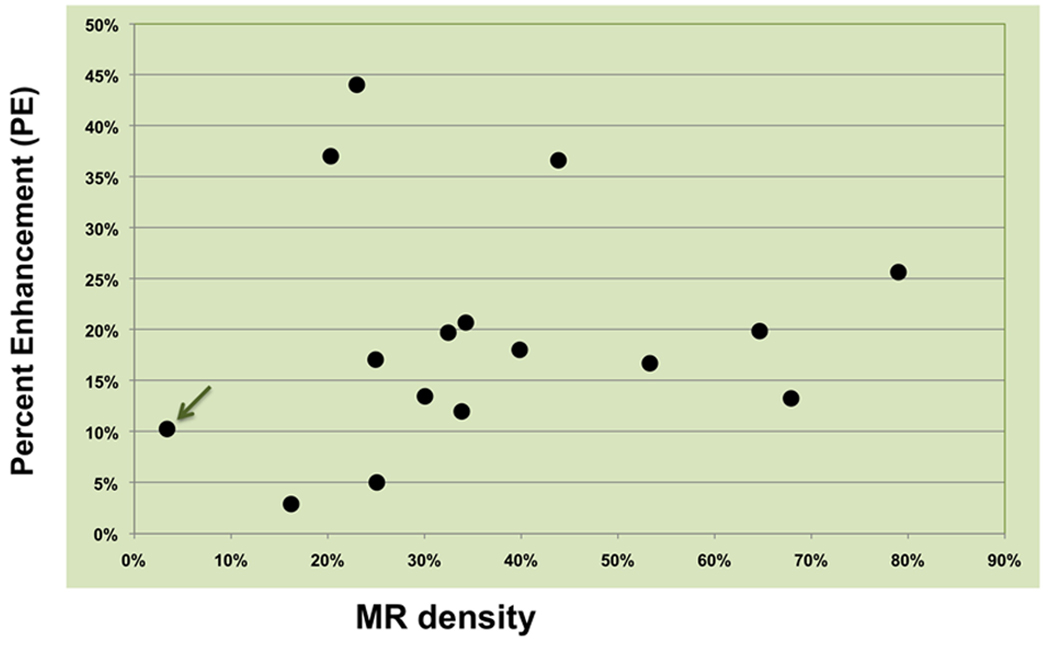
Figure 4 displays the global PE values in the 16 healthy volunteers as a function of their 3D MR density. Non-negligible enhancement values were found in all subjects. The results showed no significant correlation between MR density and enhancement levels in this normal population.
Figure 4.
Percent enhancement found at all densities in 16 healthy volunteers. The arrow indicates the volunteer whose images were used in Figure 3.
We report the visual interpretations of background enhancement obtained from the clinical reports of the 16 patients as: Minimal (4/16), Mild (7/16), Mild to Moderate (1/16) and Moderate (4/16). The range and median quantitative values obtained on these patients using our semi-automated technique were found as [7 to 35%, (median 23%)] for Minimal; [5 to 66%, (median 22%)] for Mild; 17% for Mild to Moderate; and [12 to 26%, (median 23%)] for Moderate background enhancement.
Background Enhancement Changes In A High-Risk Patient
Figure 5 presents Maximum Intensity Projections (MIP) images from the high-risk subject which show all enhancing regions projected on one plane, facilitating the visual assessment of enhancing lesions in the entire breast. Figure 5a displays the pre-treatment MIP that shows multiple regions of background enhancement in the breast; and figure 5b displays the MIP after 3 months of tamoxifen. We found a reduction in background enhancement from 26.5% to 16.1% (33% reduction) in the right breast and 20.6% to 13.8% (39% reduction) in the left breast after 3 months of treatment.
Figure 5.
Change in background enhancement in a high-risk woman who underwent 3 months of tamoxifen treatment. a) Baseline Maximum Intensity Projection (MIP) image; b) MIP after 3-month tamoxifen treatment.
DISCUSSION
Background enhancement is prevalent in DCE-MRI of the breast, and may decrease the specificity of breast DCE-MRI for detecting malignant lesions. Given the increasing utilization of DCE-MRI for breast cancer screening and assessment of treatment response, understanding the potential effects of background enhancement is an important clinical issue. To our knowledge, there are currently no robust, quantitative methods to measure background enhancement. Authors have evaluated background enhancement measures using manually selected regions of interest in the breast (15), however manual methods are inherently dependent on the subjective nature of the region determination. There is clearly a need for a more systematic quantitative measure of background enhancement suitable for clinical use.
There are a number of factors that may affect breast tissue background enhancement (7). Background enhancement is known to be higher in premenopausal women. It also varies with the phase of the menstrual cycle, with the lowest level of background enhancement found in the early days of the cycle, although there has been some variation in study findings. A limitation of our study may be that despite selecting days 5–13 of the menstrual cycle for performing the MRI scans of all volunteers, the DCE-MRIs may have been taken in different phases of the menstrual cycle for people with irregular cycles (2/16 patients in our study). In a recent study Ellis suggested the measurement of serum progesterone levels to better synchronize DCE-MRI with the follicular phase in women who do not have regular menstrual cycle (16). Monitoring hormone levels could help optimize the timing of MR examinations in the screening population. A few studies have suggested a potential correlation between background enhancement and breast density. As high breast density is a known strong factor of breast cancer risk, several authors hypothesized that dense breasts may exhibit higher levels of background enhancement, but results are mixed. While Arkani found a significant correlation between qualitative assessment of MR density and enhancement levels in his cohort of 185 normal volunteers (15), others found no correlation (17). Differences in results may also be attributed to the lack of systematic quantitative tools to assess density and enhancement levels in these studies. Some recent studies have shown that background enhancement does not to change with chemotherapy (18).
Very few studies have investigated quantitative assessment of selective estrogen-receptor modulator (SERM) treatment effects and variation of these effects among patients. SERM treatments affect growth of cancer cells by blocking estrogen in the breast. Tamoxifen has been shown to reduce the risk of ductal and recurrent invasive breast cancer, and also to reduce the risk of contralateral breast cancer. In addition, long term tamoxifen therapy was shown to mildly decrease mammographic breast density (19) however the measured changes varied among authors (20). A small study described the reduction of unspecific DCE-MRI enhancement in a very small cohort of peri- and postmenopausal women (n=10) who were given 8 weeks of tamoxifen (8). The MRIs were visually assessed in that small study.
The availability of a robust semi-automated tool to measure background enhancement in the breast could facilitate the use of tamoxifen as a much-needed short-term therapy to help reduce MRI false positive cases. As MRI is becoming more and more prevalent in screening high-risk patients and in breast cancer management, the ability to quantify normal enhancement and compare any changes to this baseline enhancement could have a huge impact on improving screening.
In addition, if breast tissue compositional and functional changes due to short-term treatment can be measured, the same technique could be used to study longer-term treatment effects. In particular it has been shown that the efficacy of long-term tamoxifen treatment efficacy decreases for certain patients after several years of treatment. Using our quantitative image analysis method on larger populations could potentially help assess when therapy has ceased to be effective in these patients to expedite the initiation of alternative therapy. Future larger studies will help test this hypothesis.
We have described our technique to measure global background enhancement in the normal breast. This technique is flexible and can also be utilized to evaluate MRI data from breast cancer patients. The segmentation allows the user to extract invasive tumor regions using the Signal Enhancement Ratio (SER) method described in (1), in order to separate these regions from the fibroglandular volume under study. Therefore two enhancement measures can be produced, a level of enhancement in the tumor and a level of enhancement in the breast parenchyma around the tumor. Another key element for application of our technique to the clinic is its simplicity of use: it uses standard clinical breast MRI data producing a pre-contrast and 2 post-contrast injection of gadolinium data.
Our results also showed that qualitative visual interpretations provided by radiologists cover a wide range of background enhancement values (as measured with our novel technique) that often overlap, due to subjectivity in readings. This indicates the need for a more objective quantitative and clinically accessible technique to quantify background enhancement.
Our preliminary quantification tool has been defined and tested using a semi-automated technique requiring significant trained user interaction, which would limit its use in the clinic. However, further automation of our technique using a coronal orientation of the MRI volumes for the breast delineation has been shown to greatly decrease the background enhancement processing time to less than 3 minutes, which could be greatly reduced with the use of specific commercial platforms in the clinic. This automation allows for the development of a background enhancement measurement tool suitable for use in clinical MRI readings.
In conclusion, we have presented our novel, semi-automated segmentation tool that provides quantitative measures of background enhancement in breast MRI with application on the MRI data of 16 normal volunteers. This is a much-needed technique that may aid clinicians better quantify and understand the effects of background enhancement on the interpretation of breast MRI. Our technique also proved to be useful to measure treatment-induced changes in background enhancement in a high-risk patient following a 3-month tamoxifen treatment. This quantitative assessment may potentially be of interest in future studies evaluating the use of short-term SERM treatments as potential means to reduce background enhancement in addition to reducing cancer risk in premenopausal women. We believe that this work holds promise to better assess breast MRI, in particular for women with the type of breast tissue which displays multiple unspecific regions of enhancement.
Acknowledgments
Grant Support: NIH R01 CA069587 (Hylton), NIH R01 CA116182 (Hylton), California Breast Cancer Research Program 13IB-0171 (Klifa)
REFERENCES
- 1.Esserman L, Hylton N, Yassa L, Barclay J, Frankel S, Sickles E. Utility of magnetic resonance imaging in the management of breast cancer: evidence for improved preoperative staging. J Clin Oncol. 1999;17(1):110–119. doi: 10.1200/JCO.1999.17.1.110. [DOI] [PubMed] [Google Scholar]
- 2.Wolmark N, Wang J, Mamounas E, Bryant J, Fisher B. Preoperative chemotherapy in patients with operable breast cancer: nine-year results from National Surgical Adjuvant Breast and Bowel Project B-18. J Natl Cancer Inst Monogr. 2001;30:96–102. doi: 10.1093/oxfordjournals.jncimonographs.a003469. [DOI] [PubMed] [Google Scholar]
- 3.Partridge SC, Gibbs JE, Lu Y, Esserman LJ, Sudilovsky D, Hylton NM. Accuracy of MR imaging for revealing residual breast cancer in patients who have undergone neoadjuvant chemotherapy. AJR Am J Roentgenol. 2002;179(5):1193–1199. doi: 10.2214/ajr.179.5.1791193. [DOI] [PubMed] [Google Scholar]
- 4.Peters NH, Borel Rinkes IH, Zuithoff NP, Mali WP, Moons KG, Peeters PH. Meta-analysis of MR imaging in the diagnosis of breast lesions. Radiology. 2008;246(1):116–124. doi: 10.1148/radiol.2461061298. [DOI] [PubMed] [Google Scholar]
- 5.American College of Radiology (ACR) Breast Imaging Atlas. 4th ed. Reston, VA: 2003. ACR Breast Imaging Reporting and Data Systems. [Google Scholar]
- 6.Delille JP, Slanetz PJ, Yeh ED, Kopans DB, Garrido L. Physiologic changes in breast MRI during the menstrual cycle: perfusion imaging, signal enhancement, and influence of the T1 relaxation time of breast tissue. Breast J. 2005;11(4):236–241. doi: 10.1111/j.1075-122X.2005.21499.x. [DOI] [PubMed] [Google Scholar]
- 7.Müller-Schimpfle M, Ohmenhaüser K, Stoll P, Dietz K, Claussen CD. Menstrual cycle and age: influence on parenchymal contrast medium enhancement in MR imaging of the breast. Radiology. 1997;203(1):145–149. doi: 10.1148/radiology.203.1.9122383. [DOI] [PubMed] [Google Scholar]
- 8.Heinig A, Lampe D, Kölbl H, Beck R, Heywang-Köbrunner SH. Suppression of unspecific enhancement on breast magnetic resonance imaging (MRI) by antiestrogen medication. Tumori. 2002;88(3):215–223. doi: 10.1177/030089160208800307. [DOI] [PubMed] [Google Scholar]
- 9.Kumar AS, Chen DF, Au A, et al. Biologic significance of false-positive magnetic resonance imaging enhancement in the setting of ductal carcinoma in situ. Am J Surg. 2006;192(4):520–524. doi: 10.1016/j.amjsurg.2006.07.003. [DOI] [PMC free article] [PubMed] [Google Scholar]
- 10.Teifke A, Hlawatsch A, Beier T, et al. Undetected malignancies of the breast: dynamic contrast-enhanced MR imaging at 1.0 T. Radiology. 2002;224(3):881–888. doi: 10.1148/radiol.2243010547. [DOI] [PubMed] [Google Scholar]
- 11.Morris EA. Diagnostic breast MR imaging: current status and future directions. Radiol Clin North Am. 2007;45(5):863–880. doi: 10.1016/j.rcl.2007.07.002. [DOI] [PubMed] [Google Scholar]
- 12.Klifa C, Carballido-Gamio J, Wilmes L, et al. Quantification of Breast Tissue Index from MR data using Fuzzy Clustering. IEEE Engineering in Medicine and Biology Society. 2004;3:1667–1670. doi: 10.1109/IEMBS.2004.1403503. [DOI] [PubMed] [Google Scholar]
- 13.Klifa C, Carballido-Gamio J, Wilmes L, Laprie A, Shepherd J, Fan B, Hylton N. Assessment of volumetric MR density in a high-risk population. Magn Reson Imaging. 2010;28(1):8–15. doi: 10.1016/j.mri.2009.05.040. [DOI] [PMC free article] [PubMed] [Google Scholar]
- 14.Klifa C, Newitt D, Gibbs J, Hattangadi J, Orisamolu A, Hylton N. Quantitative MRI assessment of uninvolved breast tissue in patients with locally-advanced breast cancer undergoing neoadjuvant chemotherapy. San Antonio Breast Cancer Conference. 2008 [Google Scholar]
- 15.Arkani S, Newstead GM, Chen V, et al. Parenchymal Enhancement on Breast MRI May be a Marker for Cancer Risk: Correlation of Parenchymal Enhancement with Breast Density. San Antonio Breast Cancer Research Conference. 2006 [Google Scholar]
- 16.Ellis RL. Optimal timing of breast MRI examinations for premenopausal women who do not have a normal menstrual cycle. AJR Am J Roentgenol. 2009;193(6):1738–1740. doi: 10.2214/AJR.09.2657. [DOI] [PubMed] [Google Scholar]
- 17.Cubuk R, Tasali N, Narin B, Keskiner F, Celik L, Guney S. Correlation between breast density in mammography and background enhancement in MR mammography. Radiol Med. 2010;115(3):434–441. doi: 10.1007/s11547-010-0513-4. [DOI] [PubMed] [Google Scholar]
- 18.Siegmann KC, Muller KT, Vogelz U, Krauss K, Claussen CD. MR Imaging of the Breast Before and After Neoadjuvant Treatment - Enhancement Characteristics and T2 Signal Intensity of Breast Cancers and Breast Parenchyma. Rofo. 2010;182(6):493–500. doi: 10.1055/s-0028-1109883. [DOI] [PubMed] [Google Scholar]
- 19.Cuzick J, Warwick J, Pinney E, Warren RM, Duffy SW. Tamoxifen and breast density in women at increased risk of breast cancer. J. Natl Cancer Inst. 2004;96(8):621–628. doi: 10.1093/jnci/djh106. [DOI] [PubMed] [Google Scholar]
- 20.Jordan VC. The Paradoxical actions of estrogen in breast cancer - survival or death? J Clin Oncology. 2008;26(18):3073–3082. doi: 10.1200/JCO.2008.17.5190. [DOI] [PubMed] [Google Scholar]


