

Abstract
BACKGROUND AND PURPOSE
Teratogenic substances induce adverse effects during the development of the embryo. Multilineage differentiation of human embryonic stem cells (hESCs) mimics the development of the embryo in vitro. Here, we propose a transcriptomic approach in hESCs for monitoring specific toxic effects of compounds as an alternative to traditional time-consuming and cost-intensive in vivo tests requiring large numbers of animals. This study was undertaken to explore the adverse effects of cytosine arabinoside (Ara-C) on randomly differentiated hESCs.
EXPERIMENTAL APPROACH
Human embryonic stem cells were used to investigate the effects of a developmental toxicant Ara-C. Sublethal concentrations of Ara-C were given for two time points, day 7 and day 14 during the differentiation. Gene expression was assessed with microarrays to determine the dysregulated transcripts in presence of Ara-C.
KEY RESULTS
Randomly differentiated hESCs were able to generate the multilineage markers. The low concentration of Ara-C (1 nM) induced the ectoderm and inhibited the mesoderm at day 14. The induction of ectodermal markers such as MAP2, TUBB III, PAX6, TH and NESTIN was observed with an inhibition of mesodermal markers such as HAND2, PITX2, GATA5, MYL4, TNNT2, COL1A1 and COL1A2. In addition, no induction of apoptosis was observed. Gene ontology revealed unique dysregulated biological process related to neuronal differentiation and mesoderm development. Pathway analysis showed the axon guidance pathway to be dysregulated.
CONCLUSIONS AND IMPLICATIONS
Our results suggest that hESCs in combination with toxicogenomics offer a sensitive in vitro developmental toxicity model as an alternative to traditional animal experiments.
Keywords: embryonic stem cells, developmental toxicity, drug safety and toxicology, drug discovery, toxicogenomics, bioinformatics
Introduction
Embryonic stem cells (ESCs) are pluripotent cells that can be differentiated into endodermal, mesodermal and ectodermal lineages. Developmental processes occurring during embryogenesis in vivo can be at least partly recapitulated by the use of cultured ESCs in vitro[see (Desbaillets et al., 2000; Gissel et al., 2005) ]. Progressive development in embryoid bodies (EBs) leading to the formation of tissue-specific cells is controlled by differential gene expression, by apoptosis, intercellular communication and cell-matrix interactions (Desbaillets et al., 2000; Gissel et al., 2005). Similar to the totipotent cells of the blastocyst inner cell mass, gene expression and morphological changes of the cultured ESCs occur hierarchically, first developing epiblast cells, then germ layers and finally somatic cells. Progressive differentiation of human ESCs (hESCs) is coordinated by multiple gene groups that are involved in biological processes such as cell proliferation and cell death. A balance between these mechanisms is essential for normal embryonic development in vivo[for review see (Hipfner and Cohen, 2004) ]. In vitro models combined with appropriate experimental protocols allow the identification of genes participating in developmental processes in vivo (Gissel et al., 2005; Doss et al., 2007a,b;).
Recently, it has been recognized that hESCs are not only promising for a potential cell therapy of degenerative diseases but that they can also be applied for toxicological in vitro assays during drug development. In particular, the combination of hESCs and -omics technologies is extremely promising as a model system for toxicology since at every time point of differentiation, thousands of genes are differentially expressed, thereby significantly increasing the probability of identifying sensitive mRNA or protein markers of toxicity. We propose that a toxicogenomics approach using hESCs will provide a cost-effective and timely efficient platform for drug discovery.
Cytosine arabinoside (Ara-C), a drug for the treatment of haematological malignancies such as lymphoblastic leukaemias (Hensley et al., 2000), is transported into susceptible cells and phosphorylated to the mono-, di- and triphosphates. AraCTP is a specific competitive inhibitor of DNA polymerases, competing with dCTP (Cohen, 1976). More than two decades ago, developmental defects caused by Ara-C were reported in mice and rats (Karnofsky and Lacon, 1966; Chaube et al., 1968; Percy and Albert, 1974). In addition, the embryonic stem cell test embryotoxicity prediction model classifies Ara-C as a strong embryotoxicant (Buesen et al., 2009). In the present proof of principle study, to predict the mechanism of toxicity of Ara-C in hESC embryonic development, the toxicant was given during hESC embryoid body development (multilineage differentiation) using DNA microarrays. The multilineage differentiation of hESC mimics the human embryonic development in terms of expressing endoderm, ectoderm and mesoderm lineage markers. We show here that treatment of hESCs with 1 nM Ara-C during multilineage differentiation through forced aggregation till day 14 induces specifically the expression of a group of genes participating in the process of neurogenesis and inhibits mesoderm-related transcripts. Effects on neurogenesis have been confirmed by monitoring the appearance of neurons after treatment of the hESCs with Ara-C.
Methods
hESC cell culture conditions and differentiation
H9 hESCs (WiCell, Madison, WI, USA) were cultured and passaged with mechanical dissociation on irradiated mouse embryonic fibroblasts in knockout (KO)-DMEM-F12, 20% KO serum replacement, 1% non-essential amino acids, penicillin (100 units·mL−1)/streptomycin (100 µg·mL−1), 0.1 mM β-mercaptoethanol supplemented with 4 ng·mL−1 basic fibroblast growth factor (bFGF). Prior to random differentiation, cells were maintained for 5 days on hESC-qualified matrix (BD Biosciences, Bedford, MA, USA)-coated 60 mm tissue culture plates (Nunc, Langenselbold, Germany). Cultures were passaged and maintained in feeder-free conditions with conditioned medium (Xu et al., 2001) supplemented with 8 ng·mL−1 bFGF. Prior to multilineage differentiation, pre-differentiated hESC were removed manually from the culture, cells were washed with phosphate-buffered saline (PBS) and fresh medium was added. To obtain uniformly sized clumps, the EZ-passage tool (Invitrogen, Darmstadt, Germany) was used to cut hESC colonies into small clumps. For multilineage differentiation, EBs were formed (Burridge et al., 2007; Ungrin et al., 2008) in the above-mentioned H9 hESC culture medium without bFGF referred to as differentiation medium. 50–60 hESC clumps, each clump containing approximately 100–150 cells, were added onto 5% pluronic-F127 (Sigma, Steinheim, Germany)-coated V-bottom 96-well tissue culture grade plates and centrifuged. The clumps were centrifuged at 400×g for 4 min at 4°C. On day 4, EBs were picked manually transferred to pluronic (5%) coated bacteriological dishes. Each V-bottom 96-well plate yielded approximately 70–80 EBs. The EBs were maintained for 14 days on a horizontal shaker in respective medium (Figure 1A).
Figure 1.
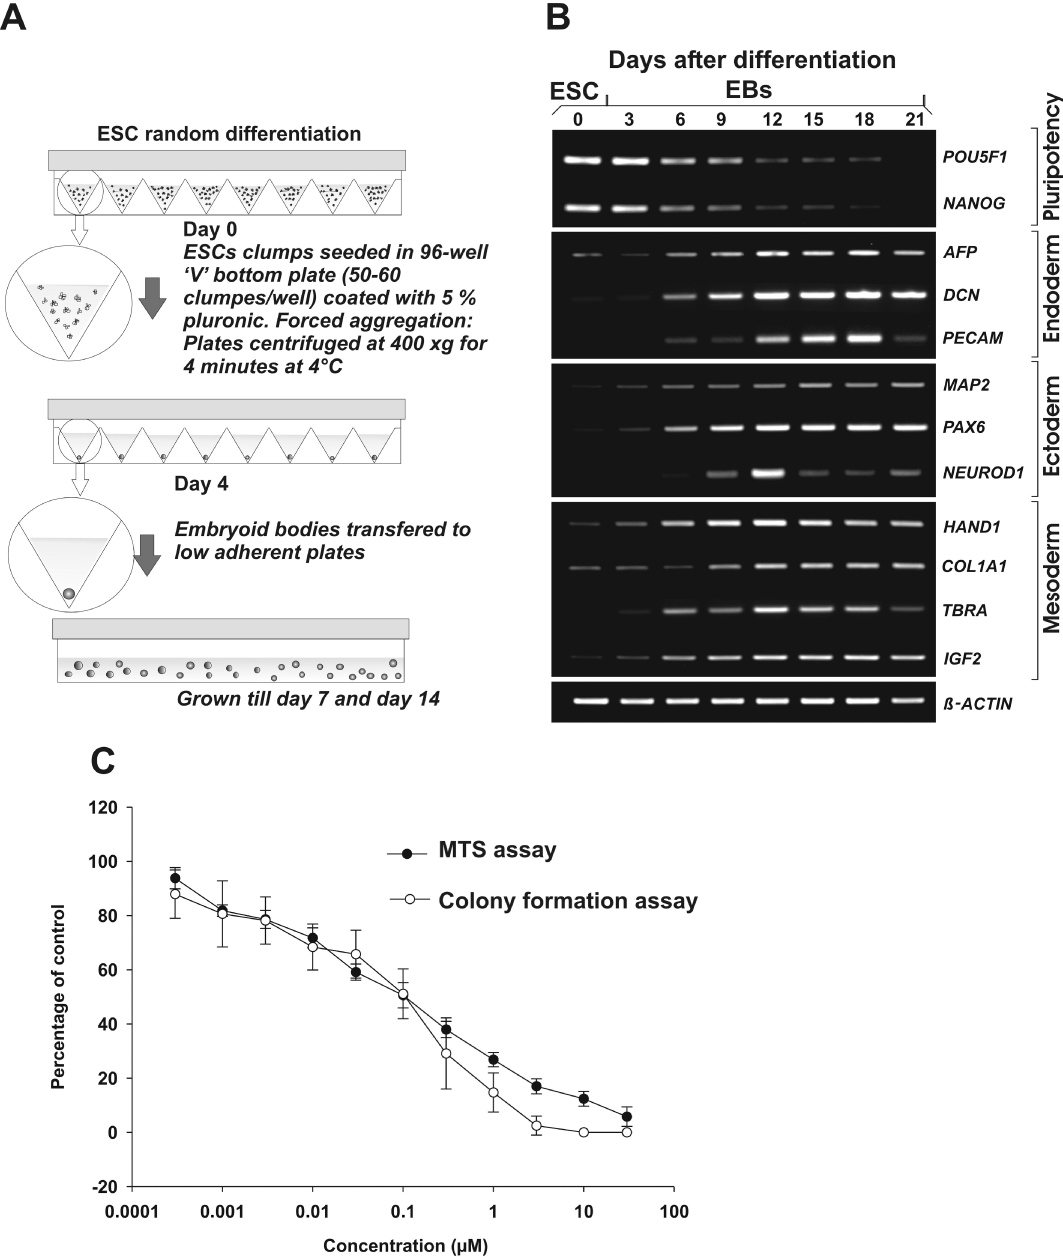
Random differentiation protocol in the presence and absence of cytosine arabinoside (Ara-C). A, method of embryoid body (EB) formation with forced aggregation. B, the random differentiation of human embryonic stem cells (hESC) derived EBs expressing germ layer markers during the time course analysis. C, to determine the dose-response curve for Ara-C, hESC cultures were exposed to toxicants for 5 days. The MTS end point is determined by development of formazan. In the colony formation assay, viability was determined by inhibition of colony forming ability with treatment compared with control.
For treatment, Ara-C (Sigma, Steinheim, Germany) was added on day 0 in the medium, and vehicle was added to controls. Every alternate day, medium was replaced completely with fresh medium containing drug.
Semi-quantitative reverse transcription polymerase chain reaction (RT-PCR)
To follow the course of embryonic development, a time-course analysis for multilineage differentiation was performed. hESCs were randomly differentiated as described in Figure 1A, and samples were collected for day 0, 3, 6, 9, 12, 15, 18 and 21 for RT-PCR analysis. Total RNA was isolated from mentioned samples using RNeasy mini kit (Qiagen, Hilden, Germany) according to the manufacturer's guidelines. cDNA synthesis was performed with Super Script Vilo (Invitrogen, Carlsbad, CA, USA) cDNA synthesis kit using 1 µg of total RNA as starting material. cDNA was diluted 10 times with nuclease-free water, and 2 µL was used as a template for PCR. Primer design was performed using Primer3 (Rozen and Skaletsky, 2000). Semi-quantitative PCR was performed using Dreamtaq Polymerase master mix (Fermentas, Germany), 0.5 µM concentration of forward and reverse primers, and 2 µL of cDNA template. A thermocycler (Bio-Rad, Munich, Germany) was used for PCR reaction, with the following conditions: denaturation at 95°C/2 min, 22 cycles for β-ACTIN and 35 cycles for target genes, of 95°C/30 s denaturation, 60°C/30 s annealing 72°C/60 s of elongation. The PCR products were separated by electrophoresis on 1.5% agarose gels with (0.5 µg·mL−1) ethidium bromide against a 100 base pair ladder. β-Actin was used as an endogenous control. PCR primer sequences are listed in Table S1.
Cell viability assay
The cytotoxicity assay was performed as described by Adler et al. (2008) with modifications using CellTiter 96® AQueous Non-Radioactive Cell Proliferation Assay (MTS, Promega, Mannheim, Germany). H9 hESC colonies cultured on hESC-qualified matrix (BD Biosciences, California, USA) were dissociated using StemPro® accutase (Invitrogen, Carlsbad, CA) and single cells were counted in a Neubauer chamber. Ninety-six-well cell culture tested flat bottom plates (Nunc, Langenselbold, Germany) were coated with hESC-qualified matrix (BD Biosciences, California, USA) and 2.5 × 10³ single-cell hESCs were seeded per well using mTESR (Stemcell Technologies, Grenoble, France) medium, supplemented with 8 ng·mL−1 bFGF (PeproTech Inc, Rocky Hill, NJ, USA) (Desbordes et al., 2008). After 48 h, medium was removed completely and fresh medium containing Ara-C (0.003 µM to 30 µM) was added. In control wells, 0.1% of dimethyl sulphoxide (DMSO) was added as a vehicle control. Three days later, 20 µL of CellTiter 96® AQueous MTS and phenazine methosulphate (Sigma, Steinheim, Germany) solution was added to the medium as per the manufacturer's instructions. After 1–2 h incubation at 37°C the absorbance was measured with a TECAN spectrophotometer at 490 nm. The study was performed in three independent experiments. The drug concentration at which 50% and 10% inhibition of cell growth was observed, were determined as IC50 and IC10 values respectively.
To determine cytotoxicity, a colony formation assay was performed (Kreja and Seidel, 2002). Approximately 150 mechanically disrupted (Lerou et al., 2008) clumps were seeded on matrix-coated (BD Biosciences, California, USA) tissue culture grade six-well dishes as described before. After 48 h, medium was removed and fresh medium containing test substances was added. Ara-C was used in eight different concentrations (0.003 µM to 30 µM). Zero point one per cent of DMSO was added as a vehicle control. Every alternate day medium was refreshed. On day 7 colonies were fixed with methanol for 15 min and 1% aqueous crystal violet solution was added for 10 min at room temperature. Plates were washed six times with water and colonies were counted manually. Numbers of colonies were counted in triplicate and colony growth was calculated relative to control wells. IC50 values derived from concentration at 50% and IC10 values derived from 10% inhibition of colony formation.
Microarray hybridization
Total RNA was extracted from undifferentiated hESCs and EBs (Figure 1A) from three independent experiments. Throughout EB formation, cells were treated with Ara-C (1 nM) and control was treated with DMSO till day 14. Samples were harvested on day 0 for undifferentiated hESCs, day 7 and day 14 for differentiated EBs from control and treated sets. Samples were homogenized with Trizol (Invitrogen, Darmstadt, Germany) and RNA was extracted using Trizol and isopropanol (Sigma, Steinheim, Germany). The total RNA was purified using RNeasy minelute cleanup kit (Qiagen, Hilden, Germany) according to the manufacturer's instructions. Nanodrop (ND-1000, Thermo-Fisher, Langenselbold, Germany) was used for quantification and the quality of RNA was determined by denaturing agarose gel electrophoresis. Whole-genome Expression Illumina Human HT-12 BeadChip arrays (Illumina, Inc, San Diego, CA, USA) were used for expression profiling. For in vitro transcription and cRNA labelling 100 ng of total RNA was used as template and processed using Illumina TotalPrep RNA Amplification Kit (Ambion, Austin, TX, USA) according to the manufacturer's instructions. A total of 750 ng of cRNA was hybridized to each array for 16 h according to the Illumina hybridization protocol. After hybridization arrays were washed, dried and scanned using the Illumina bead station. Illumina BeadStudio was used to collect the raw data of Illumina BeadChip Arrays.
Data analysis and statistical procedures
The raw dataset was normalized with Quantile normalization method executable with R Bioconductor (Bolstad et al., 2003). To identify differentially expressed genes, a linear model was implemented using R and the LIMMA package (Smyth, 2004). F Statistic was applied to determine the differentially expressed transcripts (DET). The raw P-values were adjusted by Benjamini Hochberg procedure for controlling the false discovery rate (P≤ 0.05) at probe level. Besides the above-mentioned conditions, fold change value with the threshold value ≥±2.0 was used to filter the significantly expressed transcripts.
Gene expression and functional annotation analysis
Hierarchical clustering analysis of the differential expressed transcripts has been performed using uncentred correlation and average linkage (Eisen et al., 1998) and was displayed using JAVA tree view (Saldanha, 2004). To further investigate the differentially expressed genes, functional annotation and gene ontology (GO) clustering in Database for Annotation, Visualization and Integrated Discovery was used (Dennis et al., 2003). These analyses explore the biological process functional annotations for DET derived from control 7 days and 14 days untreated (control) EBs and Ara-C treatment. To derive the biological impact, dysregulation of significant genes were annotated based on EASE score enrichment P-value (P≤ 0.01) (Hosack et al., 2003) and clustering stringency at medium level according to Database for Annotation, Visualization and Integrated Discovery.
Quantitative real time PCR
In independent experiments, EBs were formed and treated with Ara-C at concentrations of 0.5, 1 and 5 nM), and saccharin (1 nM). Total RNA and cDNA were obtained as mentioned in the previous section. Mesa green (Eurogentec, Seraing, Belgium) assay was accomplished with Applied Biosystems 7500 FAST cycler. All the genes were normalized to the reference β-actin. The mRNA levels were calculated using a relative quantiation using cycle threshold (ct) method.
Immunoblotting
In separate experiments, EBs were formed as per Figure 1A and treated with Ara-C (1 nM). On day 5, EBs were transferred on gelatine-coated six-well plates (Nunc, Langenselbold, Germany). On day 12, EBs were dissociated with 0.01% collagenase for 45 min and plated on fibronectin-coated glass slips (Sigma, Steinheim, Germany). On day 14, EBs were fixed with 4% paraformaldehyde for 15 min and permeabilized with PBS-TritonX-100. Blocking was performed with 5% bovine serum albumin for 1 h. Samples were incubated overnight at 4°C with primary antibodies to TH (Gene Tex Inc., Irvine, CA, USA), NESTIN (Sigma, Steinheim, Germany), PAX6 (Sigma, Steinheim, Germany), MAP2 (Cell Signaling Technology Inc, Danvers, MA, USA) and TUBB III (Abcam Inc, Cambridge, MA, USA). After washing, samples were treated with PE-conjugated, species-specific, secondary antibodies for 1 h at 4°C. 4′-6-Diamidino-2-phenylindole was used to detect nuclei. All the samples were mounted in Prolong gold (Invitrogen, Darmstadt, Germany) and observed under a Zeiss Axiovert 200 fluorescence microscope (Carl Zeiss Microscopy, Oberkochen, Germany).
Western blotting
Embryoid bodies were formed, as per Figure 1A with Ara-C (0.5 nM and 1 nM) treatment, and were washed with PBS, lysed in 150 mM NaCl, 1 mM EDTA, 20 mM Tris-HCl, pH 7.4, 1 mM phenylmethanesulfonyl fluoride; 1% TritonX-100, 1% protease inhibitor cocktail (Sigma, Steinheim, Germany) at 4°C. Samples were sonicated for 5 to 10 s and centrifuged at 4°C for 10 min. Clarified samples were quantitated with Bradford (Sigma, Steinheim, Germany) reagent. A total of 30 µg of protein was separated using 10% SDS-PAGE gels and transferred to polyvinylidene fluoride membrane. Membrane was blocked with 5% bovine serum albumin at room temperature. MAP2 (Cell signaling technology Inc, MA, USA) and TUBB III (Abcam Inc, Cambridge, USA) antibodies were incubated with membrane for overnight at 4°C on orbital shaking. After washing with PBST (PBS with 0.1% Tween-20), the membrane was incubated with secondary antibodies, labelled with horseradish peroxidase for 1 h at room temperature. The antibodies were detected using enhanced chemiluminescent Western detection system (Fisher Scientific GmbH, Schwerte, Germany).
Materials
Cytosine arabinoside was purchased from Sigma (Steinheim, Germany) and 10 mM stock solution was prepared in DMSO (Sigma, Steinheim, Germany). For further dilutions (KO)-DMEM-F12 was used as a solvent and 1 µM stock solution was prepared. This stock solution was added to differentiation medium in 1:1000 dilutions to obtain the final concentration of 1 nM. The final DMSO concentration, 0.00001% was added to untreated samples to normalize the effect of DMSO.
Results
Multilineage differentiation of hESCs
Mechanically disrupted hESC colony clumps typically formed rounded discrete structures and acquired an EB appearance within 2 to 3 days (Figure 1A). Continued growth of EBs in suspension culture (Figure 1A) resulted in increase in diameter (Figure S1). These randomly differentiated EBs were grown and analysed for presence of markers of the three germ layers. Multilineage differentiation of hESCs in EBs resulted in down-regulation of pluripotency markers such as POU5F1 and NANOG and subsequent increase in the germ layer markers (Figure 1B). To determine the time line for the microarray analysis, a preliminary time kinetic experiment was performed and RT-PCR analysis revealed that markers for the germ layer markers (Figure 1B) first appeared on day 6 and expression became stronger on day 12 and on day 14. The 14-day-old EBs expressed markers for endoderm (FGA, AFP and DCN), ectoderm (SOX3 and MAP2) and mesoderm (HAND1 POSTN, PITX2). All the markers for the germ layers were assessed using quantitative RT-PCR (qRT-PCR) and confirmed for the differential expression of these genes (Figure S2).
Identification of differentially expressed genes in Ara-C-treated EBs
In order to identify specific toxicity gene expression signatures we applied concentrations of Ara-C that are not cytotoxic to hESCs as detected by inhibition of their colony formation assay and MTS cytotoxicity test. As illustrated in Figure 1C, treatment of the cells with Ara-C resulted in concentration-dependent cell death with an IC50 value of 0.09 µM. According to the colony formation assay (Figure 1C), Ara-C was found to be cytotoxic in a concentration-dependent manner inhibiting colony formation at a concentration of 0.1 µM. The cell viability assays provide an IC10 value of 1 nM which has been used for the microarray gene expression experiments.
Total RNA was isolated from undifferentiated hESCs, 7- and 14-day-old control as well as from Ara-C-treated 7- and 14-day-old EBs and subjected to microarray analysis using the Illumina Bead Array platform. Intensity results of the arrays were examined and normalized to exclude background signals. Expression data were analysed using the R bioconductor. Figure 2A shows the principal component analysis plot of the different experimental conditions (treated vs. untreated in undifferentiated and differentiated cells). Control hESCs are seen to be secluded from differentiated EBs as observed in the principal component analysis plot. Seven days old treated and 7 days control EBs are found to be close to each other suggesting fewer significant differences in gene expression. In comparison to control 7-day-old EBs, only a small set of genes were differentially expressed in the Ara-C-treated 7-day-old EBs.
Figure 2.

Principal component and hierarchical clustering analysis of the differential expressed transcripts. A, 3-dimensional principal component analysis (PCA) of the expression pattern for undifferentiated human embryonic stem cells (hESCs), cytosine arabinoside (Ara-C)-treated and untreated samples. B, hierarchical clustering analysis of the differential expressed transcripts (Tables S3 and S4). Orange indicates over-represented and blue indicates under-represented gene expression pattern. Left panel, Cluster shows the 2036 (Table S3) differential expressed transcripts between hESCs, 7 and 14 days embryoid bodies (EBs). Zoomed display shows the expression of germ layer markers in 14-day-old EBs. Further GO analysis reveals the parent Biological Processes (BP) for each gene. Right panel, Cluster shows the 540 differential expressed genes (Table S4) in the Ara-C-treated 14-day-old EBs.
Compared with the undifferentiated hESCs, 1616 transcripts were dysregulated (310 up-regulated and 1306 down-regulated) in the control 7-day-old EBs; 2036 transcripts (889 up-regulated and 1147 down-regulated) were identified in control 14-day-old EBs (Tables S2 and S3 respectively) (Figure 2B, left panel). No significantly dysregulated transcripts were found in the Ara-C-treated 7-day-old EBs compared with the 7-day-old EBs, whereas compared with the 14-day-old EBs, 540 dysregulated transcripts were identified in Ara-C-treated 14-day-old EBs (Figure 2B, right panel) (124 up-regulated and 416 down-regulated, Table S4). Table 1 shows markers for the three germ layers affected by Ara-C treatment. Mesodermal markers such as COL1A1 and HAND1 and endodermal markers such as DCN were down-regulated, while ectodermal markers such as PAX6 and MAP2 were up-regulated after Ara-C treatment.
Table 1.
Analysis of potential gene markers differentially expressed 14 days untreated embryoid bodies (EBs) versus human embryonic stem cells (hESCs) and 1 nM cytosine arabinoside (Ara-C)-treated 14-day-old EBs versus 14 days untreated
| Marker genes | Untreated 14-day-old EBs compared with undifferentiated hESCs | Ara-C-treated 14-day-old EBs compared with untreated 14-day-old EBs |
|---|---|---|
| Fold change | Fold change | |
| Endoderm | ||
| AFP | 48.5 | N/A |
| APOA1 | 14.9 | N/A |
| APOA2 | 59.7 | N/A |
| APOA4 | 14.9 | N/A |
| DCN | 30.0 | −6.3 |
| FGA | 18.3 | N/A |
| FGB | 29.8 | N/A |
| FGG | 27.8 | N/A |
| SERPINA1 | 2.8 | N/A |
| ALB | 3.7 | N/A |
| FOXA2 | 2.0 | N/A |
| Ectoderm | ||
| FABP7 | 4.9 | 2.3 |
| HES5 | 11.7 | 2.3 |
| NES | N/A | 2.0 |
| NMU | −3.2 | 2.5 |
| NTNG1 | 2.0 | 2.0 |
| PAX6 | 3.0 | 3.3 |
| ROBO3 | 2.0 | 2.1 |
| SEMA5B | N/A | 2.2 |
| SLIT2 | 11.7 | −2.8 |
| SOX3 | N/A | 2.2 |
| Mesoderm | ||
| ANGPTL2 | 4.1 | −5.6 |
| HAND1 | 170.0 | −3.6 |
| HAND2 | 3.6 | −2.5 |
| MYL4 | 17.8 | −3.7 |
| MYL7 | 5.5 | −2.0 |
| TNNT2 | 5.8 | −4.8 |
| PITX2 | 17.8 | −3.6 |
| PITX1 | 42.2 | −3.9 |
| ADAMTS1 | 4.5 | −3.8 |
| ADAMTS9 | 10.2 | −2.7 |
| COL1A1 | 2.0 | −2.7 |
Table describes the crucial expression of three germ layer and its lineages markers upon Ara-C treatment (N/A – not observed in differentially expressed transcripts).
GO and Kyoto Encyclopedia of Genes and Genomes (KEGG) pathway analysis of the differentially expressed genes
To explore the functional properties of the transcripts that were differentially expressed upon day 7, day 14 of differentiation and that were induced by Ara-C treatment, functional annotation clustering was done to group transcripts according to biological process, molecular function and cellular component. The significantly (P≤ 0.01) enriched annotations for differentiation day 7 and 14 (Table S5A and B) include the embryonic developmental GO. Ara-C treatment GO at differentiation day 14 are shown in Table 2. For ‘biological process’ (Table 2) several annotations related to neuronal differentiation such as neuron differentiation, axonogenesis and neurogenesis were observed to be up-regulated and mesoderm development, kidney development and developmental process were down-regulated. Overall, the over-represented GO annotations for Ara-C contain genes which are distinctly associated with neuronal differentiation and down-regulated genes associated with mesodermal development (Table S5C). Pathway analysis for Ara-C-regulated genes using the KEGG pathway database, resulted in the identification of the only up-regulated axon guidance pathway which contained six genes, along with ECM-receptor interaction, and focal adhesion identified as the down-regulated pathways. These findings reveal a unique GO signature for Ara-C treatment. The group of up-regulated genes contained several neuronal markers (PAX6, MAP2 and ROBO3) (Table S4). Taking together the biological process and molecular functional annotations, a prevalence of neuronal differentiation clusters was identified among the up-regulated transcripts.
Table 2.
Selected biological process annotations that were significantly enriched (P < 0.01) in Dysregulated transcripts for cytosine arabinoside (Ara-C)-treated 14-day-old embryoid bodies (EBs) compared with untreated 14-day-old EBs
| Ara-C-treated day 14 EBs | P |
|---|---|
| Up-regulated genes | |
| Cell differentiation | 0.002385 |
| Cell morphogenesis | 0.006783 |
| Nervous system development | 6.32E-04 |
| Neuron differentiation | 0.00278 |
| Axonogenesis | 0.007693 |
| Neuron migration | 0.002444 |
| Down-regulated genes | |
| Organ development | 1.95E-08 |
| System development | 1.18E-08 |
| Developmental process | 2.63E-07 |
| Mesoderm development | 0.003412 |
| Kidney development | 0.001865 |
Ara-C-induced gene expression of neuronal specific genes
In order to investigate whether the neuronal-specific gene expression by Ara-C results in increased neurogenesis, we first studied neurogenesis by light microscopy after stimulation of the hESCs with different concentrations of Ara-C.
On day 14 of differentiation, neuronal cells (Figure 3A) were observed after Ara-C treatment (0.5 nM, 1 nM and 5 nM, plated on gelatine-coated plates till day 14 in differentiation media). Moreover, immunohistochemical analysis for Ara-C-treated (1 nM) and control adherent EBs was performed using antibodies detecting the neuronal specific proteins such as NESTIN, PAX6 (early neuronal differentiation markers), TUBB III (intermediate and late neuronal differentiation marker), MAP2 and TH (late neuronal differentiation markers). As illustrated in Figure 3B (i–v) all proteins have been detected in cells with a clear neuronal morphology. In contrast, a limited expression of the proteins in the control EBs has been observed. In addition to the immunohistochemical detection of the neuronal proteins, Western blotting was done for TUBB III and MAP2 using 0.5 and 1 nM concentrations of the drug. Increased protein levels were observed for both proteins in Ara-C-treated cells (Figure 3C).
Figure 3.
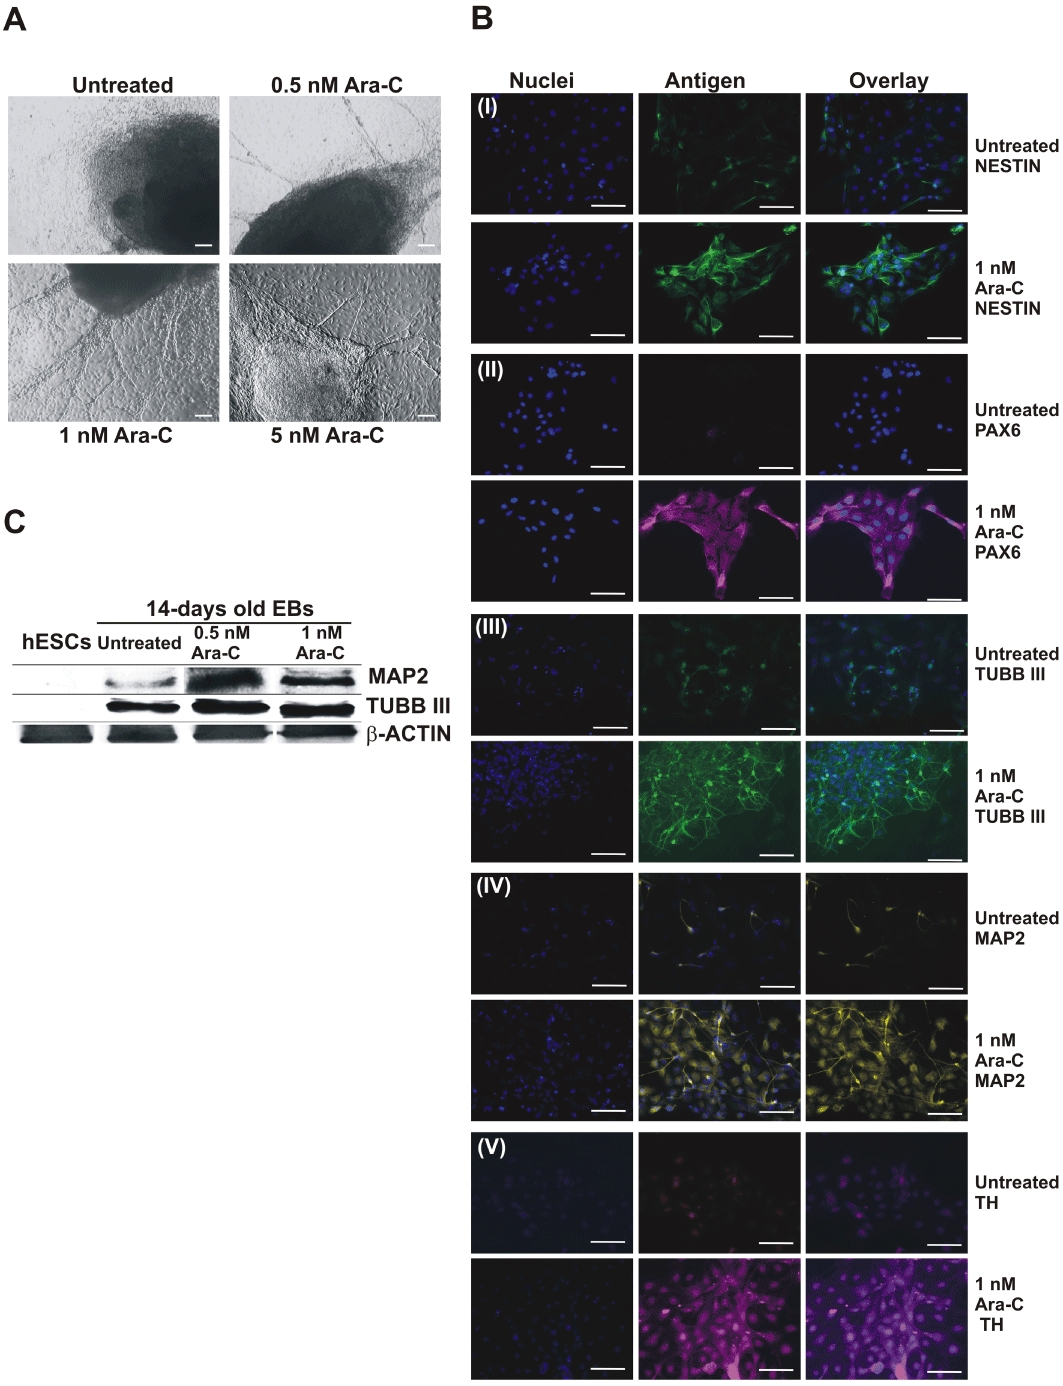
Neurogenesis observed in human embryonic stem cells (hESCs) upon treatment with different concentration of cytosine arabinoside (Ara-C) in random differentiation. A, differentiation and morphology of Ara-C-treated EBs. Neural rosette morphology of 14-day-old embryoid bodies (EBs) observed after treatment with different concentrations of Ara-C (Scale bar = 100 µm). B, immunocytochemical analysis of Ara-C-treated and untreated EBs dissociated as described in material and methods. (i) NESTIN, (ii) PAX6, (iii) TUBB III, (iv) MAP2, (v) TH demonstrates increase in the neuronal cell markers upon treatment with Ara-C (Scale bar = 100 µm). C, Western blot analysis of neuronal markers for different concentrations of Ara-C-treated 14-day-old EBs, showing an increase in expression for neuronal markers at 1 nM Ara-C.
Validation of microarray data by qRT-PCR
To validate the microarray data, we selected Ara-C-regulated marker genes from the GO and quantified relative mRNA levels using qRT-PCR. Results obtained are summarized in Figure 4. As indicated, these results confirmed the expression profile of these genes obtained from microarray analysis.
Figure 4.
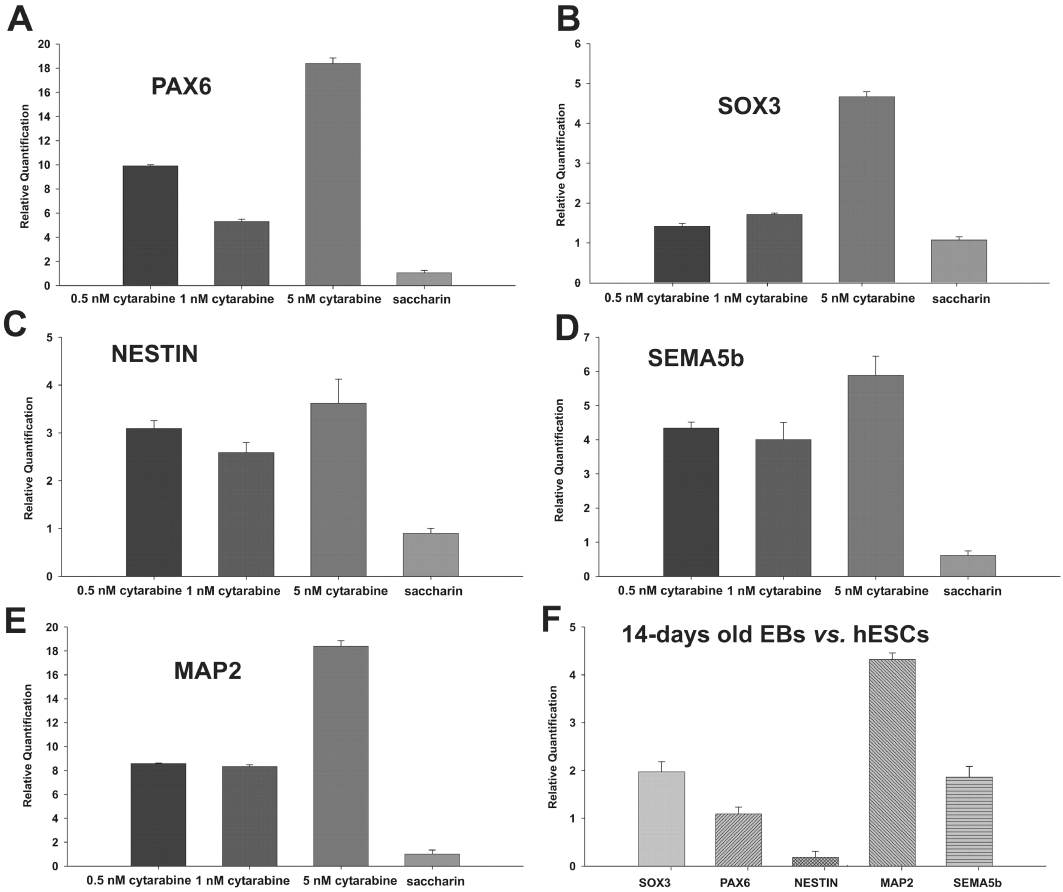
Real-time quantitative polymerase chain reaction (RT-qPCR) analysis of dose dependent gene expression. A–E, relative mRNA expression levels in 1 nM cytosine arabinoside (Ara-C)-treated 14-day-old embryoid bodies (EBs) compared with untreated 14-day-old EBs for ectodermal markers. Ara-C up-regulates ectodermal markers in a dose independent manner. F, expression of ectodermal markers in 14-day-old untreated EBs compared with undifferentiated human embryonic stem cells (hESC). Error bar shows SE from the technical replicates in real-time PCR.
Discussion and conclusions
In vivo, the susceptibility of the developing embryo and fetus to chemical exposures during prenatal and early postnatal life may result in important effects on gene expression, thus ensuing functional defects and increased risks of disease later in life (Grandjean et al., 2008).
These chemicals are often environmental factors, or therapeutic drugs (Sioka and Kyritsis, 2009). Because exposure to chemicals during development may cause irreversible effects, it is important to understand their specific mechanisms of toxicity. hESCs offer an effective tool to assess the profile of these toxicants and to understand and predict the damage caused by these therapeutic agents (Peters et al., 2008). More than 20 billion US dollars per year are invested by the North American and European pharmaceutical industries for drug discovery and only one out of 5000 compounds entering preclinical testing receives approval for therapeutic use (Kraljevic et al., 2004). Traditional approaches to toxicological testing typically involve animal experiments including multigeneration studies, thus making testing costly, time-consuming and incurring use of large numbers of animals.
Due to the interspecies differences, a sensitive and robust in vitro test system relevant to human safety is therefore of high relevance. Owing to the unique ability of ESCs to differentiate into all somatic cell types, the combination of these cells with sensitive toxicogenomics approaches (in the sense of transcriptomics) has been proposed as an alternative to the traditional approaches for drug safety testing (Winkler et al., 2009). In the present proof of concept study we have employed multilineage differentiation of hESCs as a model for testing toxicants (Figure 1).
Multilineage differentiation was found to express all the three germ layer transcripts. This can further be exploited by using toxicants at sublethal doses and investigating their effects on the germ layers, thus giving an insight into the developmental toxicity of these toxicants. Expression of germ line markers (Table 1) during the multilineage differentiation are influenced by the toxicant having the potential in the prediction of developmental toxicity. The hierarchical clustering for time course multilineage differentiation expression patterns reveals temporal changes in gene expression. Further insight into the markers present in 14-day-old EBs involves the germ layer lineage markers such as FGA, FGB, AFP, SLIT2, COL5A2, MYL4, COL6A3, MSX1, MYL7, BMP4, COL1A1, COL5A1 (Figure 2B). The parent biological process showed embryonic development and anatomical structure development. The biological processes for up-regulated transcripts at 7-day-old control EBs were vasculature, tissue, limb, brain and embryonic development with down-regulated transcripts found in biological processes for cell death, cellular process and apoptosis. In addition, 14-day-old control EBs showed a detailed developmental GO including tube, lung, organ, cartilage biological processes and also down-regulated transcripts for cell death, cell cycle and cellular processes (Table S5A and B), thus validating the differentiation into multiple lineages.
Cytosine arabinoside, a strong teratogen, induces developmental toxicity in murine and rat embryonic development. Histopathological studies have shown that Ara-C induces cerebellar hypoplasia, impaired nephrogenesis and retinal lesions at 50 mg·kg−1·day−1 in postnatally treated mice and rats (Percy and Albert, 1974). 0.25 mg/egg treatment of Ara-C in chicken embryos causes developmental abnormalities including facial coloboma, absence of the pelvic skeleton and other bone deletions, cornea1 cysts, and feather inhibition (Karnofsky and Lacon, 1966). At 20–800 mg·kg−1 dose, Ara-C produces developmental abnormalities, including cleft palate and lip, encephalocele and deformed appendages and tail in fetuses that survived to day 21 of gestation (Chaube et al., 1968). In the present study, hESCs were treated with Ara-C at 1 nM to monitor specific effects independent of its inhibition of the cell cycle. In accordance with the cytotoxicity and colony formation results, we did not observe any GO or KEGG pathways associated with cell death and apoptosis. The inhibition of mesodermal genes such as BMP4, as seen with Ara-C treatment, is essential for ectoderm linage selection, and a reduction in BMP signalling inhibits mesodermal differentiation and enhances ectodermal differentiation (Finley et al., 1999). Therefore, it is clear that the Ara-C-induced modulation of the genes regulating inhibition of mesoderm and formation of ectodermal cell types and neuronal cells are not non-specific.
Gene ontology enrichment of biological process (Table 2) includes skeletal system morphogenesis, kidney development, as being down-regulated on 14 days with Ara-C treatment. These results are reproduced in vivo with histopathological observations such as skeletal and nephrogenic impairment (Komori et al., 1997; Kuivaniemi et al., 1997; Clezardin and Teti, 2007; Palmieri et al., 2007). Further microarray results show the respective down-regulated biological process consists of skin, vascular, heart and mesoderm development. A high concentration of Ara-C treatment produced cleft palate and lip abnormalities in vivo; MSX1, a candidate marker for cleft palate development was 2.4-fold down-regulated for Ara-C treatment (Scapoli et al., 2002). Markers such as MSX1, COL3A1, COL1A1, COL1A2, AXUD1, MGP, CDH11, SPARC, POSTN, BMP4, expressed during bone morphogenesis and osteogenesis were down-regulated more than twofold for Ara-C treatment (Komori et al., 1997; Kuivaniemi et al., 1997; Clezardin and Teti, 2007; Palmieri et al., 2007). In addition, the analysis of down-regulated DET consists of mesoderm lineage markers such as HAND2, PITX2, GATA5, MYL4, ADAMTS9, TNNT2, KCNN2 and endoderm lineage markers such as DCN and IGFBP3.
Cytosine arabinoside can stimulate the expression of neuronal genes and pathways that consequently results in increased neurogenesis and in parallel suppress expression of mesodermal markers. This indicates an imperative role of Ara-C in the differentiation of hESC-derived EBs. Although at a low concentration (IC10), the drug shows almost no toxicity (Figure S1) but it has the potential to influence the differentiation of hESC towards ectoderm and neurogenesis.
Expression of FYN, reported to be crucial during early neurogenesis in the mouse embryo (Yagi et al., 1994), was 2.2-fold up-regulated in our study. HES5, which mediates notch signalling and is also required in neural tube of mouse embryos (Cau et al., 2000), was 2.3-fold up-regulated. Also, SOX3, which was 2.2-fold up-regulated, is one of the highly expressed and early markers in neural development of embryos and essential for the induction of neural tissue (Dee et al., 2008). Many of the dysregulated genes are related to axon guidance (Table 3) and the GO annotations (Table 2) for Ara-C show up-regulated and down-regulated transcripts for the biological process.
Table 3.
The Kyoto Encyclopedia of Genes and Genomes (KEGG) pathways that were dysregulated in 1 nM cytosine arabinoside 14-day-old embryoid bodies (EBs) compared with untreated 14-day-old EBs (P < 0.01)
| KEGG pathway | Number of genes | P-value |
|---|---|---|
| Down-regulated | ||
| Glycan structures – biosynthesis 2 | 6 | 0.008 |
| ECM-receptor interaction | 11 | 1.12E-05 |
| Focal adhesion | 14 | 2.05E-04 |
| Cell Communication | 14 | 3.51E-06 |
| Up-regulated pathways | ||
| Axon guidance | 6 | 0.001 |
Only pathways with more than five genes dysregulated are shown.
The neural network development requires growth cones during the developmental stage and also replenishes the neurites to attain the defined target of cues. A tight regulation of key signals from different pathways at different developmental stages is essential to establish developmental stage-specific growth cone guidance (Hong and Nishiyama, 2010). The neuronal growth cones respond to the cues for development and these cues may differ in different situations which they are encountered. Several dysregulated transcripts of the axon-guidance-pathway such as SEMA5, NTNG1, EPHB1, SLIT2 and DCC are associated with neurodegenerative diseases such as Parkinson's disease (Lin et al., 2009). Figure 5 shows the major genes such as SEMA5, NTNG1, EPHB1 and SLIT2 affected in axon guidance pathway by Ara-C. A study in hippocampal neurons revealed an additional function of SEMA5B, which is to regulate the development and maintenance of synapse size and number (To et al., 2007; O'Connor et al., 2009). Ara-C was found to up-regulate SEMA5B 2.2-fold. The Netrin Gs are often involved as probes in identification of specific neuronal circuits (Niimi et al., 2007). Netrin G1 (NTNG1) shows a tissue-dependent expression and a possibility that this gene plays an important role in the pathophysiology of schizophrenia (Aoki-Suzuki et al., 2005). SLIT and ROBO signalling are linked to cytoskeletal dynamics and protein synthesis in the axon guidance. SLITs operate through their receptor ROBO and are axon repellent cues. Mutations in the SLIT genes result in the collapse of the growth cone suggesting involvement of this gene in guidance interactions (Lin and Isacson, 2006; Hohenester, 2008). SLIT2 is down-regulated (−2.8-fold) whereas ROBO3 is up-regulated (2.1-fold) in our study. In addition, chemokine receptor CXCR4, having a vital role in development of nervous system (Tran and Miller, 2003), was 2.2-fold up-regulated in our study.
Figure 5.
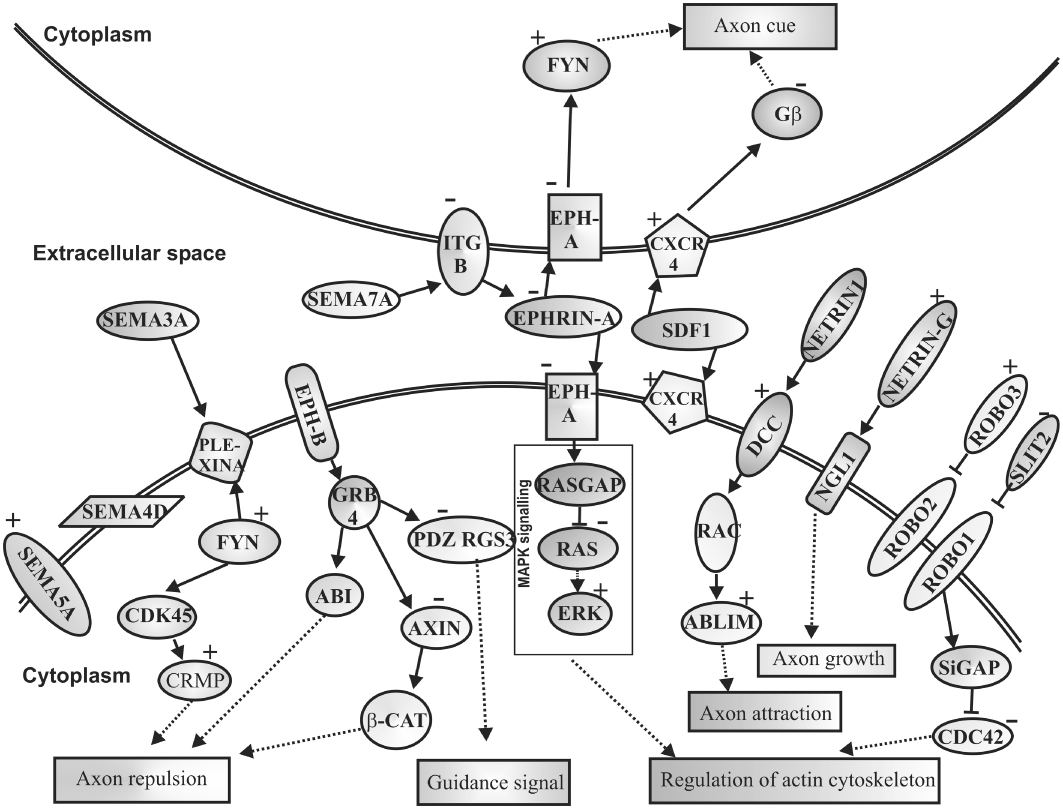
Kyoto Encyclopedia of Genes and Genomes pathway for cytosine arabinoside (Ara-C) induced axonogenesis during embryoid body (EB) development. This pathway shows axon guidance molecules that are dysregulated upon Ara-C treatment. Semaphorins activate axon repulsion through FYN, Ephrins regulate axon cue and actin cytoskeleton whereas SLIT and ROBO regulate actin cytoskeleton only. CXCR4/SDF1 regulates axon cues. Netrins with DCC affect axon attraction. All the mentioned molecules are crucial for axon guidance altering neuronal developmental pattern. (+ Up-regulated genes; – down-regulated genes).
In a study on the expression changes of axon guidance molecules in the adult rat brain induced by cocaine, EFNA1 was reported to be down-regulated in the treatment (Bahi and Dreyer, 2005). Our study shows a similar down-regulation of EFNA1 (−2.0-fold) following Ara-C treatment. The association of semaphorins, neuropilins, Ephs and SLIT/ROBO in Ara-C-treated hESC suggests the activation of a complex programme of synaptic rearrangements by the drug. Thus Ara-C modulates axon guidance genes with other neuronal markers resulting in augmentation of the ectoderm differentiation.
Most of the well-characterized markers in neuronal differentiation, such as NESTIN, PAX6, TUBB III, MAP2 and TH, were observed upon Ara-C treatment [Figure 3B (i–v) ], thus confirming its potential to generate early as well as mature neurons in sublethal concentrations.
In conclusion, Ara-C modulates the mesoderm and ectoderm lineage transcripts thus allowing an insight into the toxic behaviour at a sublethal dose. The multilineage differentiation system can be used to predict the detrimental effects of different toxicants during embryonic development. In contrast to a ‘static’in vitro model that is based on fully differentiated somatic cells, the hESC in vitro model is ‘dynamic’ because hESCs possess the unique capacity to differentiate into all somatic cell thereby recapitulating the in vivo developmental processes. Therefore, as demonstrated by Ara-C, the ESC model in combination with the -omics approaches is also suitable for monitoring developmental toxicity in a time-saving and cost-effective manner without using millions of animals.
Acknowledgments
This work was supported by the ‘Embryonic Stem cell-based Novel Alternative Testing Strategies’ (ESNATS) EU project (Grant agreement no. FP7 – 201619).
Glossary
Abbreviations
- Ara-C
cytosine arabinoside
- bFGF
basic fibroblast growth factor
- DET
differentially expressed transcripts
- DMSO
dimethyl sulphoxide
- EBs
embryoid bodies
- GO
gene ontology
- hESCs
human embryonic stem cells
- KEGG
Kyoto Encyclopedia of Genes and Genomes
- MTS
3-(4,5-dimethylthiazol-2-yl)-5-(3-carboxymethoxyphenyl)-2-(4-sulfophenyl)-2H-tetrazolium
- RT-PCR
reverse transcription polymerase chain reaction
Conflict of interest
None.
Supporting information
Additional Supporting Information may be found in the online version of this article:
Figure S1 To establish developmental toxicity gene signatures, sublethal concentration was chosen for treatment. For cytotoxicity assessment during the growth of EBs, size was measured in control and treatment. The figure shows the increase in diameter of the EBs during differentiation day 7 and day 14 in Ara-C-treated and untreated conditions. The error bar shows SD measured from 20 EBs.
Figure S2 The figure shows the expression level of multilineage developmental markers in 14-day-old EBs compared with undifferentiated hESCs as determined by the microarray and the RT-qPCR approach. In RT-qPCR, expression values are measured from three technical replicates from independent experiment. Error bar shows SEM.
Table S1 Table shows the primer sequences and product size for the RT-PCR and RT-qPCR genes expression studies
Table S2 To obtain the statistically significant gene signatures, F statistics was applied and adjusted with Benjamini Hochberg procedure for controlling the false discovery rate (P ≤ 0.05) at probe level. To further filter the DET threshold value ≥2 or ≤2 was applied. The table shows the 1616 genes that are up- and down-regulated in 7-day-old EBs versus undifferentiated hESCs
Table S3 The table shows the 2036 statistically significant DET that are up- and down-regulated in 14-day-old EBs versus undifferentiated hESCs
Table S4 The table shows the 540 statistically significant DET that are up- and down-regulated in 14-day-old EBs (1 nM Ara-C-treated) versus untreated 14-day-old EBs
Table S5 Gene ontology functional annotation for DET. (A) The table shows the functional annotation clustering in DAVID which explores the biological process, molecular function and cellular component annotations for 1616 differentially expressed transcripts derived from 7-day-old EBs versus undifferentiated hESCs, enriched with EASE score P-value (P ≤ 0.01) (B) The table shows the DAVID results for functional annotation clustering with EASE score P-value (P ≤ 0.01) for 2036 genes that are up- and down-regulated in 14-day-old EBs versus undifferentiated hESCs. (C) The table shows the DAVID results for functional annotation clustering with EASE score P-value (P ≤ 0.01) for 540 genes that are up- and down-regulated in 14-day-old EBs (1 nM Ara-C-treated) versus untreated 14-day-old EBs
Please note: Wiley-Blackwell are not responsible for the content or functionality of any supporting materials supplied by the authors. Any queries (other than missing material) should be directed to the corresponding author for the article.
References
- Adler S, Pellizzer C, Hareng L, Hartung T, Bremer S. First steps in establishing a developmental toxicity test method based on human embryonic stem cells. Toxicol In Vitro. 2008;22:200–211. doi: 10.1016/j.tiv.2007.07.013. [DOI] [PubMed] [Google Scholar]
- Aoki-Suzuki M, Yamada K, Meerabux J, Iwayama-Shigeno Y, Ohba H, Iwamoto K, et al. A family-based association study and gene expression analyses of netrin-G1 and -G2 genes in schizophrenia. Biol Psychiatry. 2005;57:382–393. doi: 10.1016/j.biopsych.2004.11.022. [DOI] [PubMed] [Google Scholar]
- Bahi A, Dreyer JL. Cocaine-induced expression changes of axon guidance molecules in the adult rat brain. Mol Cell Neurosci. 2005;28:275–291. doi: 10.1016/j.mcn.2004.09.011. [DOI] [PubMed] [Google Scholar]
- Bolstad BM, Irizarry RA, Astrand M, Speed TP. A comparison of normalization methods for high density oligonucleotide array data based on variance and bias. Bioinformatics. 2003;19:185–193. doi: 10.1093/bioinformatics/19.2.185. [DOI] [PubMed] [Google Scholar]
- Buesen R, Genschow E, Slawik B, Visan A, Spielmann H, Luch A, et al. Embryonic stem cell test remastered: comparison between the validated EST and the new molecular FACS-EST for assessing developmental toxicity in vitro. Toxicol Sci. 2009;108:389–400. doi: 10.1093/toxsci/kfp012. [DOI] [PubMed] [Google Scholar]
- Burridge PW, Anderson D, Priddle H, Barbadillo Munoz MD, Chamberlain S, Allegrucci C, et al. Improved human embryonic stem cell embryoid body homogeneity and cardiomyocyte differentiation from a novel V-96 plate aggregation system highlights interline variability. Stem Cells. 2007;25:929–938. doi: 10.1634/stemcells.2006-0598. [DOI] [PubMed] [Google Scholar]
- Cau E, Gradwohl G, Casarosa S, Kageyama R, Guillemot F. Hes genes regulate sequential stages of neurogenesis in the olfactory epithelium. Development. 2000;127:2323–2332. doi: 10.1242/dev.127.11.2323. [DOI] [PubMed] [Google Scholar]
- Chaube S, Kreis W, Uchida K, Murphy ML. The teratogenic effect of 1-beta-D-arabinofuranosylcytosine in the rat. Protection by deoxycytidine. Biochem Pharmacol. 1968;17:1213–1216. doi: 10.1016/0006-2952(68)90058-0. [DOI] [PubMed] [Google Scholar]
- Clezardin P, Teti A. Bone metastasis: pathogenesis and therapeutic implications. Clin Exp Metastasis. 2007;24:599–608. doi: 10.1007/s10585-007-9112-8. [DOI] [PubMed] [Google Scholar]
- Cohen SS. The lethality of aranucleotides. Med Biol. 1976;54:299–326. [PubMed] [Google Scholar]
- Dee CT, Hirst CS, Shih YH, Tripathi VB, Patient RK, Scotting PJ. Sox3 regulates both neural fate and differentiation in the zebrafish ectoderm. Dev Biol. 2008;320:289–301. doi: 10.1016/j.ydbio.2008.05.542. [DOI] [PubMed] [Google Scholar]
- Dennis G, Sherman B, Hosack D, Yang J, Gao W, Lane H, et al. DAVID: database for Annotation, Visualization, and Integrated Discovery. Genome Biol. 2003;4:R60. [PubMed] [Google Scholar]
- Desbaillets I, Ziegler U, Groscurth P, Gassmann M. Embryoid bodies: an in vitro model of mouse embryogenesis. Exp Physiol. 2000;85:645–651. [PubMed] [Google Scholar]
- Desbordes SC, Placantonakis DG, Ciro A, Socci ND, Lee G, Djaballah H, et al. High-throughput screening assay for the identification of compounds regulating self-renewal and differentiation in human embryonic stem cells. Cell Stem Cell. 2008;2:602–612. doi: 10.1016/j.stem.2008.05.010. [DOI] [PMC free article] [PubMed] [Google Scholar]
- Doss MX, Chen S, Winkler J, Hippler-Altenburg R, Odenthal M, Wickenhauser C, et al. Transcriptomic and phenotypic analysis of murine embryonic stem cell derived BMP2+ lineage cells: an insight into mesodermal patterning. Genome Biol. 2007a;8:R184. doi: 10.1186/gb-2007-8-9-r184. [DOI] [PMC free article] [PubMed] [Google Scholar]
- Doss MX, Winkler J, Chen S, Hippler-Altenburg R, Sotiriadou I, Halbach M, et al. Global transcriptome analysis of murine embryonic stem cell-derived cardiomyocytes. Genome Biol. 2007b;8:R56. doi: 10.1186/gb-2007-8-4-r56. [DOI] [PMC free article] [PubMed] [Google Scholar]
- Eisen MB, Spellman PT, Brown PO, Botstein D. Cluster analysis and display of genome-wide expression patterns. Proc Natl Acad Sci USA. 1998;95:14863–14868. doi: 10.1073/pnas.95.25.14863. [DOI] [PMC free article] [PubMed] [Google Scholar]
- Finley MF, Devata S, Huettner JE. BMP-4 inhibits neural differentiation of murine embryonic stem cells. J Neurobiol. 1999;40:271–287. [PubMed] [Google Scholar]
- Gissel C, Voolstra C, Doss MX, Koehler CI, Winkler J, Hescheler J, et al. An optimized embryonic stem cell model for consistent gene expression and developmental studies: a fundamental study. Thromb Haemost. 2005;94:719–727. doi: 10.1160/TH05-05-0338. [DOI] [PubMed] [Google Scholar]
- Grandjean P, Bellinger D, Bergman A, Cordier S, Davey-Smith G, Eskenazi B, et al. The faroes statement: human health effects of developmental exposure to chemicals in our environment. Basic Clin Pharmacol Toxicol. 2008;102:73–75. doi: 10.1111/j.1742-7843.2007.00114.x. [DOI] [PubMed] [Google Scholar]
- Hensley ML, Peterson B, Silver RT, Larson RA, Schiffer CA, Szatrowski TP. Risk factors for severe neuropsychiatric toxicity in patients receiving interferon alfa-2b and low-dose cytarabine for chronic myelogenous leukemia: analysis of Cancer and Leukemia Group B 9013. J Clin Oncol. 2000;18:1301–1308. doi: 10.1200/JCO.2000.18.6.1301. [DOI] [PubMed] [Google Scholar]
- Hipfner DR, Cohen SM. Connecting proliferation and apoptosis in development and disease. Nat Rev Mol Cell Biol. 2004;5:805–815. doi: 10.1038/nrm1491. [DOI] [PubMed] [Google Scholar]
- Hohenester E. Structural insight into Slit-Robo signalling. Biochem Soc Trans. 2008;36:251–256. doi: 10.1042/BST0360251. [DOI] [PubMed] [Google Scholar]
- Hong K, Nishiyama M. From guidance signals to movement: signaling molecules governing growth cone turning. The Neuroscientist. 2010;16:65–78. doi: 10.1177/1073858409340702. [DOI] [PubMed] [Google Scholar]
- Hosack DA, Dennis G, Jr, Sherman BT, Lane HC, Lempicki RA. Identifying biological themes within lists of genes with EASE. Genome Biol. 2003;4:R70. doi: 10.1186/gb-2003-4-10-r70. [DOI] [PMC free article] [PubMed] [Google Scholar]
- Karnofsky DA, Lacon CR. The effects of 1-beta-D-arabinofuranosylcytosine on the developing chick embyro. Biochem Pharmacol. 1966;15:1435–1442. doi: 10.1016/0006-2952(66)90188-2. [DOI] [PubMed] [Google Scholar]
- Komori T, Yagi H, Nomura S, Yamaguchi A, Sasaki K, Deguchi K, et al. Targeted disruption of Cbfa1 results in a complete lack of bone formation owing to maturational arrest of osteoblasts. Cell. 1997;89:755–764. doi: 10.1016/s0092-8674(00)80258-5. [DOI] [PubMed] [Google Scholar]
- Kraljevic S, Stambrook PJ, Pavelic K. Accelerating drug discovery. EMBO Rep. 2004;5:837–842. doi: 10.1038/sj.embor.7400236. [DOI] [PMC free article] [PubMed] [Google Scholar]
- Kreja L, Seidel HJ. On the cytotoxicity of some microbial volatile organic compounds as studied in the human lung cell line A549. Chemosphere. 2002;49:105–110. doi: 10.1016/s0045-6535(02)00159-5. [DOI] [PubMed] [Google Scholar]
- Kuivaniemi H, Tromp G, Prockop DJ. Mutations in fibrillar collagens (types I, II, III, and XI), fibril-associated collagen (type IX), and network-forming collagen (type X) cause a spectrum of diseases of bone, cartilage, and blood vessels. Hum Mutat. 1997;9:300–315. doi: 10.1002/(SICI)1098-1004(1997)9:4<300::AID-HUMU2>3.0.CO;2-9. [DOI] [PubMed] [Google Scholar]
- Lerou PH, Yabuuchi A, Huo H, Miller JD, Boyer LF, Schlaeger TM, et al. Derivation and maintenance of human embryonic stem cells from poor-quality in vitro fertilization embryos. Nat Protoc. 2008;3:923–933. doi: 10.1038/nprot.2008.60. [DOI] [PubMed] [Google Scholar]
- Lin L, Isacson O. Axonal growth regulation of fetal and embryonic stem cell-derived dopaminergic neurons by netrin-1 and slits. Stem Cells. 2006;24:2504–2513. doi: 10.1634/stemcells.2006-0119. [DOI] [PMC free article] [PubMed] [Google Scholar]
- Lin L, Lesnick TG, Maraganore DM, Isacson O. Axon guidance and synaptic maintenance: preclinical markers for neurodegenerative disease and therapeutics. Trends Neurosci. 2009;32:142–149. doi: 10.1016/j.tins.2008.11.006. [DOI] [PMC free article] [PubMed] [Google Scholar]
- Niimi K, Nishimura-Akiyoshi S, Nakashiba T, Itohara S. Monoclonal antibodies discriminating netrin-G1 and netrin-G2 neuronal pathways. J Neuroimmunol. 2007;192:99–104. doi: 10.1016/j.jneuroim.2007.09.026. [DOI] [PubMed] [Google Scholar]
- O'Connor TP, Cockburn K, Wang W, Tapia L, Currie E, Bamji SX. Semaphorin 5B mediates synapse elimination in hippocampal neurons. Neural Dev. 2009;4:18. doi: 10.1186/1749-8104-4-18. [DOI] [PMC free article] [PubMed] [Google Scholar]
- Palmieri A, Pezzetti F, Brunelli G, Zollino I, Scapoli L, Martinelli M, et al. Differences in osteoblast miRNA induced by cell binding domain of collagen and silicate-based synthetic bone. J Biomed Sci. 2007;14:777–782. doi: 10.1007/s11373-007-9193-z. [DOI] [PubMed] [Google Scholar]
- Percy DH, Albert DM. Developmental defects in mice and rats treated postnatally with cytosine arabinoside. Exp Mol Pathol. 1974;21:381–397. doi: 10.1016/0014-4800(74)90104-x. [DOI] [PubMed] [Google Scholar]
- Peters AK, Steemans M, Hansen E, Mesens N, Verheyen GR, Vanparys P. Evaluation of the embryotoxic potency of compounds in a newly revised high throughput embryonic stem cell test. Toxicol Sci. 2008;105:342–350. doi: 10.1093/toxsci/kfn126. [DOI] [PubMed] [Google Scholar]
- Rozen S, Skaletsky H. Primer3 on the WWW for general users and for biologist programmers. Methods Mol Biol. 2000;132:365–386. doi: 10.1385/1-59259-192-2:365. [DOI] [PubMed] [Google Scholar]
- Saldanha AJ. Java Treeview – extensible visualization of microarray data. Bioinformatics. 2004;20:3246–3248. doi: 10.1093/bioinformatics/bth349. [DOI] [PubMed] [Google Scholar]
- Scapoli L, Martinelli M, Pezzetti F, Carinci F, Bodo M, Tognon M, et al. Linkage disequilibrium between GABRB3 gene and nonsyndromic familial cleft lip with or without cleft palate. Hum Genet. 2002;110:15–20. doi: 10.1007/s00439-001-0639-5. [DOI] [PubMed] [Google Scholar]
- Sioka C, Kyritsis AP. Central and peripheral nervous system toxicity of common chemotherapeutic agents. Cancer Chemother Pharmacol. 2009;63:761–767. doi: 10.1007/s00280-008-0876-6. [DOI] [PubMed] [Google Scholar]
- Smyth GK. Linear models and empirical bayes methods for assessing differential expression in microarray experiments. Stat Appl Genet Mol Biol. 2004;3 doi: 10.2202/1544-6115.1027. Article3. [DOI] [PubMed] [Google Scholar]
- To KCW, Church J, O'Connor TP. Combined activation of calpain and calcineurin during ligand-induced growth cone collapse. Mol Cell Neurosci. 2007;36:425–434. doi: 10.1016/j.mcn.2007.08.001. [DOI] [PubMed] [Google Scholar]
- Tran PB, Miller RJ. Chemokine receptors: signposts to brain development and disease. Nat Rev Neurosci. 2003;4:444–455. doi: 10.1038/nrn1116. [DOI] [PubMed] [Google Scholar]
- Ungrin MD, Joshi C, Nica A, Bauwens C, Zandstra PW. Reproducible, ultra high-throughput formation of multicellular organization from single cell suspension-derived human embryonic stem cell aggregates. PLoS ONE. 2008;3:e1565. doi: 10.1371/journal.pone.0001565. [DOI] [PMC free article] [PubMed] [Google Scholar]
- Winkler J, Sotiriadou I, Chen S, Hescheler J, Sachinidis A. The potential of embryonic stem cells combined with -omics technologies as model systems for toxicology. Curr Med Chem. 2009;16:4814–4827. doi: 10.2174/092986709789909657. [DOI] [PubMed] [Google Scholar]
- Xu C, Inokuma MS, Denham J, Golds K, Kundu P, Gold JD, et al. Feeder-free growth of undifferentiated human embryonic stem cells. Nat Biotechnol. 2001;19:971–974. doi: 10.1038/nbt1001-971. [DOI] [PubMed] [Google Scholar]
- Yagi T, Shigetani Y, Furuta Y, Nada S, Okado N, Ikawa Y, et al. Fyn expression during early neurogenesis in mouse embryos. Oncogene. 1994;9:2433–2440. [PubMed] [Google Scholar]
Associated Data
This section collects any data citations, data availability statements, or supplementary materials included in this article.