

Abstract
Purpose
To measure and compare cortical and medullary T1 values in native and transplanted kidneys with a wide range of function as measured by estimated glomerular filtration rate (eGFR).
Materials and Methods
A total of 27 subjects (12 native and 15 transplants) were studied. Two MR exams of T1 measurement were performed on separate days for reproducibility study. Group-wise comparisons of renal T1 on day 1 were performed between subjects with native and transplanted kidneys and also between subjects based on an eGFR threshold of 60 ml/min/1.73m2.
Results
Transplanted kidneys had higher cortical renal T1 (1183±136 ms) than native kidneys (1057±94 ms) with similar results in the medulla. Subjects with an eGFR < 60 ml/min/1.73m2 had higher renal T1 than subjects with an eGFR > 60 ml/min/1.73m2 (cortical T1: p<0.0001; medullary T1: p=0.008). Renal T1 were highly reproducible for both native and transplant groups (with percent differences less than 10%).
Conclusion
There are differences in cortical and medullary T1 between native and transplanted kidneys at different levels of function.
Keywords: native, transplant, renal function, T1 measurements, cortex, medulla
INTRODUCTION
The longitudinal relaxation time (T1) has been reported to be more helpful in characterizing renal diseases compared with T2 and spin density (1). In 1990s, loss of corticomedullary differentiation (CMD) on T1-weighted MR images in renal insufficiency was reported (2). Recently it has been found that an increased T1 relaxation time in cortex primarily caused the loss of CMD and a negative correlation between the cortical T1 and renal function has been observed for subjects with native kidneys (3). All of these suggest the quantitative renal-tissue T1 values may themselves be important in differentiating specific disease states. Furthermore, the variety of renal T1 values among different patients may potentially affect the accuracy of functional MR imaging measures which utilize T1 values. Therefore measurement of T1 on a subject-specific basis may be necessary, particularly as these techniques are translated into the clinical setting. In this paper, we focus our study on measurement of quantitative T1 information in human kidney cortex and medulla. While the individual or average renal (cortical and medullary) T1 have been reported in the literature (1, 3–6), to our knowledge, the quantitative measure of renal T1 for subjects with transplanted kidneys at 1.5T have not been reported. The purpose of our study is to measure the T1 in the cortex and medulla on a subject-specific basis in both native and transplanted kidneys utilizing an inversion-recovery scheme (6). We hypothesize that normal and poorly functioning native and transplanted kidneys will have systematic differences in T1 distinguishing transplanted from native kidneys and poor from normal function. Furthermore, the inter-day reproducibility of the renal T1 values were explored to establish a threshold for expected physiologic variability in time as a precursor to longitudinal assessment of kidney function using T1 before and after transplant.
MATERIALS AND METHODS
This study complies with Health Insurance Portability and Accountability Act (HIPAA) and was approved by our institutional human subjects review board. Written informed consent was obtained from all subjects. A total of 27 subjects were recruited for the study: 12 subjects with native kidneys (five women, seven men; mean age ± standard deviation (SD): 54±14 years; age range: 32–79 years) and 15 subjects with transplanted kidneys (three women, twelve men; 49±14 years; age range: 21–71 years; time since kidney was implanted to the first MRI exam date ranged from 6 months to 31 years). In this study the estimated glomerular filtration rate (eGFR) was used to indicate renal function but the specific diagnosis of the underlying kidney disease was not clearly known due to the unavailability of biopsy. In all cases, eGFR was estimated just prior to the subject’s first MRI examination from the measure of creatinine levels in a blood sample by use of the Modification of Diet in Renal Disease (MDRD) equation (7, 8). To assess inter-day reproducibility, two MR exams were performed for every subject on separate days at least 24 hours apart. The subjects refrained from fluid intake for 4 hours before the MR exam, and the MR exams were performed at the same time of day on both days. Group-wise comparisons of T1 values were based on kidney function defined by eGFR lower than 60 ml/min/1.73m2 and above 60 ml/min/1.73m2. This threshold was selected since chronic kidney disease (CKD) is defined as kidney damage or a GFR below 60 ml/min/1.73m2 for three months or more (9).
T1 Acquisition
The MR examinations were performed on a 1.5T MR scanner (Signa HDx, GE Healthcare, Milwaukee, WI, USA) with an eight-element phased array cardiac coil (GE Healthcare, Milwaukee, WI, USA). For T1 measurement, a series of seven to eight abdominal MR images were acquired at different inversion times (TI: 50–3500 ms). Each inversion-recovery image was acquired during a separate breath-hold using at least ten seconds between breath-holds to allow sufficient time for magnetization recovery. An inversion recovery single shot fast spin echo (IR-SSFSE) sequence was used for acquisition with the following readout parameters: TR/TE/Echo Spacing= 4000/24.8/4.2 ms, BW = 83.33 kHz, FOV=34 cm and 128 × 128 matrix. An oblique coronal slice was chosen for all subjects with native kidneys and seven subjects with transplanted kidneys and an oblique sagittal slice was chosen for eight subjects with transplanted kidneys. Each inversion-recovery image was acquired during a breath hold after expiration to minimize respiratory motion. For the purpose of differentiating cortical and medullary regions, an additional centric phase-encoded balanced steady state free precession (b-SSFP) image was acquired for every subject at an inversion time of 1.2 s with a 20 ms hyperbolic secant adiabatic inversion pulse and following readout parameters: TR/TE/flip = 4.6/2.3ms/70°, BW = 83.33 kHz, FOV = 34–36 cm, and 128 × 128 matrix.
Image Processing
Images were analyzed using custom scripts written in MATLAB (MATLAB version 7.5, The MathWorks Inc., Cambridge, MA, USA). The procedures to process the data are summarized as follows.
Image Registration and Segmentation
To correct for respiratory motion, the series of abdominal IR-SSFSE images were first automatically registered based on image mutual information (10). The series of images was manually registered if it was necessary to compensate for any misalignment after automatic registration. The b-SSFP image was registered using the same methods to the IR-SSFSE image at the first TI point. The kidney was then manually segmented out from the abdomen in the b-SSFP image, and the vessel region was manually excluded in the hilum of the kidney. The remaining voxels in the b-SFFP image were presumed to represent only cortex and medullary renal tissue. Due to the inherent T1 weighting of the inversion recovery b-SSFP image, the signal intensity of the cortex was brighter than the medulla allowing segmentation using signal thresholding of the image histogram. The threshold value was chosen interactively to ensure that the medulla was excluded from cortex. To further reduce partial volume mixing between cortex and medulla, a smaller ROI within the automatically segmented medulla was manually defined according to following criteria. First only pure pyramids were chosen to exclude connective cortical tissue between pyramids. Second, of the chosen “pure” pyramids, those with uniformly distributed signal intensity were selected to exclude physiologic noise. Finally, from the remaining candidates, the pyramid having largest area was chosen.
T1 fitting
The T1 map was calculated on a pixel-by-pixel basis for the whole kidney by fitting the series of IR-SSFSE images data to the inversion-recovery equation:
| [1] |
where S represents the MR signal, M0 represents the proton density and α represents inversion efficiency. In the fitting, M0, α and T1 are free parameters to be fitted. In certain cases, one of the seven to eight images was excluded from analysis due to the bias of low signal intensities by stochastic noise (11, 12) in the image at the null-point. Finally, the mean and SD of the T1 maps of cortex and medulla ROI were calculated within the corresponding masks obtained from the b-SSFP image to the fitted T1 map for the whole kidney.
Statistical Analysis
For the subjects with native kidneys, the mean T1 values of right and left kidneys were averaged to facilitate group-wise comparisons as there was not much variation between the two kidneys (intraclass correlation coefficient (ICC) = 0.76 and 0.92 for cortical T1 on days 1 and 2 respectively; ICC = 0.68 and 0.79 for medullary T1 on days 1 and 2 respectively) (13, 14). This resulted in 12 averaged (or mean of) T1 values for cortex or medulla from 12 native subjects and 15 mean T1 values from 15 transplant subjects. Group-wise comparisons of T1 values were performed using a Mann Whitney Test between native and transplant groups, and also between two groups of subjects according to the kidney function defined by eGFR less than or greater than 60 ml/min/1.73m2 based on the clinical significance of this cutoff (9). An analysis of covariance (ANCOVA) test using a general linear model was performed to examine whether or not there is a difference in T1 values between native and transplant groups after adjusting for eGFR. Statistical significance was defined as a two-tailed p-value < 0.05. The relationship between T1 and eGFR was further investigated with linear regression analysis and Pearson correlation. The reproducibility of cortical and medullary T1 values was measured for all subjects that had repeated exams by calculating the percent differences between days 1 and 2.
RESULTS
Cortical and medullary T1 values for both native and transplant groups were highly reproducible (Fig. 1(a) and (b)) with at least 90% of all percent differences within ±10% for both cortex and medulla. Specifically, the mean and SD of the percent differences for the native and transplant groups are 0.1%±5.4 % and −1.8%±8.1% for cortical T1, and 1.0%±5.1% and −3.5%±5.5% for medullary T1.
Figure 1.


The Bland Altman plots showing the percent differences between renal T1 measurements given on day 1 and 2. (a) Cortical T1. (b) Medullary T1. The day 1 measurement was used as reference. Negative percent differences correspond to a lower T1 measurement on the day 2. Data includes 12 native subjects and 14 transplant subjects (one transplant subject was not able to complete scan on day 2). The inner lines represent mean and outer lines represent mean ± 2·SD with dashed lines for native group and dashed dot lines for transplant group.
The age, sex, eGFR and measured mean and SD of kidney cortical and medullary T1 values measured on day 1 are indicated in Table 1 and 2 for native and transplant subjects respectively. The 27 subjects in this study exhibited a wide range of renal function; eGFR from 19 to 88 ml/min/1.73m2, with 16 subjects having an eGFR lower than 60 ml/min/1.73m2 (5 native and 11 transplant subjects) and 11 subjects having an eGFR above 60 ml/min/1.73m2 (7 native and 4 transplant subjects). The range of eGFRs in the native group (19–88 ml/min/1.73m2 with a mean of 60 ml/min/1.73m2) vs. transplant group (18–78 ml/min/1.73m2 with a mean of 50 ml/min/1.73m2) was comparable. Qualitative analysis of the T1 maps demonstrated different T1 values in both cortical and medullary regions in all kidneys; representative T1 maps from one subject with native kidneys and one subject with a transplanted kidney are illustrated in Fig. 2(a) and (b), and Fig. 2(c) and (d) respectively.
Table 1.
Age, sex, eGFR, left and right-kidney cortical and medullary T1 of subjects with native kidneys measured on day 1. The subjects were listed in an order of ascending eGFR.
| Native subject | Age | Sex | eGFR | T1 (ms) on Day 1, mean ±SD | |||
|---|---|---|---|---|---|---|---|
| Cortex | Medulla | ||||||
| Left | Right | Left | Right | ||||
| 1* | 64 | M | 19 | 1261±273 | 1181±270 | 1442±66 | 1399±76 |
| 2* | 60 | F | 23 | 1161±126 | 1086±201 | 1376±76 | 1438±69 |
| 3* | 60 | M | 26 | 1137±237 | 1055±163 | 1382±135 | 1297±95 |
| 4* | 79 | M | 42 | 1218±215 | 1168±270 | 1476±99 | 1426±159 |
| 5* | 45 | M | 50 | 1088±166 | 1096±186 | 1357±152 | 1328±120 |
| 6 | 53 | M | 67 | 1033±138 | 1040±109 | 1339±146 | 1341±52 |
| 7 | 62 | F | 77 | 868±309 | 958±346 | 1355±121 | 1343±142 |
| 8 | 65 | F | 77 | 1020±162 | 1053±110 | 1442±129 | 1437±117 |
| 9 | 52 | F | 80 | 997±113 | 1027±162 | 1447±113 | 1417±102 |
| 10 | 32 | M | 82 | 853±370 | 991±257 | 1340±112 | 1290±121 |
| 11 | 33 | F | 88 | 955±257 | 1040±119 | 1420±101 | 1439±83 |
| 12 | 41 | M | 88 | 1033±147 | 1061±153 | 1384±154 | 1423±136 |
‘F’ represents female. ‘M’ represents male.
eGFR values are given in ml/min/1.73m2.
‘Left’ and ‘Right’ represent left and right kidney, respectively.
denotes a subject has kidney function below 60 ml/min/1.73m2.
Table 2.
Age, sex, eGFR and cortical and medullary T1 of subjects with transplanted kidneys measured on day 1. The subjects were listed in an order with ascending eGFR.
| Transplant subject | Age | Sex | eGFR | T1 (ms) on Day 1, mean ±SD | |
|---|---|---|---|---|---|
| Cortex | Medulla | ||||
| 1* | 44 | M | 18 | 1360±210 | 1769±284 |
| 2* | 41 | M | 21 | 1491±215 | 1833±134 |
| 3* | 30 | M | 22 | 1283±202 | 1757±263 |
| 4* | 41 | F | 41 | 1150±228 | 1657±204 |
| 5* | 71 | M | 46 | 1193±184 | 1562±144 |
| 6* | 54 | M | 48 | 1135±194 | 1476±198 |
| 7* | 54 | F | 50 | 1179±194 | 1553±148 |
| 8* | 56 | M | 51 | 1316±143 | 1627±149 |
| 9* | 66 | M | 54 | 1234±194 | 1579±187 |
| 10* | 64 | M | 54 | 1068±181 | 1483±105 |
| 11* | 55 | M | 56 | 1131±140 | 1535±191 |
| 12 | 38 | M | 66 | 1037±155 | 1488±135 |
| 13 | 34 | M | 74 | 1080±200 | 1440±103 |
| 14 | 21 | M | 74 | 1118±189 | 1435±86 |
| 15 | 61 | F | 78 | 967±168 | 1396±121 |
Figure 2.
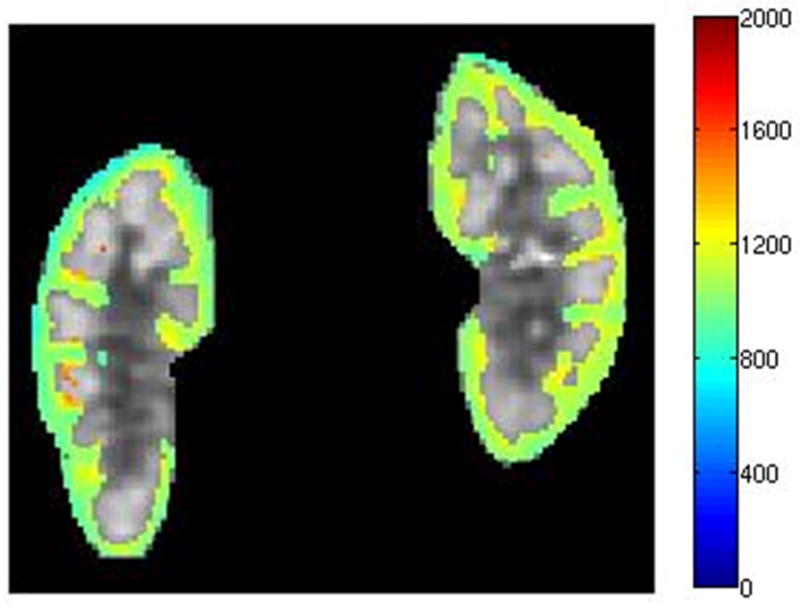
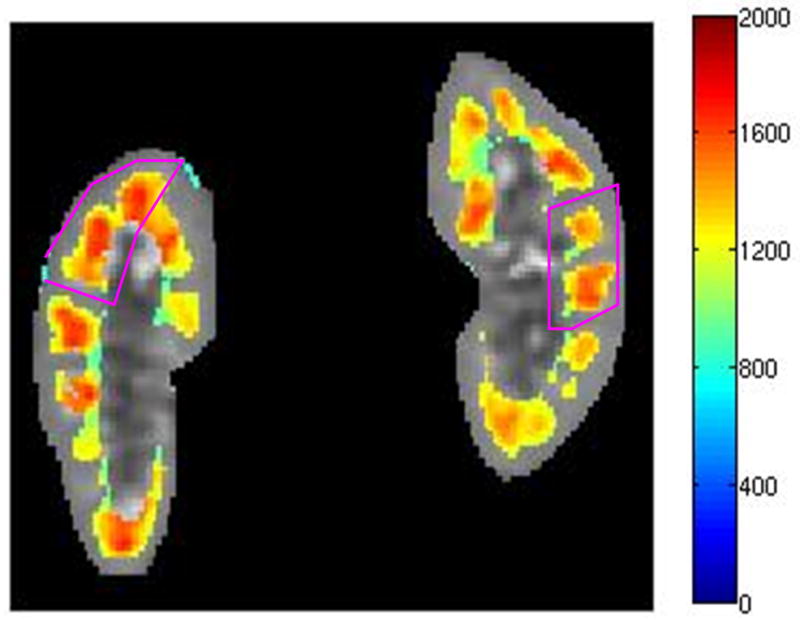
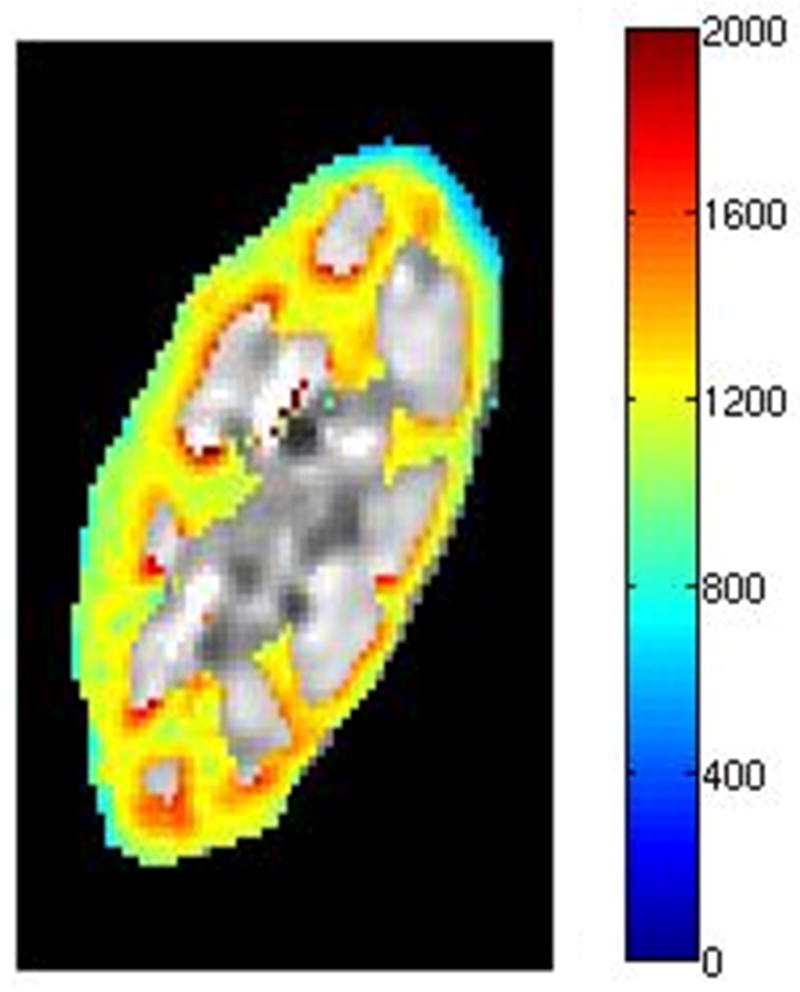
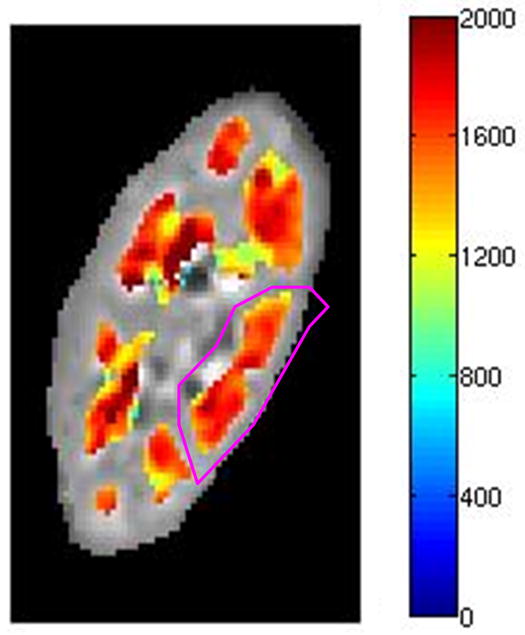
Kidney T1 maps of one subject with native kidneys ((a) and (b)) and one subject with a transplanted kidney ((c) and (d)). The segmented cortex and medulla regions were highlighted in color. The small medulla ROI was outlined by the magenta curves in (b) and (d). The color bar on right side of each image indicates T1 values in unit of ms.
Group-wise comparisons of renal T1 on day 1 were performed between subjects with native and transplanted kidneys and also between subjects based on an eGFR threshold of 60 ml/min/1.73m2. The average cortical T1 value for transplanted kidneys was higher compared to native kidneys (mean±SD: native, 1057±94 ms; transplant, 1183±136 ms; p=0.01). The average medullary T1 value for the transplant group was also higher than the native group (native, 1389±48 ms; transplant, 1573±132 ms; p=0.0001). The average cortical T1 value was higher for the group of subjects with an eGFR below 60 ml/min/1.73m2 compared to group above 60 ml/min/1.73m2 (mean±SD: eGFR < 60 ml/min/1.73m2, 1204±113 ms; eGFR > 60 ml/min/1.73m2, 1015±62 ms; p<0.0001). Similarly, the average medullary T1 value for subjects with an eGFR less than 60 ml/min/1.73m2 was higher than those with an eGFR above 60 ml/min/1.73m2 (mean±SD: eGFR < 60 ml/min/1.73m2, 1550±149 ms; eGFR > 60 ml/min/1.73m2, 1406±52 ms; p=0.008). After adjusting for eGFR, the average T1 values of both cortex and medulla for the transplant group were still higher than native group (Table 3; p=0.01 for cortical T1 and p<0.001 for medullary T1, both having negative coefficient estimates). Therefore, both kidney type and eGFR influence the T1 values in cortex and medulla.
Table 3.
Comparison of average T1 values on day 1 in each renal tissue for native subjects vs. transplant subjects after adjusting for eGFR.
| Renal tissue | Effect | Coefficient estimate | Standard error | ANCOVA test p-value |
|---|---|---|---|---|
| Cortex | Kidney type (Native vs. Transplant) | −86 | 31 | p=0.01 |
| eGFR | −4 | 0.7 | p<0.001 | |
| Medulla | Kidney type (Native vs. Transplant) | −158 | 35 | p<0.001 |
| eGFR | −3 | 0.8 | p=0.003 |
Note – Coefficient estimate of kidney type represents the difference between mean T1 values (after adjusting for eGFR) of native and transplant (reference) groups. Coefficient estimate of eGFR represents the change of T1 value (after adjusting for kidney type) per one unit increase of eGFR (ml/min/1.73m2).
Renal T1 distribution on day 1 was stratified further into subgroups of native-only subjects and transplant-only subjects with eGFR respectively below and above 60 ml/min/1.73m2 respectively. Cortical T1 values for subjects with eGFR lower than 60 ml/min/1.73m2 (mean: native, 1173 ms; transplant, 1231 ms) were higher than those with eGFR above 60 ml/min/1.73m2 (mean: native, 966 ms, p=0.01; transplant, 1051 ms, p=0.01). Medullary T1 values for native subjects with eGFR below 60 ml/min/1.73m2 (mean: 1407 ms) were not significantly different from native subjects with eGFR above 60 ml/min/1.73m2 (mean: 1390 ms; p=1.0). However, for transplant subjects, medullary T1 values for eGFR below 60 ml/min/1.73m2 (mean: 1610 ms) were higher than those for eGFR above 60 ml/min/1.73m2 (mean: 1440 ms; p=0.01).
For both native and transplant groups, the cortical T1 values correlated highly with eGFR (Fig. 3(a); r=−0.80, p=0.0017 and r=−0.83, p=0.0001 respectively). Consistent with the group comparisons, the medullary T1 values correlated with eGFR only for the transplant group (Fig. 3(b); r=−0.94, p<0.0001) and not for the native group (Fig. 3(b); r=−0.02, p=0.94).
Figure 3.


Scattered plots of cortical (a) and medullary (b) T1 vs. eGFR measured on day 1 for 12 native subjects and 15 transplant subjects. The lines represent the curves linearly fitted to the scattered data points, “r” represents the Pearson correlation coefficient and “p” represents the two-tailed p-value.
DISCUSSION
The results in this work support the cortical and medullary T1 values as imaging markers of declining kidney function in both native and transplanted kidneys. Increased average cortical and medullary T1 values were found in patients with transplanted kidneys compared to patients with native kidneys. Native kidneys with reduced function (eGFR below 60 ml/min/1.73m2) had higher cortical but comparable medullary T1 compared to native kidneys with good function (eGFR above 60 ml/min/1.73m2). Transplant kidneys with lower function had both higher cortical and medullary T1 compared to well-functioning transplanted kidneys. Cortical T1 was also highly and negatively correlated with kidney function measured with eGFR for both native and transplanted kidneys. Medullary T1 was negatively correlated with eGFR for transplanted kidneys. Moreover, both of the cortical and medullary T1 measurements were highly repeatable between exams performed on separate days.
Kidney cortical T1 have been measured by Hricak (1, 4, 5) in the 1980s on both native and transplant subjects. While the examinations were acquired using an MR scanner with a lower magnetic field of 0.35T, increased cortical T1 were observed for transplant compared to native kidneys. The authors speculated the difference was due to increased water load by the solitary allograft (1). In addition, Hricak has noted differences in the cortical T1 values in kidneys with hemosiderosis, chronic renal failure and acute allograft rejection (1, 4, 5). In these studies, it was suggested that the cortical T1 may change due to the type of kidney disease (5, 15, 16). In our study, we focused on subjects with native and transplanted kidneys over a range of function, regardless of the underlying kidney disease. We found significant differences for cortical T1 between groups with an eGFR above 60 ml/min/1.73m2 and below 60 ml/min/1.73m2, suggesting that changes in the T1 of cortical tissue may be a non-specific process which occurs in all kidneys as their function declines.
For native kidneys, the negative correlation between cortical T1 and eGFR and the nonsignificant correlation between medullary T1 and eGFR were also observed and reported by Lee (3) using the single kidney glomerular filtration rate (SKGFR) to indicate the renal function level. However no transplanted kidneys were involved in that study. It is interesting to note that T1 and eGFR in transplanted kidneys were highly correlated in the medulla for our study suggesting diminished or loss of autoregulation in comparison to native kidneys as observed in Lee et al (3) and the current study.
The quantitative T1 values our group obtained were compared to those in the literatures. The mean and SD of cortical T1 values in the native group of 1057±94 ms agreed well with the value of 1082±138 ms reported by Lee (3). However, this value was substantially higher than the value of 966±58 ms reported by de Bazelaire (6) in healthy native kidneys also at the 1.5T magnetic field strength. This discrepancy is likely due to the wider range of native kidney function included in the present study. Furthermore, for native kidneys with good function (eGFR above 60 ml/min/1.73m2), the mean and SD of cortical T1 values was 995±56 ms, which was fairly close to what de Bazelaire reported. The mean and SD of medullary T1 values in the native group of 1389±48 ms was substantially higher than the value of 1229±103 ms reported by Lee (3). It may be higher because we allowed more magnetization recovery between inversions (10 s vs 4 s) which is beneficial in tissues with longer T1, such as the medulla. However, our value agreed well with the value of 1412±58 ms reported by de Bazelaire (6). Even with a wider range of renal function for native kidneys in our study, this is consistent with the observation that the medullary T1 did not significantly correlate with eGFR. For native kidneys, the slope between cortical T1 and eGFR was −2.9 matching well with the value of −2.9 reported by Lee (3). The slope between medullary T1 and eGFR for native kidneys in our group was −0.04 which was smaller than the value of 1.1 reported by Lee (3). This discrepancy is reasonable since the medullary T1 did not significantly correlate with eGFR in either study and both slopes were near zero.
The higher standard deviations of both cortical and medullary T1-value distributions in kidneys with eGFR below 60 ml/min/1.73m2 compared to those with eGFR above 60 ml/min/1.73m2 indicate the trend of bigger variations of renal T1 values among poorly functioning kidneys. This also explained why the cortical and medullary T1 values in the transplant group have higher standard deviations compared to native group since more transplanted kidneys were defined as poorly functioning with eGFR below 60 ml/min/1.73m2 (5 native vs 11 transplant subjects with eGFR < 60 ml/min/1.73m2). The observed correlation between medullary T1 values and eGFR in transplanted kidneys, which may be due to a loss of ability to regulate medullary function, was also reflected in a wider medullary T1-value distribution in the transplant compared to the native group. By comparison, the medullary T1 values did not vary much in native kidneys nor correlate with eGFR.
The variability of cortical and medullary T1 values between patients and at different levels of function may potentially affect the accuracy of evaluating renal function by use of functional MR imaging measures that depend upon T1 values for modeling signal change such as arterial spin labeling (ASL) (17–19). For example, the measurement of T1 on a subject-specific basis may be necessary for ASL perfusion measures especially in poorly functioning and transplanted kidneys.
There are several limitations of the present study. A significant limitation is the use of MDRD in a mixed population, including transplant subjects in which it may not necessarily predict GFR well. In addition, the study is relatively small although it is strengthened by the performance of repeated measures in the same subject. We also did not control for the type of underlying kidney disease in the subjects with an eGFR less than 60 ml/min/1.73m2, which may account for some of the variability of T1 measurements between subjects. Nonetheless there are very significant differences between groups of subjects simply based on the eGFR, in both transplanted and native kidneys for cortical T1.
The relationship between T1 values and eGFR was different according to kidney types (Fig. 3(a) and (b); each linearly fitted curve having a different slope), and this indicated an interaction effect between kidney types and eGFR in both cortex and medulla regarding their influence on renal T1 values. Although the interaction effect was not considered in the ANCOVA analysis presented in Table 3, concluding that both kidney types and eGFR influence T1 values is reasonable even when the interaction effect is considered (p<0.05; data not shown).
In the estimation of cortical and medullary T1, rigid body registration was sometimes necessary for both native and transplant subjects. However, in some cases the effects of inter-scan motion could not be corrected due to deformable kidney motion, which will contribute to error in the T1 fitting and impair delineation of cortex from medulla. A more complete registration strategy including compensation of deformable and rotational motion is under development. The segmentations of the kidney cortex and medulla were performed interactively by choosing a threshold using the signal intensity histogram of the b-SSFP image. This approach is subjective, and time-consuming. More automatic and objective segmentation methods (20) are also needed to facilitate translation of this technique.
In summary, results in this study show that both renal cortical and medullary T1 measurements indicate significantly higher T1 values in the group of subjects with an eGFR below 60 ml/min/1.73m2 compared to the group of subjects with an eGFR above 60 ml/min/1.73m2, with more variability for T1 measures in the former group. Mean cortical and medullary T1 measures were also higher in subjects with transplanted kidneys compared to subjects with native kidneys, which may reflect overall lower eGFR in the transplant group. Inter-day reproducibilities were fairly good for both cortical and medullary T1 measurements (with most percent differences less than 10%). There was a strong negative correlation between eGFR vs. cortical T1 in both native and transplanted kidneys but medullary T1 and eGFR were correlated only in transplanted kidneys. These results suggest that the T1 variability between patients and at different levels of renal function may need to be considered when studying the kidney with functional MR methods which rely on T1 measurement.
Acknowledgments
Grant Support:
This research was supported by the National Institute of Health (NIH grants R01 DK 073680, R21 DK 070243)
References
- 1.Terrier F, Hricak H, Justich E, Dooms GC, Grodd W. The diagnostic value of renal cortex-to-medulla contrast on magnetic resonance images. Europ J Radiol. 1986;6:121–126. [PubMed] [Google Scholar]
- 2.Semelka RC, Corrigan K, Ascher SM, Brown JJ, Colindres RE. Renal corticomedullary differentiation: observation in patients with differing serum creatinine levels. Radiology. 1994;190:149–152. doi: 10.1148/radiology.190.1.8259395. [DOI] [PubMed] [Google Scholar]
- 3.Lee VS, Kaur M, Bokacheva L, et al. What causes diminished corticomedullary differentiation in renal insufficiency? J Magn Reson Imaging. 2007;25:790–795. doi: 10.1002/jmri.20878. [DOI] [PubMed] [Google Scholar]
- 4.Hricak H, Terrier F, Demas BE. Renal allografts: evaluation by MR imaging. Genitourinary Radiology. 1986;159:435–441. doi: 10.1148/radiology.159.2.3515420. [DOI] [PubMed] [Google Scholar]
- 5.Marotti M, Hricak H, Terrier F, Mcaninch JW, Thuroff JW. MR in renal disease: importance of cortical-medullary distinction. Magn Reson Med. 1987;5:160–172. doi: 10.1002/mrm.1910050207. [DOI] [PubMed] [Google Scholar]
- 6.de Bazelaire C, Duhamel GD, Rofsky NM, Alsop DC. MR imaging relaxation times of abdominal and pelvic tissues measured in vivo at 3.0 T: preliminary results. Radiology. 2004;230(3):652–659. doi: 10.1148/radiol.2303021331. [DOI] [PubMed] [Google Scholar]
- 7.Levey AS, Bosch JP, Lewis JB, Greene T, Rogers N, Roth D. A more accurate method to estimate glomerular filtration rate from serum creatinine: a new prediction equation. Ann Intern Med. 1999;130:461–470. doi: 10.7326/0003-4819-130-6-199903160-00002. [DOI] [PubMed] [Google Scholar]
- 8.Levey AS, Greene T, Kusek J, Beck G. A simplified equation to predict glomerular filtration rate from serum creatinine (abstract) J Am Soc Nephrol. 2000;11:155A. [Google Scholar]
- 9.National Kidney Foundation. K/DOQI clinical practice guidelines for chronic kidney disease: evaluation, classification, and stratification. Am J Kidney Dis. 2002;39(2 Suppl 1):S1–266. [PubMed] [Google Scholar]
- 10.Pluim JPW, Maintz JBA, Viergever MA. Mutual information based registration of medical images: a survey. IEEE Trans Med Imag. 2003;22(8):986–1004. doi: 10.1109/TMI.2003.815867. [DOI] [PubMed] [Google Scholar]
- 11.Henkelman RM. Measurement of signal intensities in the presence of noise in MR images. Med Phys. 1985;12(2):232–233. doi: 10.1118/1.595711. [DOI] [PubMed] [Google Scholar]
- 12.Gudbjartsson H, Patz S. The Rician distribution of noisy MRI data. Magn Reson Med. 1995;34(6):910–914. doi: 10.1002/mrm.1910340618. [DOI] [PMC free article] [PubMed] [Google Scholar]
- 13.Rosner B. Fundamentals of biostatistics. 5. Pacific Grove: Duxbury Press; 2000. pp. 562–567. [Google Scholar]
- 14.McGraw KO, Wong SP. Forming inferences about some intraclass correlation coefficients. Psychological Methods. 1996;1:30–46. (Correction: 1:390) [Google Scholar]
- 15.Brasch RC, Wesbey GE, Gooding CA, Koerper MS. MRI of transfusional hemosiderosis complicating thalassemia major. Radiology. 1984;150:767–771. doi: 10.1148/radiology.150.3.6695078. [DOI] [PubMed] [Google Scholar]
- 16.Terrier F, Hricak H, Revel D, et al. Magnetic resonance imaging and spectroscopy of the periarticular inflammatory soft-tissue changes in experimental arthritis of the rat. Investigative Radiology. 1985;20:813–823. doi: 10.1097/00004424-198511000-00009. [DOI] [PubMed] [Google Scholar]
- 17.Martirosian P, Klose U, Mader I, Schick F. FAIR True-FISP perfusion imaging of the kidneys. Magn Reson Med. 2004;51:353–361. doi: 10.1002/mrm.10709. [DOI] [PubMed] [Google Scholar]
- 18.Detre JA, Leigh JS, Williams DS, Koretsky AP. Perfusion imaging. Magn Reson Med. 1992;23:37–45. doi: 10.1002/mrm.1910230106. [DOI] [PubMed] [Google Scholar]
- 19.Detre JA, Zhang W, Roberts DA, et al. Tissue specific perfusion imaging using arterial spin labeling. NMR Biomed. 1994;7:75–82. doi: 10.1002/nbm.1940070112. [DOI] [PubMed] [Google Scholar]
- 20.Chen CW, Luo J, Parker KJ. Image segmentation via adaptive K-mean clustering and knowledge-based morphological operations with biomedical applications. IEEE Trans Image Process. 1998;7:1673–1683. doi: 10.1109/83.730379. [DOI] [PubMed] [Google Scholar]