

Abstract
Undifferentiated cell populations may influence tumor growth in malignant glioma. We investigated potential disruptions in the retinoic acid (RA) differentiation pathway that could lead to a loss of differentiation capacity, influencing patient prognosis. Expression of key molecules belonging to the RA differentiation pathway was analyzed in 283 astrocytic gliomas and was correlated with tumor proliferation, tumor differentiation, and patient survival. In addition, in situ concentrations of retinoids were measured in tumors, and RA signaling events were studied in vitro. Unlike other tumors, in gliomas expression of most RA signaling molecules increased with malignancy and was associated with augmented intratumoral retinoid levels in high-grade gliomas. Aberrantly expressed RA signaling molecules included i) the retinol-binding protein CRBP1, which facilitates cellular retinoid uptake; ii) ALDH1A1, capable of activating RA precursors; iii) the RA-degrading enzyme CYP26B1; and iv) the RA-binding protein FABP5, which can inhibit RA-induced differentiation. In contrast, expression of the RA-binding protein CRABP2, which fosters differentiation, was decreased in high-grade tumors. Moreover, expression of CRBP1 correlated with tumor proliferation, and FABP5 expression correlated with an undifferentiated tumor phenotype. CRBP1 and ALDH1A1 were independent prognostic markers for adverse patient survival. Our data indicate a complex and clinically relevant deregulation of RA signaling, which seems to be a central event in glioma pathogenesis.
In astrocytic gliomas, several recent findings support the existence of immature tumor cell populations that persist in an undifferentiated state associated with high tumorigenicity and therapy resistance.1–3 The occurrence of immature cells in these tumors might reflect resistance to physiological differentiation stimuli and/or impairment of central differentiation pathways. Retinoic acid (RA) signaling represents one of the best examined differentiation pathways. Among numerous vital functions, RA metabolism is indispensable for maturation of the central nervous system and for differentiation of distinct brain structures.4–6 Various types of human cancers show abnormalities in the RA signaling pathway.7–14 In particular, epithelial tumors, which originate from tissues that depend on a closely orchestrated balance between cellular proliferation and subsequent differentiation, show loss of RA signaling components involved in RA availability. This frequently includes altered expression of cellular retinol-binding protein 1 (CRBP1), an intracellular transport protein in charge of facilitating the uptake of RA precursor molecules,7–9 and of aldehyde dehydrogenase 1A1 (ALDH1A1), which is capable of activating RA precursors into the active RA metabolite,10,11 as well as of cellular retinoic acid binding protein 2 (CRABP2) and cellular retinoic acid binding protein 1 (CRABP1), two chaperone proteins that shuttle between different cellular compartments channeling RA to designated nuclear RA receptors or to endosomal degradation by cytochrome P450, family 26 members (CYP26), respectively.12–14
In addition, recent studies on breast tumor cells revealed a pathological involvement of the intracellular transport protein fatty acid binding protein 5 (FABP5) in neoplastic RA signaling.15,16 FABP5 was shown to inhibit RA-induced differentiation and induce survival/proliferation of tumor cells after diverting RA to an alternative pathway.15,16 Although several reports described altered expression or loss of function of these and other RA signaling molecules, knowledge about possible abnormalities concerning this crucial pathway in glial tumors remains scarce. In the present study, we investigated potential alterations in the RA pathway and analyzed their clinical relevance. In contrast to findings in other tumor entities,7–14 we observed a marked up-regulation of key molecules associated with increased RA availability and alternative, prosurvival RA usage in gliomas. This was accompanied by increased intratumoral levels of RA precursors and activated RA. Finally, we found that expression of CRBP1 and ALDH1A1, which is discussed as a potential stem cell marker in addition to its involvement in RA signaling, is significantly associated with poor clinical outcome independently of established prognostic factors. Our findings suggest that aberrant up-regulation of RA signaling molecules may be a central component in glioma pathogenesis, affecting patient prognosis.
Materials and Methods
Tissue Microarray
Our TMA consisted of histologically representative paraffin-embedded tumor tissue samples from 283 patients with astrocytic gliomas of World Health Organization (WHO) grades II to IV (see Supplemental Table S1 at http://ajp.amjpathol.org). All samples were derived from untreated primary tumors. In addition, the TMA included four samples of non-neoplastic brain derived from patients with non-tumor related diseases (two patients with cerebral hemorrhage, one patient with encephalocele, and one patient with apoplexia). Informed consent was obtained from each patient according to the research proposals approved by the Institutional Review Board at Heidelberg Medical Faculty. Patient characteristics are listed in Supplemental Table S1 (available at http://ajp.amjpathol.org). Patients involved in the study did not receive any retinoid-based treatment during the course of their disease.
Evaluation of TMA Staining
Before TMA staining, individual antigen expression was tested in a set of glioma tissues of WHO grade II to grade IV (n = 20 to 30, dependent upon the antigen) to establish suitable antigen evaluation categories based on antigen expression variability. Grading scores with uniform distribution of antigen expression levels among individual grading categories were chosen for TMA evaluation. Staining of different RA antigens was performed on subsequent TMA slides. Each tumor biopsy sample was evaluated at ×20 magnification by two independent investigators blinded to all clinical data. (B.C. and K.D. evaluated CYP26B1; B.C. and F.S.C. evaluated all other antigens.) Staining of TMA biopsy samples was semiquantitatively graded in an antigen-dependent manner according to the estimated percentage of positive cells covering the whole tissue spot (see Supplemental Table S2 at http://ajp.amjpathol.org). In case of interobserver variability, staining frequency on individual biopsy samples was counted manually. Average staining patterns from all biopsy samples of an individual tumor were taken as the final staining result.
Immunohistochemistry
Antibodies and antigen retrieval conditions are summarized in Supplemental Table S3 (at http://ajp.amjpathol.org). Primary antibodies used were as follows: rabbit monoclonal anti-ALDH1A1, mouse monoclonal anti-CRABP1 (both Abcam, Cambridge, UK), rabbit polyclonal anti-CYP26B1 (Sigma-Aldrich, Schnelldorf, Germany; St. Louis, MO), rabbit polyclonal anti-CRBP1 (Santa Cruz Biotechnology, Heidelberg, Germany; Santa Cruz, CA), mouse monoclonal anti-CRABP2 (Millipore, Schwalbach, Germany; Billerica, MA), rat monoclonal anti-FABP5 (R&D Systems, Wiesbaden, Germany), rabbit polyclonal anti-PPARD (Abcam, Cambridge, UK), mouse monoclonal anti-RARα (Millipore), mouse monoclonal anti-RARβ (Acris, Hiddenhausen, Germany), rabbit polyclonal anti-RARγ (Santa Cruz Biotechnology), mouse monoclonal anti-RXRα (R&D Systems), rabbit polyclonal anti-RXRβ (Millipore), and rabbit polyclonal anti-RXRγ (Millipore). Before TMA staining, specificity of primary antibodies was verified using corresponding isotype controls on glioma control tissues in equal concentrations as primary antibodies. Normal testis tissue was used as control for retinoid receptor expression analyses, kindly provided by the tissue bank of the National Center for Tumor Disease (NCT, Heidelberg, Germany; project 463) and was used in accordance with the regulations of the NCT tissue bank and the ethics commission of Heidelberg University.
Incubation with primary and secondary antibodies as well as detection with a Vectastain Elite ABC kit (Vector Laboratories, Burlingame, CA) was performed as described previously.17 Additional primary antibodies used for double immunofluorescence were mouse monoclonal anti-human nestin (1 μg/mL; R&D Systems) and mouse monoclonal anti-human Ki-67 (10 μg/mL, BD Pharmingen, Hamburg, Germany). Secondary antibodies were anti-mouse Alexa488 (4 μg/mL), anti-rat Alexa555 (4 μg/mL), and anti-rabbit Alexa555 (4 μg/mL; all Invitrogen, Karlsruhe, Germany; Carlsbad, CA). Confocal images were generated with a FluoView FV10i confocal laser scanning microscope (Olympus, Hamburg, Germany).
Flow Cytometry
For flow cytometry, cells were trypsinized and permeabilized with an Inside stain kit (Miltenyi Biotec, Bergisch-Gladbach, Germany; Auburn, CA), followed by incubation with rabbit polyclonal anti-human CYP26B1 (1.1 μg/mL; Sigma-Aldrich), CRABP2 (5 μg/mL), or FABP5 (5 μg/mL). Appropriate isotype controls were used according to the manufacturer's instructions. For cell viability assessment, 5 × 10⁵ tumor cells per probe were incubated with trypsin for 3 minutes at 37°C and were stained with propidium iodide (20 μg/mL in Nicoletti buffer). Cells were subjected to flow cytometric analysis using a BD FACSCalibur cytometer and Cell Quest software version 3.3 (BD Biosciences, Heidelberg, Germany; San Jose, CA).
Cell Culture Conditions
Primary glioblastoma samples were obtained from patients undergoing surgical resection according to the research proposals approved by the Institutional Review Board at the Medical Faculty Heidelberg. Written consent was obtained from each patient. Tissues were mechanically dissociated and grown as adherent monolayer in Dulbecco's modified Eagle's medium containing 10% fetal calf serum or as cell suspensions under serum-free culture conditions as previously described.18 The following cell lines derived from primary glioblastomas were used: NCH82, NCH89, NCH421k, NCH440, NCH441, NCH525, and NCH644. For functional studies, cells were grown for 7 to 14 days in the presence of RA, 13-cis-RA (both Sigma-Aldrich), or BMP4 (Provitro, Berlin, Germany). Medium changes were performed every 3 days.
Isolation of mRNA from Tumor Tissues
A small set of tumor tissues (WHO grade II, n = 5; WHO grade III, n = 5; and WHO grade IV, n = 20) was gathered according to the research proposals approved by the Institutional Review Board at the Medical Faculty Heidelberg. Written consent was obtained from each patient. Tissues were homogenized using an Ultra-Turrax homogenizer (Ika, Staufen, Germany; Wilmington, NC), and RNA was isolated using an RNeasy mini kit (Qiagen, Hilden, Germany; Valencia, CA), according to the manufacturer's instructions.
Quantitative Real-Time PCR
For quantitative real-time PCR, 1 μg of total RNA was subjected to reverse transcription with a Transcriptor first-strand cDNA synthesis kit (Roche, Mannheim, Germany). Each cDNA sample was analyzed in duplicate using a LightCycler PCR system (Roche). Two endogenous housekeeping genes [ZFAND5 (previously ZNF216) and PITPNB] were used for internal normalization. Following primers were used in the study: ZNF216 forward 5′-AACTACCCCGAAAACAGAGGT-3′; ZNF216 reverse 5′-GGGCTGAGAAACTGATGGAC-3′; PITPNB forward 5′-CGAGACTCAGAAAGAACTAGAAACAA-3′; PITPNB reverse 5′-TGACCCTACAGGGGACTCAT-3′; CYP26A1 forward 5′-GCAGCCACATCTCTGATCACT-3′; CYP26A1 reverse 5′-TGTTGTCTTGATTGCTCTTGC-3′; CYP26B1 forward 5′-GGAGCACGGGAAGGAGAT-3′; CYP26B1 reverse 5′-ATAGGCCGCAAAGATCAGC-3′; CYP26C1 forward 5′-GCCCTCGACCTAATCATTCA-3′; CYP26C1 reverse 5′-GAGCTCCACAGCCGACTC-3′; CRBP1 forward 5′-AGGCATAGATGACCGCAAGT-3′; CRBP1 reverse 5′-ACCCTTCTGCACACACTGG-3′; ALDH1A1 forward 5′-CCAAAGA CATTGATAAAGCCATAA-3′; ALDH1A1 reverse 5′-CACGCCATAGCAATTCACC-3′; CRABP2 forward 5′-TGCTGAGGAAGATTGCTGTG-3′; CRABP2 reverse 5′-CCCATTTCACCAGGCTCTTA-3′; CRABP1 forward 5′-AAGGCTTTGAGGAGGAGACC-3′; CRABP1 reverse 5′-TCCCCTTCAAGAAGAGTTTGC-3′; FABP5 forward 5′-GAGTGGGATGGGAAGGAAAG-3′; FABP5 reverse 5′-GATCCGAGTACAGGTGACATTG-3′; RARβ forward 5′-TCGGCACACTGCTCAATC-3′; RARβ reverse 5′-GAAGCAGGGTTTGTACACTCG-3′.
Cell Proliferation
Proliferation assays were performed using a BrdU labeling and detection kit III (Roche). Briefly, tumor cells were seeded in eight replicas on 96-well plates at a cell density of 5 × 10³ cells. After 24 hours, cells were treated with retinoids and allowed to grow for additional 48 hours, followed by 24 hours of BrdU exposure and subsequent analysis according to the manufacturer's instructions.
RA Detection
Detection of endogenous RA and retinol levels was performed in a set of tumor tissues with corresponding patient sera for 9/11 patients (5 tumors WHO grade II and 6 tumors WHO grade IV), which were all gathered according to the research proposals approved by the Institutional Review Board at the Medical Faculty Heidelberg. Written consent was obtained from each patient.
All-trans-RA, 9-cis-RA, 13-cis-RA, and retinol were quantified in serum and tumor tissues using liquid/liquid-extraction and high performance liquid chromatography with UV detection on a Thermo Fisher Scientific system (P4000 pump, AS3000 sampler, and UV6000 diode array detector; Thermo Fisher Scientific, Waltham, MA). In principle, the methods were based on descriptions by Schmidt et al,19 but were optimized in chromatography and sample extraction procedures.
In brief, high performance liquid chromatography on a Synergi Hydro-RP column (150 mm × 2.1 mm; 4 μm; 80 A; Phenomenex, Aschaffenburg, Germany) was performed using isocratic conditions of 23% ammonium acetate buffer (5 mmol/L adjusted to pH 3.5 by acetic acid), 32% methanol, and 45% acetonitrile as eluent from 0 minutes to 11 minutes. Thereafter (11 minutes to 12.5 minutes), the organic content was increased to 50% methanol and 50% acetonitrile and held isocratic until 16 minutes. The flow rate was 0.35 mL/min, and the column was heated to 40°C. The injection volume was 20 μL, and the analytes were detected within 16 minutes at the UV wavelength of 350 nm. The extraction of plasma (500 μL) and tissue (500 mg) samples was performed by adding internal standard solution (acitretin, 25 μL) and borate buffer (pH 10.0, 500 μL). Tissue samples were homogenized using an Ika Ultra Turrax system. After vortexing and addition of 5 mL ethyl acetate, samples were shaken overhead (10 minutes) and subsequently centrifuged at 3000 × g for 10 minutes. The organic layer (4 mL) was transferred into separate tubes and reduced to dryness in a stream of nitrogen at 40°C. Subsequently, the residue was reconstituted in 200 μL high performance liquid chromatography eluent.
The 9-cis-, 13-cis-, all-trans-RA, and retinol were purchased from Sigma-Aldrich (Taufkirchen, Germany). Acitretin was supplied by Toronto Research Chemicals (TRC, Toronto, ON, Canada). Calibrations for all analytes in plasma (tissue) were done in the range of 3.90 ng/mL to 500 ng/mL (3.90 ng/g to 500 ng/g), except that retinol was calibrated from 3.90 ng/mL to 1000 ng/mL (ng/g). The lower limit of quantification in plasma (tissue) was 3.90 ng/mL (3.90 ng/g) for all analytes. The assay was validated using quality control samples in the upper, middle, and lower calibration ranges according to the procedures recommended by the U.S. Food and Drug Administration (Guidance for Industry: Bioanalytical Method Validation, May 2001; http://www.fda.gov/downloads/Drugs/GuidanceComplianceRegulatoryInformation/Guidances/UCM070107.pdf, last accessed November 15, 2010). The overall accuracy (including all analytes) varied from +0.7% to +10.3% for plasma and from −3.8% to +4.8% for tissue; the overall precision ranged from 2.3% to 6.3% in plasma and from 2.1% to 8.3% for tissue (%CV batch-to-batch).
Statistical Analysis
Possible associations between overall survival (OS) and average staining results were investigated by log-rank tests and reported as Kaplan-Meier plots. To account for the influence of established prognostic factors on OS, WHO grade, patient's age at diagnosis, and extent of tumor resection were included in subsequent multivariate Cox regression analyses. Recurrent tumors, patients with incomplete clinical follow-up, and patients enrolled in experimental therapies were excluded from survival analysis. The OS was calculated from date of first diagnosis to the time point of death and was censored for patients still alive at the end of study (November 30, 2009). Mean follow-up time was 10.7 years (±4.3 years). Patients were followed from date of first diagnosis to the end of study or were censored at death. If a patient could not be contacted (n = 11), the date of last visit was taken as the censored endpoint. The relationship between antigen expression and WHO grade was quantified by Spearman's rank correlation ρ. To explore expression similarities among the investigated antigens, a distance matrix was built based on estimated ρ correlations and antigens were clustered based on this matrix using the flexible β distance. Calculations were performed using the statistical software environment R, version 2.4.1 (http://www.r-project.org). In vitro data on the induction of CYP26 molecules after RA treatment were analyzed using two-sided t-tests. Data on the expression of transcripts of RA key players in WHO grade II, III, and IV, as well as data on retinoid concentrations in tissues, were analyzed using a two-sided Mann-Whitney test. Probability values of P < 0.05 were considered statistically significant.
Results
Expression of Molecules in Charge of Fostering RA Availability Increases with Tumor Malignancy
To study key molecules regulating the availability of intracellular RA, we analyzed protein expression of CRBP1, which is involved in retinol uptake from the extracellular microenvironment,20 and of ALDH1A1, which is in charge of activating retinol to the biologically effective RA21 on our TMA. Surprisingly and unlike previous studies reporting down-regulation of CRBP1 and ALDH1A1 in epithelial cancers,7–14 both proteins showed increased expression levels in glioma, compared with non-neoplastic brain tissue (Figure 1, A and B). Strong cytoplasmic immunoreactivity of CRBP1 was detected in the vast majority of glioma samples (Figure 1A). At the same time, frequency and staining intensity of CRBP1-positive cells increased with tumor malignancy (ρ = 0.54, P < 0.001; Figure 1C). We were able to substantiate these data on the mRNA level in a set of glioma tissues (n = 30). In fact, the average CRBP1 mRNA expression was more than 30-fold higher in WHO grade IV tumors, compared with WHO grade II and III gliomas (see Supplemental Figure S1A at http://ajp.amjpathol.org). As in the case of CRBP1, most tumor samples showed cytoplasmic ALDH1A1 immunoreactivity (Figure 1B), and staining frequency increased with tumor malignancy (ρ = 0.17, P = 0.012;), being highest in WHO grade IV, on both mRNA and protein levels (Figure 1D; see also Supplemental Figure S1B at http://ajp.amjpathol.org).
Figure 1.

WHO grade-dependent distribution of CRBP1 and ALDH1A1 staining frequencies and association of expression levels with patient survival. A, B: Immunohistochemical staining showing a WHO grade-dependent increase in the expression of the intracellular retinol-binding protein CRBP1 (A) and the RA synthesizing enzyme ALDH1A1 (B). Insets: Immunoreactive cells at higher magnification. Scale bar = 100 μm (main images); 25 μm (insets). C, D: Distribution of staining frequencies for CRBP1 (C) and ALDH1A1 (D) in astrocytic gliomas according to WHO grade. There was a significant positive correlation of staining frequencies with WHO grade for CRBP1 (P < 0.001) and ALDH1A1 (P = 0.012). E, F: Kaplan-Meier plots indicating associations between expression scores of CRBP1 (E) or ALDH1A1 (F) and patient overall survival. Increased expression of CRBP1 and ALDH1A1 was significantly associated with poor patient survival (P < 0.001 and P = 0.03, respectively). G, H: Quantification of retinoid levels in serum from patient tumor (G) and in corresponding tumor tissues (H). Retinoid levels in WHO grade IV tumors were significantly increased (P = 0.004), compared with low-grade glioma tumor tissues. ATRA, all-trans-retinoic acid; RA, retinoic acid.
In light of our results suggesting a multifaceted overexpression of RA signaling molecules in high-grade tumors, we investigated the clinical relevance of our findings in terms of potential associations between expression of CRBP1 or ALDH1A1 and patient OS. Indeed, increased expression of CRBP1 and ALDH1A1 was significantly associated with shorter patient survival (Figure 1, E and F; see also Supplemental Figure S1, A and B, at http://ajp.amjpathol.org; for P values and hazard ratios, see Supplemental Table S4 at http://ajp.amjpathol.org). Given that our data suggested aberrant expression of molecules fostering RA precursor uptake and activation, we measured retinoid concentrations in native tumor tissues and corresponding patient sera to calculate the ratio of extra- and intracellular retinoids. Of note, in a study sample comprising low-grade gliomas (WHO grade II; n = 5) and high-grade gliomas (WHO grade IV; n = 6), most of the tumor samples contained high intracellular retinol levels, which in some cases even exceeded the extracellular concentrations and indicated efficient retinol uptake from the extracellular space (Figure 1, G and H). Furthermore, biologically active retinoids such as all-trans-RA, 13-cis-RA, and 9-cis-RA were detectable in most of the tumors, indicating biological activation of retinol in these tissues. Most importantly, concentrations of these activated retinoids were higher in WHO grade IV tumors, compared with low-grade tumors. Altogether, these results are consistent with our hypothesis of an aberrant expression of RA signaling molecules in charge of fostering cellular retinoid uptake and activation.
Expression of the Natural RA Chaperone Protein Decreases with Tumor Malignancy
The unexpected up-regulation of RA availability prompted us to analyze expression of CRABP2, designated to route RA into the nucleus to its cognate receptors to facilitate differentiation.20 CRABP2 was detectable in the cytoplasm and in the nucleus of tumor cells (Figure 2A). Although we did not detect any changes on the mRNA level, CRABP2 protein expression clearly decreased with tumor malignancy and was lowest in WHO grade IV tumors (ρ = −0.29, P < 0.001; Figure 2B; see also Supplemental Figure S1C at http://ajp.amjpathol.org). Moreover, decreased protein expression of CRABP2 was significantly associated with shorter patient survival (Figure 2C; see also Supplemental Table S4 at http://ajp.amjpathol.org). Because previous studies have shown that CRABP2 can translocate into the cell nucleus on RA binding,15,22 we further assessed frequencies of nuclear CRABP2 staining (Figure 2D) as a surrogate for an activated RA pathway and calculated potential associations between expression levels and clinical data. In agreement with our previous results, nuclear CRABP2 immunoreactivity decreased with tumor malignancy (ρ = −0.14, P = 0.04; Figure 2E), and low protein expression levels were significantly associated with shorter OS (Figure 2F; see also Supplemental Figure S1C and Supplemental Table S4 at http://ajp.amjpathol.org).
Figure 2.

WHO grade-dependent distribution of CRABP2 immunoreactivity and association of expression levels with patient survival. A: Immunohistochemical staining showing a WHO grade-dependent decrease in the expression of the natural RA-binding protein CRABP2. Insets: Immunoreactive cells at higher magnification. Scale bar = 100 μm (main images); 25 μm (insets). B: Distribution of overall CRABP2 staining frequencies. C: Kaplan-Meier plot indicating associations between staining frequencies of overall CRABP2 and patient survival. D: Immunohistochemical staining showing a WHO grade-dependent decrease in nuclear CRABP2 staining (arrows). E: Distribution of nuclear CRABP2 staining frequencies. F: Kaplan-Meier plot indicating associations between staining frequencies of nuclear CRABP2 and patient survival. There was a significant inverse correlation of staining frequencies with WHO grade for overall CRABP2 (P < 0.001) and nuclear CRABP2 (P = 0.04), indicating associations between staining frequencies and overall survival. Decreased expression of both overall CRABP2 and nuclear CRABP2 was significantly associated with poor patient survival (P = 0.001 for both).
Physiological Retinoic Acid Receptors Show a Tumor Grade-Dependent Expression
In the nucleus, CRABP2-bound RA interacts with heterodimeric RA receptors, composed of a retinoid X receptor (RXR) and a retinoid acid receptor (RAR), each of which can occur as α, β, or γ variants.23 Because retinoid receptor expression is a prerequisite for physiological RA activity,23 we further analyzed the expression of all six retinoid receptor variants on our TMA. Nuclear retinoid receptor expression was clearly discernible for all three RXR receptors (see Supplemental Figure S2 at http://ajp.amjpathol.org). In contrast to RXRs, RAR receptors were immunoreactive both in the nucleus and in the cytoplasm of tumor cells (see Supplemental Figures S2 and S3A at http://ajp.amjpathol.org). Intriguingly, staining frequencies of RARβ, RXRα, and RXRβ positively correlated with WHO grade (ρ = 0.26, P < 0.001; ρ = 0.22, P < 0.001; and ρ = 0.20, P = 0.002, respectively).
Because genes encoding for retinoid receptors are RA target genes themselves,23 we wondered whether augmented expression of these receptors might reflect increased intracellular RA levels. Using therapeutic doses of RA (1 μmol/L), we were able to trigger strong induction of transcripts for RARβ in primary glioblastoma cell lines. Application of concentrations close to physiological RA levels (5 nmol/L RA), however, resulted in a weak induction (on average, approximately 34 times lower induction) of RARβ, a level that, in the absence of RA RARβ expression, was almost undistinguishable from background (see Supplemental Figure S3B at http://ajp.amjpathol.org). These results likely indicate that increased expression of retinoid receptors reflects increased intracellular availability of RA in gliomas, and that physiological RA levels might be less efficient at inducing a RA-triggered response in glioma cells. Of note, univariate analysis revealed that increased expression of RXRα was associated with short patient survival. For RXRβ, a trend toward a poorer survival was observed (see Supplemental Table S4 at http://ajp.amjpathol.org). Thus, together with our results on CRABP2, these findings add support to the notion of a complex disturbance in the differentiation-promoting arm of the RA pathway.
The RA-Degrading Enzyme CYP26B1 Can Be Induced in Vitro and in Vivo and Increases with Tumor Malignancy
Given the increased availability of RA, we further focused our analyses on the expression of molecules that control RA degradation. Notably, CRABP1, which channels RA to endosomal compartments, passing it on to degradation by CYP26 enzymes,12 showed increased expression levels in tumor biopsy samples, compared with nontumorous brain (Figure 3A), although expression of CRABP1 was similarly distributed among different WHO grades (ρ = 0.02, P = 0.81; Figure 3C; see also Supplemental Figure S4A at http://ajp.amjpathol.org) and was not associated with patient survival (Figure 3E). Whether CRABP1 in astrocytic gliomas can participate in the degradation of RA depends on the availability of catabolic CYP26 enzymes. CYP26 proteins constitute a group of P450 cytochrome-dependent enzymes that are induced in the presence of RA and are capable of degrading RA.24 Until now, only three different CYP26 enzymes with tissue-specific expression and distribution have been described, namely, CYP26A1, -B1, and -C1.24
Figure 3.
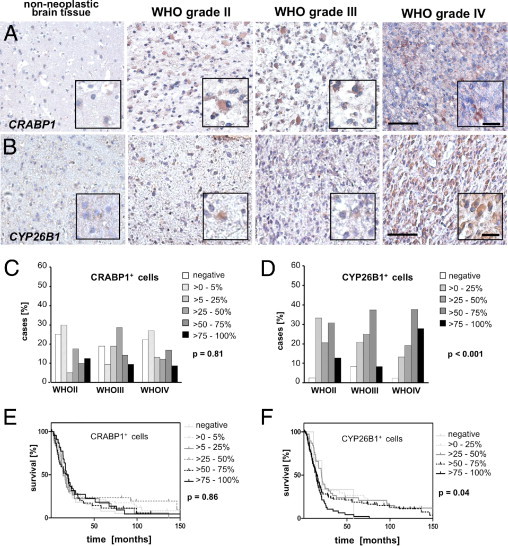
Distribution of CRABP1 and CYP26B1 staining frequencies and association between expression levels and patient survival. A: Immunohistochemical staining showing an increased expression of the intracellular retinoic acid-binding protein CRABP1 in tumors, compared with nontumorous brain. B: Immunohistochemical staining showing a WHO grade-dependent increase in the expression of the RA-degrading enzyme CYP26B1. Insets: Immunoreactive cells at higher magnification. Scale bar = 100 μm (main images); 25 μm (insets). C, D: Distribution of staining frequencies of CRABP1 (C) and CYP26B1 (D) across WHO grades. There was no significant correlation of CRABP1 staining frequencies and WHO grade (P > 0.05), but CYP26B1 immunoreactivity and WHO grade were significantly correlated (P < 0.001). E, F: Kaplan-Meier plots indicating associations between CRABP1 (E) or CYP26B1 (F) expression scores and patient overall survival. Increased staining frequencies for CYP26B1 were significantly associated with shorter patient survival (P = 0.04). Increased expression of CRABP1 was not significantly associated with patient survival (P > 0.05).
In the absence of reports on expression of CYP26 enzymes in gliomas, we first analyzed their expression in primary glioblastoma cell lines (n = 6) in the presence and absence of RA. Although expression of CYP26A1, -B1, and -C1 was marginal in untreated cells, CYP26B1 was markedly induced after RA exposure (Figure 4A). This effect was dose-dependent and retinoid-specific [ie, not inducible by other differentiation agents, such as bone morphogenetic proteins (BMPs)], and was confirmed on the mRNA level as well as on the protein level (Figure 4, B–D). Because serum is known to contain substantial amounts of RA,25 we further validated our results on cell lines cultivated in the absence of serum (n = 4). In accord with our previous data, CYP26B1 mRNA levels were insensitive to BMP treatment, but increased significantly on exposure to retinoids, without significant changes in cell viability (see Supplemental Figure S5, A and B, at http://ajp.amjpathol.org). Furthermore, CYP26B1 induction could be recapitulated in fresh glioma tissue explants after RA exposure (n = 3/5), thus excluding possible in vitro culture artifacts (Figure 4E). Given these results, and assuming that CYP26B1 is the most relevant RA-metabolizing enzyme in gliomas, we further analyzed CYP26B1 expression immunohistochemically on our TMA. CYP26B1 immunoreactivity was found in virtually all glioma samples and at higher levels, compared with non-neoplastic brain tissue (Figure 3, B and D). Altogether, frequencies of positive cells increased with tumor malignancy (ρ = 0.25, P < 0.001; Figure 3D), on both protein and mRNA levels, although increments in CYP26B1 transcripts did not reach statistical significance (Figure 4E; see also Supplemental Figure S4B at http://ajp.amjpathol.org). In addition, CYP26B1 protein expression was significantly associated with shorter patient survival (Figure 3F; see also Supplemental Table S4 at http://ajp.amjpathol.org).
Figure 4.
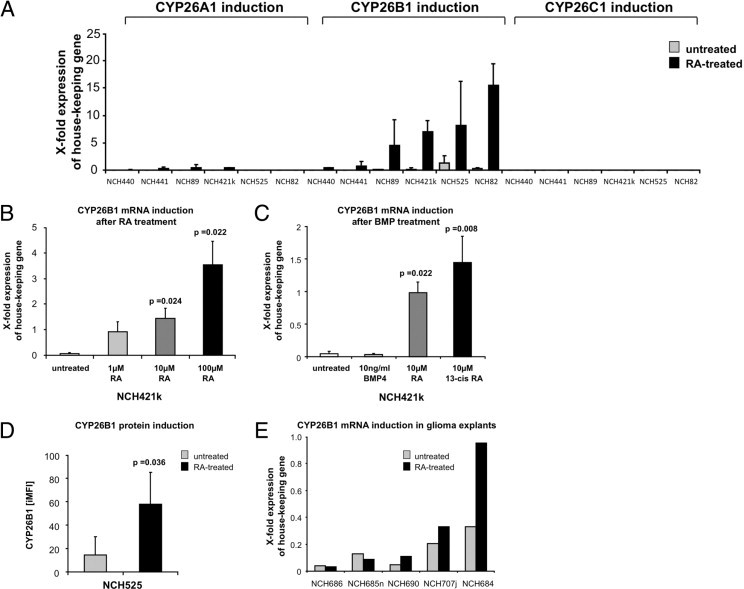
Expression and induction of CYP26. A: Quantitative PCR analysis of CYP26A1, CYP26B1, and CYP26C1 transcripts in untreated glioma cells, compared with cells treated with 10 μmol/L RA. B: Quantitative PCR analysis of CYP26B1 transcripts in untreated glioma cells, compared with cells treated with increasing doses of RA; NCH421k serves as a representative example. C: Quantitative PCR analysis of CYP26B1 transcripts in untreated glioma cells, compared with cells treated with BMP4, RA or 13-cis-RA; NCH421k serves as a representative example. D: Quantification of CYP26B1-protein in untreated glioma cells, compared with cells treated with 10 μmol/L RA as assessed by flow cytometry; NCH525 serves as a representative example. E: Quantitative PCR analysis of CYP26B1 transcripts in untreated, fresh glioblastoma explants, compared with the corresponding explants exposed to 100 μmol/L all-trans-retinoic acid for 24 hours. Data are reported as means ± SD from two (A), three (B and C), or four (D) independent experiments. There were significant differences between untreated controls and retinoid-treated samples (P = 0.036 to P = 0.008).
FABP5, a Potential Candidate for Alternative RA Usage, Is Strongly Expressed in Gliomas, and Its Expression Increases with Tumor Malignancy
Based on our results suggesting a clinically relevant up-regulation of RA molecules in high-grade gliomas, which likely affects intracellular RA availability, it is tempting to speculate that increased expression of CRBP1 and ALDH1A1, confers growth advantage to glioma cells and is specifically selected during tumor growth/tumor progression. Of note, previous studies on breast cancer cell lines reported an involvement of the intracellular transport protein FABP5 in RA signaling.15,16 FABP5 was able to bind RA and to divert it into an alternative metabolic pathway that used PPARD as an alternative receptor and could trigger proliferation and survival of tumor cells. This effect was further enhanced when the natural RA-binding protein CRABP2 was lost.
In light of these reports and our present findings indicating low CRABP2 expression in high-grade gliomas, we further analyzed expression of FABP5 and the alternative receptor PPARD. Cytoplasmic FABP5 was weakly expressed in non-neoplastic brain tissues, but was found in the majority of tumor samples. Its expression markedly increased with WHO grade (ρ = 0.37, P < 0.001) and was highest in WHO grade IV tumors, on both mRNA and protein levels. In addition, increased FABP5 expression was significantly associated with shorter patient survival (Figure 5, E and G; see also Supplemental Figure S4C and Supplemental Table S4 at http://ajp.amjpathol.org). Previous studies have reported that FABP5 and CRABP2 can compete for cytoplasmic RA and translocate into the cell nucleus on RA binding.15,22,26 Although cytoplasmic FABP5 serves as a chaperone protein for diverse metabolic compounds, nuclear translocation exclusively succeeds RA binding.15 Indeed, nuclear FABP5 immunoreactivity was confirmed by confocal microscopy scanning in primary glioma tissues, suggesting an involvement of FABP5 in RA signaling (Figure 5, B–D). Based on this observation, we assessed frequencies of nuclear FABP5 as a surrogate for a potential alternative RA pathway (see Supplemental Figure S6A at http://ajp.amjpathol.org) and calculated associations between expression levels and clinical data. Of note, nuclear FABP5 expression increased with tumor malignancy (ρ = 0.24, P < 0.001; Figure 5F) and was significantly associated with shorter OS (Figure 5H; see also Supplemental Table S4 at http://ajp.amjpathol.org). In contrast to FABP5, PPARD expression was unrelated to WHO grade (ρ = 0.05, P = 0.41) or patient survival (see Supplemental Figure S6B and Supplemental Table S4 at http://ajp.amjpathol.org).
Figure 5.
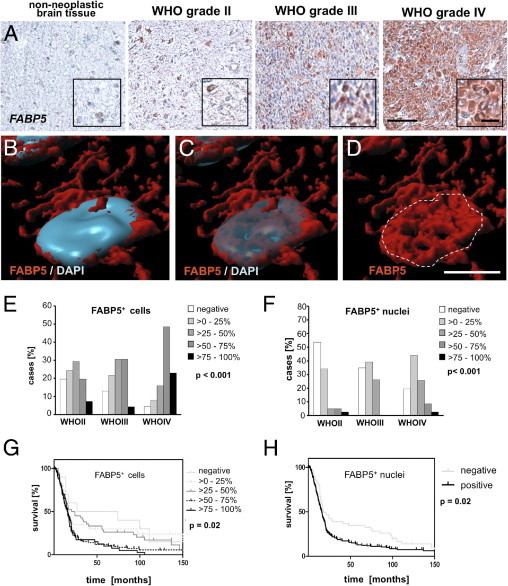
WHO grade-dependent distribution of FABP5 immunoreactivity and association of expression levels with patient survival. A: Immunohistochemical staining showing a WHO grade-dependent increase in the expression of the alternative RA-binding protein FABP5. Insets: Immunoreactive cells at higher magnification. Scale bar = 100 μm (main images); 25 μm (insets). B–D: Rendered confocal microscope scan showing an immunofluorescent staining of nuclear FABP5 expression (red) combined with nuclear DAPI staining (blue) as both opaque and transparent overlay in a representative primary glioblastoma. Scale bar = 5 μm. E, F: Distribution of overall FABP5 (E) and nuclear FABP5 (F) staining frequencies in astrocytic gliomas according to WHO grade. Staining frequencies of overall FABP5 and nuclear FABP5 were significantly associated with WHO grade (P < 0.001 for both). G, H: Kaplan-Meier plots indicating associations between staining frequencies of overall FABP5 (G) or nuclear FABP5 (H) and patient survival. Increased expression of overall FABP5 and of nuclear FABP5 was significantly associated with poor patient survival (P = 0.02 for both).
To determine whether primary glioblastoma cell cultures retain expression of the downstream chaperone proteins capable of influencing the intracellular distribution of RA, we measured protein levels of FABP5 and CRABP2 in a set of cell lines isolated from primary glioblastomas (n = 3). We found that all cell lines expressed high levels of FABP5 and low levels of CRABP2, thus mirroring in situ expression levels in WHO grade IV tumors (see Supplemental Figure S7A at http://ajp.amjpathol.org). Based on this screening, we concluded that our cell lines might serve as models to screen for alternative RA signaling. Of note, on RA exposure one of three cell lines responded with an increase in proliferation as assessed by BrdU incorporation, suggesting that RA may act as a proproliferative agent in some cell lines (see Supplemental Figure S7B at http://ajp.amjpathol.org).
Increased Expression of CRBP1 Correlates with Increased Tumor Cell Proliferation, and Increased FABP5 Levels Are Associated with Expression of a Stem Cell-Related Intermediate Filament
Because aberrant expression of RA signaling key players appears to be a distinct event in WHO grade IV gliomas, we sought to explore whether increased expression of individual RA antigens in glioblastoma was correlated with either tumor cell proliferation or an immature tumor phenotype. To this end, we resorted to a previously compiled data set generated with the same TMA,27 which included expression analyses of the proliferation marker Ki-67, as well as the intermediate filament nestin and the transcription factor SOX2, two classical markers for immature cells of neoplastic and non-neoplastic origin.28–30 Correlation of staining frequencies with expression of RA signaling molecules in glioblastoma revealed a positive correlation of CRBP1 with Ki-67 (ρ = 0.27, P < 0.001) and a positive correlation of nestin with FABP5 (ρ = 0.23, P = 0.003), both of which could be confirmed by double immunofluorescent staining (Figure 6, A and B). In addition, CRBP1 frequencies correlated with Sox2 expression (ρ = 0.20, P = 0.007), and FABP5 showed an association with Sox2 staining (ρ = 0.12; P = 0.13, Figure 6C).
Figure 6.
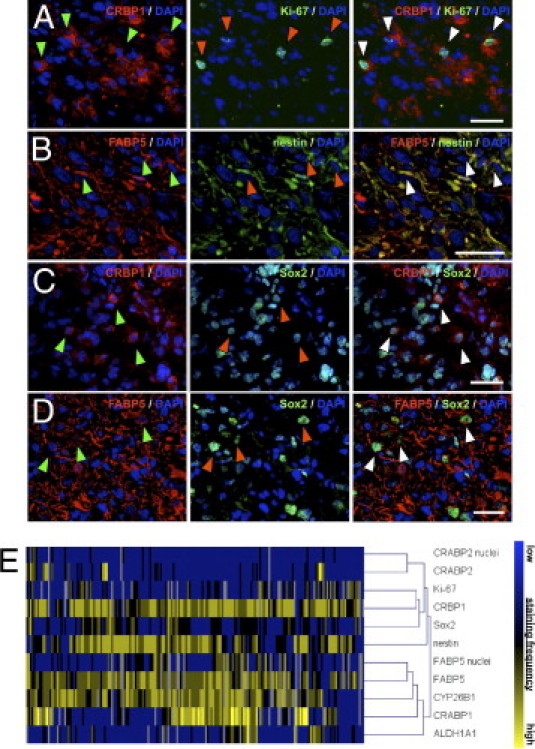
Colocalization of RA antigens with the proliferation marker Ki-67, the intermediate filament nestin, and the transcription factor Sox2. A–D: Immunofluorescent staining showing a colocalization of CRBP1 (red) and the proliferation marker Ki-67 (green) in a subset of glioma cells (A), as well as a colocalization of FABP5 (red) and the stem cell-related filament nestin (green) (B). Colocalization of the stem cell-associated transcription factor Sox2 (green) with CRBP1 (red) (C) and FABP5 (red) (D). DAPI (blue) was used for counterstaining throughout. Staining is shown in representative primary glioblastoma tissues. Arrowheads indicate double-positive cells. Scale bars = 30 μm. E: Cluster analysis summarizing staging correlations among RA antigens, Ki-67, nestin, and Sox2 expression in glioblastomas (WHO grade IV).
Taking into account that RA pathway molecules are interrelated in a complex signaling network, we further calculated potential correlations between up-regulated RA signaling components in glioblastomas. Of note, correlation analyses revealed that molecules fostering RA precursor uptake were correlated with proteins facilitating retinoid activation or RA degradation (see Supplemental Figure S8B at http://ajp.amjpathol.org): CRBP1 showed a strong positive correlation with ALDH1A1 (ρ = 0.26, P < 0.001) and with CYP26B1 (ρ = 0.24, P = 0.002). In addition, CYP26B1 expression was positively correlated with CRABP1 (ρ = 0.25, P = 0.001) and ALDH1A1 (ρ = 0.18, P = 0.026). Notably, CYP26B1 expression was also positively correlated with FABP5 immunoreactivity (ρ = 0.23, P = 0.004), but we found no significant correlation of FABP5 with other RA signaling components. Corroborating these results, cluster analyses of all RA antigens correctly identified two main groups: FABP5, CYP26B1, CRABP1, and ALDH1A1 in one group and Ki-67, CRBP1, Sox2, nestin, and CRABP2 in the other group (Figure 6D).
Elevated Expression of Signaling Molecules Responsible for RA Availability as Well as Loss of Retinoid Receptors Is Associated with Poor Patient Survival Independently of Prognostic Confounders
Because our results suggested a clinically relevant alteration in the expression of RA signaling molecules, we went on to study whether associations with patient survival would prevail even after adjustment for known prognostic factors such as WHO grade, patient age at diagnosis, and extent of tumor resection. Using multivariate Cox regression analyses, we were able to identify a significant, independent association between OS and ALDH1A1 [P = 0.02; hazard ratio (HR) = 1.20 (95% confidence interval (CI) = 1.04–1.40)], as well as between OS and high CRBP1 expression levels [P = 0.03; HR = 1.42 (95% CI = 1.04–1.92)]. In addition, in WHO grade IV tumors, increased expression of ALDH1A1 was associated with poor OS, again independently of the abovementioned prognostic factors [P = 0.03 HR 1.20 (95% CI = 1.02 to 1.40); for P values and hazard ratios; see Supplemental Table S5 at http://ajp.amjpathol.org]. Notably, multivariate Cox regression analyses could not confirm the association between increased expression of RXRα and shorter patient survival, suggesting that this association was largely due to the WHO grade-dependency of the antigens. In WHO grade IV tumors, however, increased RXRβ expression turned out to be associated with better patient survival, independently of the abovementioned confounders. Altogether, our results strongly suggest that aberrantly expressed molecules involved in RA availability, as well as loss of certain differentiation receptors, are independent prognostic markers for an adverse patient survival. Based on the observed expression pattern of CRABP2 and FABP5, these data hint at the intriguing possibility of an alternative RA signaling pathway in astrocytic gliomas.
Discussion
The present study provides strong evidence for a unique aberrant expression of RA signaling molecules in glial tumors, which is associated with increased intratumoral retinoid availability and an unfavorable outcome in glioma patients (for a schematic summary, see Supplemental Figure S8A at http://ajp.amjpathol.org). In contrast to other tumor entities,7–14 glial tumors featured a malignancy-dependent increase in the expression of molecules belonging to the RA synthesis machinery. This seemed to be further aggravated by augmented expression of a molecule involved in an alternative RA signaling, capable of promoting tumor growth.15,16 At the same time, however, the physiological differentiation-inducing pathway appeared to be attenuated with increasing tumor malignancy. In agreement with this hypothesis and accounting for the clinical relevance of aberrant RA signaling in gliomas, loss of the physiological retinoid receptor RXRβ and overexpression of two proteins regulating RA availability (CRBP1 and ALDH1A1) proved to be independent prognostic events associated with an adverse survival.
In recent years, there have been numerous independent reports of the occurrence of undifferentiated tumor cells in human cancers throughout the body.1,2,31–34 In glial tumors, increased numbers of tumor cells expressing stem cell-associated markers such as AC133 and the intermediate filament nestin are associated with poor patient survival and earlier tumor recurrence.28,35 Bearing in mind the aberrant expression levels of molecules involved in RA availability, as well as the increased intratumoral retinoid levels described in the present study (CRBP1, ALDH1A1), these seemingly contrary observations raise the intriguing question of whether undifferentiated glioma cells can escape physiological antitumor influences of RA.18 In support of this notion, we observed a strong correlation between expression of CRBP1 and tumor cell proliferation, between CRBP1 and the stem cell-related transcription factor SOX2, and between FABP5 and the stem cell-associated protein nestin. These observations may point to an alternative utilization of retinol and RA, other than inducing physiological differentiation. Concordantly, RA seemed to act as a proproliferative agent in vitro in one of our cell lines, and these results thus constitute an unexpected finding that is in good agreement with the hypothesis of an alternative RA usage.
In a series of pioneering experiments, Schug et al15,16 demonstrated that FABP5 and CRABP2 compete for RA binding in tumor cells derived from the transgenic mammary cancer mouse model MMTVneu. Low levels of CRABP2 along with elevated expression of FABP5 facilitated RA binding of FABP5. FABP5 subsequently translocated into the nucleus, inducing proliferation and survival of tumor cells through activation of the survival factor Akt. In light of these results, it is tempting to speculate that glioma cells resort to increased FABP5 levels to convert RA from a differentiation-inducing to an antiapoptotic, prosurvival agent.15,16 In line with this concept, elevated ALDH1A1 expression in our study sample was associated with poor clinical outcome independently of known prognostic confounders. Notably, ALDH1A1 activity has been used to enrich undifferentiated progenitor cells in various healthy and cancerous tissues.36–42 Moreover, several studies have described a clinical influence of ALDH1A1-expressing tumor cells in cancers of breast, colon, prostate, and head and neck, as well as in leukemia.36,39,40,43,44 These findings raise the intriguing question of how ALDH1A1, in charge of activating the prodifferentiation factor RA, is associated with worsened clinical outcome and an undifferentiated phenotype in both healthy and neoplastic tissues. Taking into account possible mechanisms of alternative RA signaling, it could be of great interest to investigate whether stem and progenitor cells are capable of steering self-generated intracellular RA levels. By modulating the expression of ALDH1A1 and of chaperone proteins such as CRBP1, CRABP1, CRABP2, and FABP5, these cells might switch between proliferation and differentiation in response to microenvironmental or ontogenetic cues.
Finally, we reported abundant, WHO grade-dependent expression of CYP26B1 in glioma tissues and dose-dependent, retinoid-specific induction of CYP26B1 in glioma cell lines, as well as in fresh tumor explants subjected to brief exposure to RA. Because of their ability to metabolize RA, CYP26 enzymes are believed to exert local control of RA synthesis and seem to play a critical role during ontogenesis.45 Bearing in mind the strong correlation of proteins facilitating retinol uptake (CRBP1) and activation (ALDH1A1), as well as RA degradation (CYP26B1) (see Supplemental Figure S8B at http://ajp.amjpathol.org), it can be assumed that elevated CYP26B1 expression in glial tumors indirectly mirrors elevated RA synthesis, resulting as physiological response to control elevated intracellular RA concentrations.24,45 It is further conceivable that, in the absence of CRABP2, high levels of CRABP1, CYP26B1, and FABP5 greatly reduce the likelihood of RA reaching its designated nuclear receptor and inducing differentiation without being degraded or diverted into an alternative signaling pathway first. Nonetheless, despite these alluring speculations, further studies would be needed to corroborate these hypotheses.
Taken together, our results identify CRBP1 and ALDH1A1 as independent and unfavorable prognostic markers in glioma and suggest aberrant RA signaling as a central and clinically relevant component in glioma pathogenesis.
Acknowledgments
We thank Thora Pommerencke for performing microscope scans of the TMA slides and Prof. Peter Lichter for his help in designing and assembling the tissue array, as well as the tissue bank of the National Center for Tumor Disease (NCT, Heidelberg, Germany) for supplying the tumor tissues used for mRNA studies. We also thank Rolf Warta and Jennifer Lohr for critically reading the manuscript, as well as Hilde Discher, Farzaneh Kashfi, Ilka Hearn, and Melanie Greibich for excellent technical assistance.
Footnotes
Supported by the Association for Promotion of Cancer Research [Verein zur Förderung der Krebsforschung (C.H.-M.)]; the Federal Ministry of Education and Research [Bundesministerium für Bildung und Forschung (01GS0886 to C.H.-M.)]; the Tumor Center of Heidelberg/Mannheim [Tumorzentrum Heidelberg/Mannheim (C.H.-M.)]; and German Cancer Aid [Deutsche Krebshilfe (109202 to C.H.-M.)].
B.C., F.-S.C., and J.L.B. contributed equally to the present work.
Supplemental material for this article can be found at http://ajp.amjpathol.org or at doi: 10.1016/j.ajpath.2011.01.051.
Supplementary data
WHO grade-dependent expression of mRNA transcripts for CRBP1, ALDH1A1, and CRABP2, with overall survival (OS) analysis. Average mRNA expression in WHO grade II–III and WHO grade IV gliomas of CRBP1 (A), ALDH1A1 (B), and CRABP2 (C). Data are reported as means ± SEM. There was a significantly higher expression of CRBP1 transcripts in WHO grade IV tumors (P < 0.001). Kaplan-Meier plots indicating associations between mRNA expression levels and patient overall survival (median expression levels were used as cutoffs for low and high expression). Overall patient survival was significantly associated with mRNA expression levels of ALDH1A1 (P = 0.026), but not CRABP2 (P > 0.05).
WHO grade-dependent distributions of RXRα, RXRβ, and RXRγ staining frequencies. Immunohistochemical stainings showing representative frequencies of RXRα, RXRβ, and RXRγ immunoreactivity in low- and high-grade tumors. Insets: Immunoreactive cells at higher magnification. Scale bar = 100 μm (main images); 25 μm (insets). Graphs depict distribution of RXRα, RXRβ, and RXRγ staining frequencies in astrocytic gliomas according to WHO grade. There was a significant positive correlation of staining frequencies with WHO grade for RXRα and RXRβ (P < 0.001), but not RXRγ (P > 0.05).
WHO grade-dependent distribution of RARα, RARβ, and RARγ staining frequencies. A: Representative immunohistochemical stainings of RARα, RARβ, and RARγ in low- and high-grade tumors. Insets: Immunoreactive cells at higher magnification. Scale bar = 100 μm (main images); 25 μm (insets). Graphs depict distribution of RARα, RARβ, and RARγ staining frequencies in astrocytic gliomas according to WHO grade. There was a significant positive correlation of staining frequencies with WHO grade only for RARβ (P = 0.002). B: Quantitative PCR analyses of RARβ transcripts in untreated glioma cells and in cells treated with 5 nmol/L or 1 μmol/L RA. Experiments were performed under serum-free culture conditions to exclude a potential influence of serum-contained RA on RARβ expression. P values reflect significant differences between cells treated with 5 nmol/L and 1 μmol/L RA. Data are reported as means ± SEM of three independent experiments. P values reflect significant differences between untreated controls and retinoid-treated samples.
WHO grade-dependent expression of mRNA transcripts for CRABP1, CYP26B1, and FABP5, with overall survival analysis Graphs depict average mRNA expression in WHO grade II–III and WHO grade IV gliomas for CRABP1 (A), CYP26B1 (B), and FABP5 (C). Data are reported as means ± SEM. There was a significantly higher expression of FABP5 transcripts in WHO grade IV tumors (P < 0.001). Kaplan-Meier plots indicate associations between mRNA expression levels and patient overall survival (median expression levels were used as cutoffs for low and high expression). mRNA expression levels was significantly associated with overall survival only for FABP5 (P < 0.045).
Expression and induction of CYP26B1 under serum-free culture conditions. A: Quantitative PCR analyses of CYP26B1 transcripts in untreated glioma cells and in cells treated with BMP4, RA, or 13-cis RA. Experiments were performed under serum-free culture conditions to exclude a potential influence of serum-contained RA on CYP26B1 expression. P values indicate significant induction of CYP26B1 mRNA in treated cells as compared to untreated cells. B: Relative quantities of viable cells in untreated and RA-treated cells as assessed by propidium iodide incorporation assay. Data are reported as means SEM of three independent experiments.
WHO grade-dependent distribution of PPARD staining frequencies. A: Representative immunohistochemical stainings of nuclear FABP5 in low- and high-grade tumors. B: Representative immunohistochemical stainings of PPARD in low-grade and high-grade tumors. Insets: Immunoreactive cells at higher magnification. Scale bar = 100 μm (main images); 25 μm (insets). Graph depicts similar PPARD staining frequencies in astrocytic gliomas of different WHO grade.
S7. Expression of FABP5 and CRABP2 in vitro and proproliferative effect of RA. A: Quantification of FABP5 and CRABP2 expression in corresponding primary glioma cell lines as assessed by flow cytometry analysis. Data are reported as means SEM of two independent experiments. B: Proliferation of glioma cell lines exposed to 1 mol/L RA, compared with corresponding untreated cells, as assessed by BrdU-incorporation assay (shown here as relative proliferation). Data are reported as means SEM of three independent experiments. P values indicate significant changes in proliferation in RA treated cells as compared to unterated control cells.
Schematics of possible RA signaling in glioblastoma. A: The putative relationship between RA signaling molecules analyzed in the present study. The size of individual icons reflects representative protein expression levels found in glioblastoma. Arrows indicate possible retinol and RA routing in the cell, and their size reflects the probability of RA entering each of the three individual pathways, namely, degradation, proliferation/survival, and differentiation. The asterisk marks nuclear retinoid receptors. B: Correlations between up-regulated RA signaling molecules in glioblastoma. Arrows indicate positive correlations. (Correlation of CRABP1 and CRBP1 did not reach statistical significance; ρ = 0.15, P = 0.05.)
References
- 1.Bao S., Wu Q., McLendon R.E., Hao Y., Shi Q., Hjelmeland A.B., Dewhirst M.W., Bigner D.D., Rich J.N. Glioma stem cells promote radioresistance by preferential activation of the DNA damage response. Nature. 2006;444:756–760. doi: 10.1038/nature05236. [DOI] [PubMed] [Google Scholar]
- 2.Singh S.K., Clarke I.D., Terasaki M., Bonn V.E., Hawkins C., Squire J., Dirks P.B. Identification of a cancer stem cell in human brain tumors. Cancer Res. 2003;63:5821–5828. [PubMed] [Google Scholar]
- 3.Singh S.K., Hawkins C., Clarke I.D., Squire J.A., Bayani J., Hide T., Henkelman R.M., Cusimano M.D., Dirks P.B. Identification of human brain tumour initiating cells. Nature. 2004;432:396–401. doi: 10.1038/nature03128. [DOI] [PubMed] [Google Scholar]
- 4.Henion P.D., Weston J.A. Retinoic acid selectively promotes the survival and proliferation of neurogenic precursors in cultured neural crest cell populations. Dev Biol. 1994;161:243–250. doi: 10.1006/dbio.1994.1024. [DOI] [PubMed] [Google Scholar]
- 5.Plum L.A., Parada L.F., Tsoulfas P., Clagett-Dame M. Retinoic acid combined with neurotrophin-3 enhances the survival and neurite outgrowth of embryonic sympathetic neurons. Exp Biol Med (Maywood) 2001;226:766–775. doi: 10.1177/153537020222600809. [DOI] [PubMed] [Google Scholar]
- 6.Jacobs S., Lie D.C., DeCicco K.L., Shi Y., DeLuca L.M., Gage F.H., Evans R.M. Retinoic acid is required early during adult neurogenesis in the dentate gyrus. Proc Natl Acad Sci USA. 2006;103:3902–3907. doi: 10.1073/pnas.0511294103. [DOI] [PMC free article] [PubMed] [Google Scholar]
- 7.Esteller M., Guo M., Moreno V., Peinado M.A., Capella G., Galm O., Baylin S.B., Herman J.G. Hypermethylation-associated inactivation of the cellular retinol-binding-protein 1 gene in human cancer. Cancer Res. 2002;62:5902–5905. [PubMed] [Google Scholar]
- 8.Williams S.J., Cvetkovic D., Hamilton T.C. Vitamin A metabolism is impaired in human ovarian cancer. Gynecol Oncol. 2009;112:637–645. doi: 10.1016/j.ygyno.2008.11.015. [DOI] [PMC free article] [PubMed] [Google Scholar]
- 9.Kuppumbatti Y.S., Bleiweiss I.J., Mandeli J.P., Waxman S., Mira-y-Lopez R. Cellular retinol-binding protein expression and breast cancer. J Natl Cancer Inst. 2000;92:475–480. doi: 10.1093/jnci/92.6.475. [DOI] [PubMed] [Google Scholar]
- 10.Chang B., Liu G., Xue F., Rosen D.G., Xiao L., Wang X., Liu J. ALDH1 expression correlates with favorable prognosis in ovarian cancers. Mod Pathol. 2009;22:817–823. doi: 10.1038/modpathol.2009.35. [DOI] [PMC free article] [PubMed] [Google Scholar]
- 11.Kim H., Lapointe J., Kaygusuz G., Ong D.E., Li C., van D.E., Rijn M., Brooks J.D., Pollack J.R. The retinoic acid synthesis gene ALDH1a2 is a candidate tumor suppressor in prostate cancer. Cancer Res. 2005;65:8118–8124. doi: 10.1158/0008-5472.CAN-04-4562. [DOI] [PubMed] [Google Scholar]
- 12.Huang Y., de la Chapelle A., Pellegata N.S. Hypermethylation, but not LOH, is associated with the low expression of MT1G and CRABP1 in papillary thyroid carcinoma. Int J Cancer. 2003;104:735–744. doi: 10.1002/ijc.11006. [DOI] [PubMed] [Google Scholar]
- 13.Jing Y., Waxman S., Mira-Y-Lopez R. The cellular retinoic acid binding protein II is a positive regulator of retinoic acid signaling in breast cancer cells. Cancer Res. 1997;57:1668–1672. [PubMed] [Google Scholar]
- 14.Manor D., Shmidt E.N., Budhu A., Flesken-Nikitin A., Zgola M., Page R., Nikitin A.Y., Noy N. Mammary carcinoma suppression by cellular retinoic acid binding protein-II. Cancer Res. 2003;63:4426–4433. [PubMed] [Google Scholar]
- 15.Schug T.T., Berry D.C., Shaw N.S., Travis S.N., Noy N. Opposing effects of retinoic acid on cell growth result from alternate activation of two different nuclear receptors. Cell. 2007;129:723–733. doi: 10.1016/j.cell.2007.02.050. [DOI] [PMC free article] [PubMed] [Google Scholar]
- 16.Schug T.T., Berry D.C., Toshkov I.A., Cheng L., Nikitin A.Y., Noy N. Overcoming retinoic acid-resistance of mammary carcinomas by diverting retinoic acid from PPARbeta/delta to RAR. Proc Natl Acad Sci USA. 2008;105:7546–7551. doi: 10.1073/pnas.0709981105. [DOI] [PMC free article] [PubMed] [Google Scholar]
- 17.Karcher S., Steiner H., Ahmadi R., Zoubaa S., Vasvari G., Bauer H., Unterberg A., Herold-Mende C. Different angiogenic phenotypes in primary and secondary glioblastomas. Int J Cancer. 2006;118:2182–2189. doi: 10.1002/ijc.21648. [DOI] [PubMed] [Google Scholar]
- 18.Campos B., Wan F., Farhadi M., Ernst A., Zeppernick F., Tagscherer K.E., Ahmadi R., Lohr J., Dictus C., Gdynia G., Combs S.E., Goidts V., Helmke B.M., Eckstein V., Roth W., Beckhove P., Lichter P., Unterberg A., Radlwimmer B., Herold-Mende C. Differentiation therapy exerts antitumor effects on stem-like glioma cells. Clin Cancer Res. 2010;16:2715–2728. doi: 10.1158/1078-0432.CCR-09-1800. [DOI] [PubMed] [Google Scholar]
- 19.Schmidt C.K., Brouwer A., Nau H. Chromatographic analysis of endogenous retinoids in tissues and serum. Anal Biochem. 2003;315:36–48. doi: 10.1016/s0003-2697(02)00662-0. [DOI] [PubMed] [Google Scholar]
- 20.Noy N. Retinoid-binding proteins: mediators of retinoid action. Biochem J. 2000;348(Pt 3):481–495. [PMC free article] [PubMed] [Google Scholar]
- 21.Duester G. Families of retinoid dehydrogenases regulating vitamin A function: production of visual pigment and retinoic acid. Eur J Biochem. 2000;267:4315–4324. doi: 10.1046/j.1432-1327.2000.01497.x. [DOI] [PubMed] [Google Scholar]
- 22.Delva L., Bastie J.N., Rochette-Egly C., Kraïba R., Balitrand N., Despouy G., Chambon P., Chomienne C. Physical and functional interactions between cellular retinoic acid binding protein II and the retinoic acid-dependent nuclear complex. Mol Cell Biol. 1999;19:7158–7167. doi: 10.1128/mcb.19.10.7158. [DOI] [PMC free article] [PubMed] [Google Scholar]
- 23.Giguère V. Retinoic acid receptors and cellular retinoid binding proteins: complex interplay in retinoid signaling. Endocr Rev. 1994;15:61–79. doi: 10.1210/edrv-15-1-61. [DOI] [PubMed] [Google Scholar]
- 24.White R.J., Schilling T.F. How degrading: cyp26s in hindbrain development. Dev Dyn. 2008;237:2775–2790. doi: 10.1002/dvdy.21695. [DOI] [PMC free article] [PubMed] [Google Scholar]
- 25.Napoli J.L. Quantification of physiological levels of retinoic acid. Methods Enzymol. 1986;123:112–124. doi: 10.1016/s0076-6879(86)23015-3. [DOI] [PubMed] [Google Scholar]
- 26.Sessler R.J., Noy N. A ligand-activated nuclear localization signal in cellular retinoic acid binding protein-II. Mol Cell. 2005;18:343–353. doi: 10.1016/j.molcel.2005.03.026. [DOI] [PubMed] [Google Scholar]
- 27.Wan F., Herold-Mende C., Campos B., Centner F.S., Dictus C., Becker N., Devens F., Mogler C., Felsberg J., Grabe N., Reifenberger G., Lichter P., Unterberg A., Bermejo J.L., Ahmadi R. Association of stem cell-related markers and survival in astrocytic gliomas. Biomarkers. 2011;16:136–143. doi: 10.3109/1354750X.2010.536256. [DOI] [PubMed] [Google Scholar]
- 28.Strojnik T., Røsland G.V., Sakariassen P.O., Kavalar R., Lah T. Neural stem cell markers, nestin and musashi proteins, in the progression of human glioma: correlation of nestin with prognosis of patient survival. Surg Neurol. 2007;68:133–143. doi: 10.1016/j.surneu.2006.10.050. discussion 143–144. [DOI] [PubMed] [Google Scholar]
- 29.Lendahl U., Zimmerman L.B., McKay R.D. CNS stem cells express a new class of intermediate filament protein. Cell. 1990;60:585–595. doi: 10.1016/0092-8674(90)90662-x. [DOI] [PubMed] [Google Scholar]
- 30.Dictus C., Tronnier V., Unterberg A., Herold-Mende C. Comparative analysis of in vitro conditions for rat adult neural progenitor cells. J Neurosci Methods. 2007;161:250–258. doi: 10.1016/j.jneumeth.2006.11.012. [DOI] [PubMed] [Google Scholar]
- 31.Reya T., Morrison S.J., Clarke M.F., Weissman I.L. Stem cells, cancer, and cancer stem cells. Nature. 2001;414:105–111. doi: 10.1038/35102167. [DOI] [PubMed] [Google Scholar]
- 32.Collins A.T., Berry P.A., Hyde C., Stower M.J., Maitland N.J. Prospective identification of tumorigenic prostate cancer stem cells. Cancer Res. 2005;65:10946–10951. doi: 10.1158/0008-5472.CAN-05-2018. [DOI] [PubMed] [Google Scholar]
- 33.Al-Hajj M. Cancer stem cells and oncology therapeutics. Curr Opin Oncol. 2007;19:61–64. doi: 10.1097/CCO.0b013e328011a8d6. [DOI] [PubMed] [Google Scholar]
- 34.Bonnet D., Dick J.E. Human acute myeloid leukemia is organized as a hierarchy that originates from a primitive hematopoietic cell. Nat Med. 1997;3:730–737. doi: 10.1038/nm0797-730. [DOI] [PubMed] [Google Scholar]
- 35.Zeppernick F., Ahmadi R., Campos B., Dictus C., Helmke B.M., Becker N., Lichter P., Unterberg A., Radlwimmer B., Herold-Mende C.C. Stem cell marker CD133 affects clinical outcome in glioma patients. Clin Cancer Res. 2008;14:123–129. doi: 10.1158/1078-0432.CCR-07-0932. [DOI] [PubMed] [Google Scholar]
- 36.Ginestier C., Hur M.H., Charafe-Jauffret E., Monville F., Dutcher J., Brown M., Jacquemier J., Viens P., Kleer C.G., Liu S., Schott A., Hayes D., Birnbaum D., Wicha M.S., Dontu G. ALDH1 is a marker of normal and malignant human mammary stem cells and a predictor of poor clinical outcome. Cell Stem Cell. 2007;1:555–567. doi: 10.1016/j.stem.2007.08.014. [DOI] [PMC free article] [PubMed] [Google Scholar]
- 37.Hess D.A., Meyerrose T.E., Wirthlin L., Craft T.P., Herrbrich P.E., Creer M.H., Nolta J.A. Functional characterization of highly purified human hematopoietic repopulating cells isolated according to aldehyde dehydrogenase activity. Blood. 2004;104:1648–1655. doi: 10.1182/blood-2004-02-0448. [DOI] [PubMed] [Google Scholar]
- 38.Corti S., Locatelli F., Papadimitriou D., Donadoni C., Salani S., Del Bo R., Strazzer S., Bresolin N., Comi G.P. Identification of a primitive brain-derived neural stem cell population based on aldehyde dehydrogenase activity. Stem Cells. 2006;24:975–985. doi: 10.1634/stemcells.2005-0217. [DOI] [PubMed] [Google Scholar]
- 39.Pearce D.J., Taussig D., Simpson C., Allen K., Rohatiner A.Z., Lister T.A., Bonnet D. Characterization of cells with a high aldehyde dehydrogenase activity from cord blood and acute myeloid leukemia samples. Stem Cells. 2005;23:752–760. doi: 10.1634/stemcells.2004-0292. [DOI] [PubMed] [Google Scholar]
- 40.Huang E.H., Hynes M.J., Zhang T., Ginestier C., Dontu G., Appelman H., Fields J.Z., Wicha M.S., Boman B.M. Aldehyde dehydrogenase 1 is a marker for normal and malignant human colonic stem cells (SC) and tracks SC overpopulation during colon tumorigenesis. Cancer Res. 2009;69:3382–3389. doi: 10.1158/0008-5472.CAN-08-4418. [DOI] [PMC free article] [PubMed] [Google Scholar]
- 41.Jiang F., Qiu Q., Khanna A., Todd N.W., Deepak J., Xing L., Wang H., Liu Z., Su Y., Stass S.A., Katz R.L. Aldehyde dehydrogenase 1 is a tumor stem cell-associated marker in lung cancer. Mol Cancer Res. 2009;7:330–338. doi: 10.1158/1541-7786.MCR-08-0393. [DOI] [PMC free article] [PubMed] [Google Scholar]
- 42.Ma S., Chan K.W., Lee T.K., Tang K.H., Wo J.Y., Zheng B., Guan X. Aldehyde dehydrogenase discriminates the CD133 liver cancer stem cell populations. Mol Cancer Res. 2008;6:1146–1153. doi: 10.1158/1541-7786.MCR-08-0035. [DOI] [PubMed] [Google Scholar]
- 43.Li T., Su Y., Mei Y., Leng Q., Leng B., Liu Z., Stass S.A., Jiang F. ALDH1A1 is a marker for malignant prostate stem cells and predictor of prostate cancer patients' outcome. Lab Invest. 2010;90:234–244. doi: 10.1038/labinvest.2009.127. [DOI] [PMC free article] [PubMed] [Google Scholar]
- 44.Chen Y., Chen Y., Hsu H., Tseng L., Huang P., Lu K., Chen D., Tai L., Yung M., Chang S., Ku H., Chiou S., Lo W. Aldehyde dehydrogenase 1 is a putative marker for cancer stem cells in head and neck squamous cancer. Biochem Biophys Res Commun. 2009;385:307–313. doi: 10.1016/j.bbrc.2009.05.048. [DOI] [PubMed] [Google Scholar]
- 45.Spoorendonk K.M., Peterson-Maduro J., Renn J., Trowe T., Kranenbarg S., Winkler C., Schulte-Merker S. Retinoic acid and Cyp26b1 are critical regulators of osteogenesis in the axial skeleton. Development. 2008;135:3765–3774. doi: 10.1242/dev.024034. [DOI] [PubMed] [Google Scholar]
Associated Data
This section collects any data citations, data availability statements, or supplementary materials included in this article.
Supplementary Materials
WHO grade-dependent expression of mRNA transcripts for CRBP1, ALDH1A1, and CRABP2, with overall survival (OS) analysis. Average mRNA expression in WHO grade II–III and WHO grade IV gliomas of CRBP1 (A), ALDH1A1 (B), and CRABP2 (C). Data are reported as means ± SEM. There was a significantly higher expression of CRBP1 transcripts in WHO grade IV tumors (P < 0.001). Kaplan-Meier plots indicating associations between mRNA expression levels and patient overall survival (median expression levels were used as cutoffs for low and high expression). Overall patient survival was significantly associated with mRNA expression levels of ALDH1A1 (P = 0.026), but not CRABP2 (P > 0.05).
WHO grade-dependent distributions of RXRα, RXRβ, and RXRγ staining frequencies. Immunohistochemical stainings showing representative frequencies of RXRα, RXRβ, and RXRγ immunoreactivity in low- and high-grade tumors. Insets: Immunoreactive cells at higher magnification. Scale bar = 100 μm (main images); 25 μm (insets). Graphs depict distribution of RXRα, RXRβ, and RXRγ staining frequencies in astrocytic gliomas according to WHO grade. There was a significant positive correlation of staining frequencies with WHO grade for RXRα and RXRβ (P < 0.001), but not RXRγ (P > 0.05).
WHO grade-dependent distribution of RARα, RARβ, and RARγ staining frequencies. A: Representative immunohistochemical stainings of RARα, RARβ, and RARγ in low- and high-grade tumors. Insets: Immunoreactive cells at higher magnification. Scale bar = 100 μm (main images); 25 μm (insets). Graphs depict distribution of RARα, RARβ, and RARγ staining frequencies in astrocytic gliomas according to WHO grade. There was a significant positive correlation of staining frequencies with WHO grade only for RARβ (P = 0.002). B: Quantitative PCR analyses of RARβ transcripts in untreated glioma cells and in cells treated with 5 nmol/L or 1 μmol/L RA. Experiments were performed under serum-free culture conditions to exclude a potential influence of serum-contained RA on RARβ expression. P values reflect significant differences between cells treated with 5 nmol/L and 1 μmol/L RA. Data are reported as means ± SEM of three independent experiments. P values reflect significant differences between untreated controls and retinoid-treated samples.
WHO grade-dependent expression of mRNA transcripts for CRABP1, CYP26B1, and FABP5, with overall survival analysis Graphs depict average mRNA expression in WHO grade II–III and WHO grade IV gliomas for CRABP1 (A), CYP26B1 (B), and FABP5 (C). Data are reported as means ± SEM. There was a significantly higher expression of FABP5 transcripts in WHO grade IV tumors (P < 0.001). Kaplan-Meier plots indicate associations between mRNA expression levels and patient overall survival (median expression levels were used as cutoffs for low and high expression). mRNA expression levels was significantly associated with overall survival only for FABP5 (P < 0.045).
Expression and induction of CYP26B1 under serum-free culture conditions. A: Quantitative PCR analyses of CYP26B1 transcripts in untreated glioma cells and in cells treated with BMP4, RA, or 13-cis RA. Experiments were performed under serum-free culture conditions to exclude a potential influence of serum-contained RA on CYP26B1 expression. P values indicate significant induction of CYP26B1 mRNA in treated cells as compared to untreated cells. B: Relative quantities of viable cells in untreated and RA-treated cells as assessed by propidium iodide incorporation assay. Data are reported as means SEM of three independent experiments.
WHO grade-dependent distribution of PPARD staining frequencies. A: Representative immunohistochemical stainings of nuclear FABP5 in low- and high-grade tumors. B: Representative immunohistochemical stainings of PPARD in low-grade and high-grade tumors. Insets: Immunoreactive cells at higher magnification. Scale bar = 100 μm (main images); 25 μm (insets). Graph depicts similar PPARD staining frequencies in astrocytic gliomas of different WHO grade.
S7. Expression of FABP5 and CRABP2 in vitro and proproliferative effect of RA. A: Quantification of FABP5 and CRABP2 expression in corresponding primary glioma cell lines as assessed by flow cytometry analysis. Data are reported as means SEM of two independent experiments. B: Proliferation of glioma cell lines exposed to 1 mol/L RA, compared with corresponding untreated cells, as assessed by BrdU-incorporation assay (shown here as relative proliferation). Data are reported as means SEM of three independent experiments. P values indicate significant changes in proliferation in RA treated cells as compared to unterated control cells.
Schematics of possible RA signaling in glioblastoma. A: The putative relationship between RA signaling molecules analyzed in the present study. The size of individual icons reflects representative protein expression levels found in glioblastoma. Arrows indicate possible retinol and RA routing in the cell, and their size reflects the probability of RA entering each of the three individual pathways, namely, degradation, proliferation/survival, and differentiation. The asterisk marks nuclear retinoid receptors. B: Correlations between up-regulated RA signaling molecules in glioblastoma. Arrows indicate positive correlations. (Correlation of CRABP1 and CRBP1 did not reach statistical significance; ρ = 0.15, P = 0.05.)