

Abstract
Cellular senescence has been widely recognized as a tumor suppressing mechanism that acts as a barrier to cancer development after oncogenic stimuli. A prominent in vivo model of the senescence barrier is represented by nevi, which are composed of melanocytes that, after an initial phase of proliferation induced by activated oncogenes (most commonly BRAF), are blocked in a state of cellular senescence. Transformation to melanoma occurs when genes involved in controlling senescence are mutated or silenced and cells reacquire the capacity to proliferate. Pirin (PIR) is a highly conserved nuclear protein that likely functions as a transcriptional regulator whose expression levels are altered in different types of tumors. We analyzed the expression pattern of PIR in adult human tissues and found that it is expressed in melanocytes and has a complex pattern of regulation in nevi and melanoma: it is rarely detected in mature nevi, but is expressed at high levels in a subset of melanomas. Loss of function and overexpression experiments in normal and transformed melanocytic cells revealed that PIR is involved in the negative control of cellular senescence and that its expression is necessary to overcome the senescence barrier. Our results suggest that PIR may have a relevant role in melanoma progression.
Cellular senescence is a physiological process through which normal somatic cells lose their ability to divide and enter an irreversible state of cell cycle arrest, although they remain viable and metabolically active.1,2 The specific molecular circuitry underlying the onset of cellular senescence is dependent on the type of stimulus and on the cellular context. A central role is held by the activation of the tumor suppressor proteins p53 and retinoblastoma susceptibility protein (pRB),3–5 which act by interfering with the transcriptional program of the cell and ultimately arresting cell cycle progression.
In the last decade, senescence has been recognized as a major barrier against the development of tumors in mammals.6–8 One of the most prominent in vivo examples is represented by nevi, in which cells proliferate after oncogene activation and then become senescent. Melanoma is a highly aggressive form of neoplasm often observed to derive from nevi, and the transition implies suppression of the mechanisms that sustain the onset and maintenance of senescence.9 In fact, many of the melanoma-associated tumor suppressor genes identified to date are themselves involved in control of senescence, including BRAF (encoding serine/threonine-protein kinase B-raf), CKD4 (cyclin-dependent kinase 4), and CDKN2A (encoding cyclin-dependent kinase inhibitor 2A isoforms p16INK4a and p19ARF).3,10
Nevi frequently harbor oncogenic mutations of the tyrosine kinase BRAF gene, particularly V600E,11 and BRAFV600E is also found in approximately 70% of cutaneous melanomas.12 Expression of BRAFV600E in human melanocytes leads to oncogene-induced senescence,8 which can be considered as a mechanism that protects from malignant progression. In time, some cells may eventually escape senescence, probably through the acquisition of additional genetic abnormalities, thus favoring transformation to melanoma.13
Pirin (PIR) is a highly conserved nuclear protein belonging to the Cupin superfamily14 whose function is, to date, poorly characterized. It has been described as a putative transcriptional regulator on the basis of its physical association with the nuclear I/CCAAT box transcription factor NFI/CTF115 and with the B-cell lymphoma protein, BCL-3, a regulator of NF-κB/Rel activity. A recent report shows that PIR controls melanoma cell migration through the transcriptional regulation of snail homolog 2, SNAI2 (previously SLUG).16 Other reports described quercetinase enzymatic activity,17 and regulation of apoptosis18,19 and stress response, unveiling a high degree of cell-type and species specificity in PIR function.
There is evidence of variations in PIR expression levels in different types of malignancies, but a systematic analysis of PIR expression in human tumors has been lacking. We analyzed PIR expression pattern in a collection of normal and neoplastic human tissues and found that it is expressed in scattered melanocytes, virtually absent in more mature regions of nevi, and present at high levels in a subset of melanomas. Functional studies performed in normal and transformed melanocytic cells revealed that PIR ablation results in cellular senescence, and that PIR levels decrease in response to senescence stimuli. Our results suggest that PIR may be a relevant player in the negative control of cellular senescence in PIR-expressing melanomas.
Materials and Methods
TMA Design and IHC
FFPE human specimens were arrayed in specifically designed TMAs, as previously described.20 For the preliminary screening of PIR expression in human tissues, three multitumor TMAs composed of various tumor specimens and respective normal counterparts (when available) were analyzed. Arrayed samples, provided by the Pathology departments of Ospedale Maggiore (Novara), Presidio Ospedaliero (Vimercate), and Ospedale Sacco (Milano), included breast, colon, kidney, larynx, lung, prostate, ovarian, and gastric carcinomas, as well as melanomas, lymphomas, and glial tumors. Written informed consent for research use of biological samples was obtained from all patients, and the research project was approved by the Institutional Ethical Committee of the European Institute of Oncology [Istituto Europeo di Oncologia (IEO)].
For the in-depth analysis of PIR expression in melanoma, two melanoma-specific microarrays were designed: the first was composed of 27 intradermal nevi, 44 primary melanomas, and 61 metastatic melanomas provided by the Pathology Department of the European Institute of Oncology (IEO, Milan); the second was composed of 3 intradermal nevi, 94 primary melanomas, and 1 metastatic melanoma provided by the Pathology Department of Ospedale San Paolo (Milan). The total number of samples actually evaluated for PIR staining was slightly smaller, because of insufficient tumoral material or loss of material during experimental procedure.
Sections (2-μm thick) of each TMA block were cut, mounted on glass slides, and processed for IHC. Immunohistochemical staining was performed overnight at 4°C with affinity-purified primary anti-PIR antibody diluted 1:5000 followed by detection with the Dako EnVision Plus system and, for melanoma-specific TMAs, Vector VIP kit (SK-4600, peroxidase substrate; Vector Laboratories, Burlingame, CA).
Sections were blindly and independently evaluated by two investigators (P.N. and C.L.), and consensus was reached in discordant cases (<5% of cases). A semi-quantitative score was used to assess PIR expression: 0 = no staining, 1 = weak, 2 = moderate, and 3 = high staining. For statistical analysis, three groups were defined on the basis of staining intensity scores: Low-Negative (intensity score ≤ 1), Moderate (intensity score between 1 and 2), and High (intensity score > 2).
Statistical Analysis
Association between the clinicopathological features of the tumors and PIR expression was evaluated by analysis of variance, Student's t-test, and Fisher's exact test. The recognized prognostic factors included in the analysis were Breslow's index, Clark's level, and histotype. Analyses were performed using JMP statistical software version 5.1 (SAS Institute, Cary, NC). All P values were two-sided. A P value of <0.05 was considered to represent a significant result.
Cell Culture and Growth Media
HEK 293T cells were acquired from the American Type Culture Collection (ATCC, Manassas, VA). Melanoma cell lines WM1552, WM1575, WM35, WM278, WM793, and WM902 were provided by Dr. Meenhard Herlyn (The Wistar Institute, Philadelphia, PA) and were grown as described previously.21 Melanoma cell lines IGR39 and IGR37 were obtained from the German Collection of Microorganisms and Cell Cultures (DSMZ, Braunschweig, Germany) and were grown in supplemented Dulbecco's modified Eagle's medium; melanoma cell lines WM266 and WM115 were obtained from ATCC and maintained in supplemented modified Eagle's medium. Metastatic melanoma primary cell lines AnSe1965, IrAv1938B, CaCi1962, AdMa1935, LiGh1927B, ClVe1946, and GaLa1949 were established from surgical samples and were grown in supplemented RPMI-164 medium. Normal human melanocytes were isolated from surgical dissection according to standardized protocols. Cells were cultured in McCoy's 5A medium (Invitrogen, Carlsbad, CA) supplemented with 2% fetal bovine serum (United States origin), 5 μg/mL recombinant human insulin (Roche Applied Science, Monza, Italy), 5 μg/mL human holotransferrin (Sigma-Aldrich, St. Louis, MO), 0.5 μg/mL hydrocortisone (Sigma-Aldrich), 20 pmol/L cholera toxin from Vibrio cholerae (Sigma-Aldrich), 16 nmol/L phorbol 12-myristate 13-acetate (TPA; Sigma-Aldrich), 10 nmol/L endothelin-1 porcine (Sigma-Aldrich), 10 ng/mL recombinant human stem cell factor (PeproTech, Rocky Hill, NJ), and 1 ng/mL recombinant human fibroblast growth factor basic (PeproTech) in a humidified incubator at 37°C and 5% CO2. The medium was changed three times a week, and cells were subcultured when approaching confluence by gentle tilting to avoid breaking the cell processes.22 Normal keratinocytes were grown in serum-free medium. All cell lines were incubated at 37°C in a humidified atmosphere containing 5% CO2.
Generation of Polyclonal Anti-PIR Antibody
Full-length PIR coding sequence (873-bp sequence encoding a protein product of 291 amino acids with predicted molecular weight of 32 kDa) was cloned into pGEX-4T1 vector (Pharmacia Biotech, Uppsala, Sweden) downstream to the GST sequence. The protein was expressed in BL21 Escherichia coli strain after induction with 0.1 mmol/L isopropyl β-d-1-thiogalactopyranoside (IPTG) at 37°C for 3 hours and purified on glutathione beads (Pharmacia Biotech). After rabbit immunization, total antiserum was assessed for specificity by Western blot, immunofluorescence, and IHC after either overexpression or knockdown of PIR in HeLa cells, which express discrete but detectable levels of endogenous protein (see Supplemental Figure S1 at http://ajp.amjpathol.org).
Quantitative RT-PCR
Total RNAs were extracted using an RNeasy mini kit (Qiagen, Valencia, CA), and cDNA synthesis was performed using SuperScript II reverse transcriptase (Invitrogen) following manufacturer's instructions. Quantitative RT-PCR (qRT-PCR) experiments were performed using TaqMan chemistry. TaqMan gene expression assay Hs01125825_m1 (Applied Biosystems, Foster City, CA) was used for evaluation of PIR expression, and human GAPDH expression was assessed with GAPDH-Hs99999905_m1 TaqMan gene expression assay for normalization among samples.
Western Blot
Cells were lysed in JS buffer (50 mmol/L HEPES, 150 mmol/L NaCl, 1% glycerol, 1% Triton-X100, 1.5 mmol/L MgCl2, 5 mmol/L EDTA). Protein extracts (30 μg to 50 μg) were run in polyacrylamide gels and were transferred to Protran nitrocellulose membranes (Whatman, Kent, UK). After incubation with primary antibodies, membranes were incubated with peroxidase-coupled secondary antibodies. Immunoreactivity was developed with an enhanced chemiluminescence system (Amersham Biosciences, Fairfield, CT). Commercial primary antibodies used were as follows: anti-ERK (p44/42 MAP kinase) and anti-phospho ERK (phospho-p44/42, Thr202/Tyr204) (both from Cell Signaling Technology, Danvers, MA); anti-p16 (Santa Cruz Biotechnology, Santa Cruz, CA), anti-actin (mouse monoclonal clone AC-40; Sigma-Aldrich), and anti-vinculin (mouse monoclonal clone hVIN1; Sigma-Aldrich) for normalization. Anti-PIR rabbit polyclonal antibody was used at 1:5000 concentration. For quantification of PIR expression levels in melanoma samples, blots were scanned and the intensity of the bands corresponding to PIR and vinculin was analyzed and compared using ImageJ image processing software version 1.44 (NIH, Bethesda, MD).
PIR shRNA
Short hairpin RNA (shRNA) constructs were generated using the pSICO-R-PGK-puro lentiviral vector.23 The following pairs of shRNA-forming sequences were annealed and cloned into the pSICO-R vector backbone: PIR#7-fwd: 5'-TGAAGCCACTTTGTCTTAATTTCAAGAGAATTAAGACAAAGTGGCTTCTTTTTTC-3'; PIR#7-rev: 5-TCGAGAAAAAAGAAGCCACTTTGTCTTAATTCTCTTGAAATTAAGACAAAGTGGCTTCA-3'; PIR#16-fwd: 5'-TGAACACCAATGAAGAGATTTTCAAGAGAAATCTCTTCATTGGTGTTCTTTTTTC-3'; PIR#16-rev: 5'-TCGAGAAAAAAGAACACCAATGAAGAGATTTCTCTTGAAAATCTCTTCATTGGTGTTCA-3'; PIR#19-fwd: 5'-TGAAGGCATTCCATTTCTAATTCAAGAGATTAGAAATGGAATGCCTTCTTTTTTC-3'; and PIR#19-rev: 5'-TCGAGAAAAAAGAAGGCATTCCATTTCTAATCTCTTGAATTAGAAATGGAATGCCTTCA-3'.
Lentiviruses were packaged by transfection of pSICO-R and helper vectors in HEK 293T cells; the supernatant was concentrated, filtered, and overlaid on the target cells grown at 50% to 60% of confluence in the presence of polybrene for 8 hours; at 24 hours after infection, puromycin (1 μg/mL) was added to the medium for 72 hours.
PIR Overexpression
To prepare the PINCO-PIR construct, the complete PIR coding sequence was cloned into the PINCO plasmid.24 PINCO-PIR was transfected into Phoenix cells (American Type Culture Collection, Manassas, VA) by a calcium chloride method. At 48 hours after transfection, the supernatant containing recombinant retroviral particles was harvested, filtered though 0.45-μm pores, and added to IGR39 cells with 8 μg/mL polybrene. Cells were incubated for 3 hours at 37°C, and the infection was repeated twice consecutively. At 48 hours after infection, green fluorescent protein-positive IGR39 cells were sorted by fluorescence-activated cell sorting and expression of PIR was evaluated using Western blot analysis.
Growth Curves
WM266-4 and IGR37 cells were seeded at 130,000 cells and 280,000, respectively, in triplicate in 6-well plates. Cells were counted at 24-hour intervals for 4 days, and mean values ± SD were plotted.
Colony-Forming Assay
Five thousand WM266-4 cells and 10,000 IGR37 cells were seeded in 100-mm dishes in duplicate. Cells were cultured for 15 days, with the medium replaced every 4 to 5 days, and then were washed with PBS, stained for 10 minutes with 0.1% Crystal Violet, washed again, and dried at room temperature.
Senescence-Associated β-Galactosidase Assay
Cells infected with lentivaral vectors containing short hairpin RNAs targeting PIR (shPIR) and control cells were seeded in 12-well plates at an appropriate number to have 60% confluence after 24 hours. Cells were fixed and stained using a senescence detection kit from Calbiochem (Nottingham, UK) and were incubated for 16 hours at 37°C.
Camptothecin Treatment
Camptothecin (Sigma-Aldrich) was used at a concentration of 250 nmol/L for 24, 48, or 72 hours.
Results
Analysis of PIR Expression in Human Adult Tissues
PIR protein expression was assessed by IHC on three different multitumor TMAs containing a total of 218 tumor and 159 normal samples derived from 11 human adult tissues. PIR was detectable at low levels in a fraction of samples derived from 6/11 normal tissues and 9/11 tumor types and was most abundantly expressed in a subset of melanoma (7/15 samples). In parallel, PIR mRNA expression was analyzed by qRT-PCR in a collection of samples including 20 normal tissues (normal cultured melanocytes and keratinocytes). PIR expression values were calculated relative to the median level of expression in the entire sample set. Variably low levels of PIR mRNA were detected in all samples, and higher expression levels were found in normal melanocytes (Figure 1A).
Figure 1.
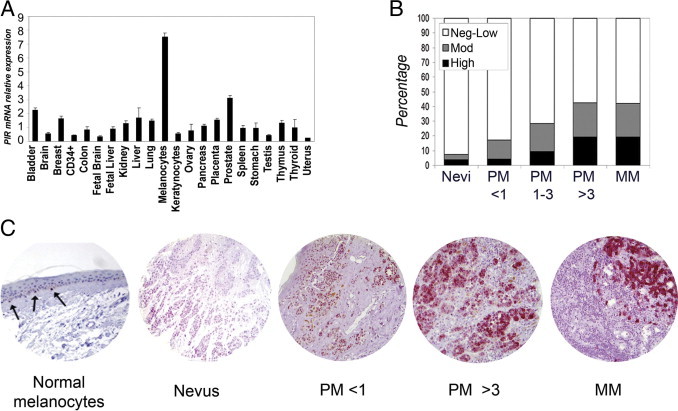
Analysis of PIR expression in normal human tissues and in melanoma samples. A: qRT-PCR analysis of PIR mRNA. Values are expressed relative to median expression in the entire sample set. Samples were run in triplicate and data were plotted as means ± SD. B: Correlation between PIR expression and stage of melanoma progression (<1, 1 to 3, >3 indicate Breslow depth in millimeters for primary melanoma). For statistical analysis, three groups were defined according to intensity: Neg-Low (intensity scores equal or lower than 1), Mod (scores between 1 and 2), and High (intensity scores higher than 2). C: Representative images of PIR IHC staining. Vector VIP (pink color) was used to detect PIR signal in melanoma-specific TMAs, to avoid confusion with melanin. Note strong PIR signal in melanocytes (arrows) in a normal skin section, with dendritic appearance and ovoid nucleus; the melanocytes are surrounded by clear space and are smaller than adjacent basal keratinocytes. There is little or no PIR expression in a mature nevus. In primary melanoma (PM) with 0.25 mm Breslow thickness, PIR expression is low (PM < 1). In primary melanoma with 3.22 mm Breslow thickness, PIR staining is moderate to high (PM > 3). In nodal metastasis (MM, metastatic melanoma), PIR staining is intense in melanoma cells, with no signal in lymphocytes.
The analysis of PIR expression was extended to a larger series of melanocytic lesions exploiting two melanoma-specific TMAs, for a total of 27 intradermal nevus, 117 primary melanoma, and 57 metastatic melanoma samples. Clinicopathological data for the sample collection are given in Table 1. The pattern of expression at different stages of melanoma progression was complex and diverse: PIR protein was detected in 2/27 nevi (7.4%), 36/117 primary melanomas (30.8%), and 24/57 metastatic melanomas (42.1%) (Table 1). A significant correlation between PIR staining and disease progression from nevus to primary to metastatic melanoma was observed (P = 0.017), and was also found when primary melanoma samples were further subclassified according to the Breslow index,25 which measures the thickness of the primary lesion (P = 0.029; Table 1 and Figure 1B), or to Clark staging,26 which indicates the level of skin invasion (P = 0.043; Table 1). Scattered normal melanocytes present in the basal layer of skin areas within some samples showed intense PIR staining (representative images are shown in Figure 1C). Notably, PIR subcellular localization differed among samples: the protein was nuclear in melanocytes, but melanoma samples displayed growing amounts of cytoplasmic protein at advanced stages.27
Table 1.
Clinicopathologic Data for 201 Melanoma Samples Included in the Melanoma-Specific TMA and Correlation with PIR Expression
| Parameter | Total | PIR+ | PIR− | % PIR+ |
|---|---|---|---|---|
| All lesions | ||||
| Nevi | 27 | 2 | 25 | 7.4 |
| Primary melanoma | 117 | 36 | 81 | 30.8 |
| Metastatic melanoma | 57 | 24 | 33 | 42.1 |
| Primary melanoma: histotype | ||||
| Nodular melanoma | 14 | 6 | 8 | 42.9 |
| Superficial spreading melanoma | 103 | 30 | 73 | 29.1 |
| Primary melanoma: age (years) | ||||
| <50 | 40 | 14 | 26 | 35.0 |
| >50 | 74 | 21 | 53 | 28.4 |
| Data not available | 3 | |||
| Primary melanoma: breslow | ||||
| 0–1 | 56 | 15 | 41 | 26.8 |
| >1–3 | 34 | 10 | 24 | 29.4 |
| ≥3 | 26 | 11 | 15 | 42.3 |
| Data not available | 1 | |||
| Primary melanoma: clark | ||||
| 1–2 | 29 | 10 | 19 | 34.5 |
| 3–5 | 86 | 60 | 26 | 69.8 |
| Data not available | 2 | |||
| Primary melanoma: regression | ||||
| No | 83 | 27 | 56 | 32.5 |
| Yes | 32 | 9 | 23 | 28.1 |
| Data not available | 2 |
Semiquantitative scoring was used to assess PIR expression: 0 = no staining; 1 = weak; 2 = moderate; 3 = high staining. Samples with score >1 were considered positive.
PIR mRNA expression levels in eight primary melanoma cell lines and nine metastatic melanoma cell lines were next investigated by qRT-PCR and compared with those in normal melanocytes from primary cultures. GAPDH expression was used to normalize expression levels among samples. Compared with normal melanocytes, there was a greater than threefold decrease of PIR expression in 6/8 primary melanoma cell lines and in 3/9 metastatic melanoma cell lines (Figure 2A). Analysis and quantification of PIR protein expression in the same cell lines using Western blot analysis yielded similar results (Figure 2B). Thus, melanoma cell lines show a pattern of PIR expression similar to that of primary tumor samples.
Figure 2.
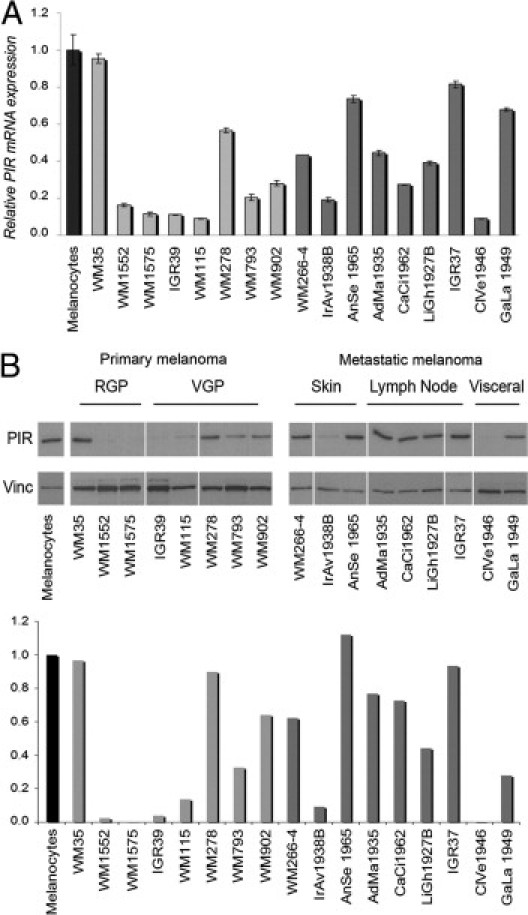
PIR expression in melanoma cell lines. A: qRT-PCR comparing PIR mRNA abundance in melanoma cell lines with normal cultured melanocytes (black bar). Light gray bars represent primary melanoma cell lines and dark gray bars represent metastatic melanoma cell lines. Values were calculated relative to median expression in the entire set of samples. Samples were run in triplicate and data were plotted as mean ± SD. B, top: Western blot analysis of the same melanoma cell lines. RGP, radial growth phase; VGP, vertical growth phase. Metastatic cell lines are divided by site of metastasis. B, bottom: Quantification of PIR expression levels normalized to vinculin loading control using ImageJ image processing software version 1.44 (NIH). Expression levels in melanocytes were considered to equal 1.
Taken together, our results indicate that PIR is expressed at low levels in a variety of human tissue types, and is present at higher levels in melanocytes. PIR is virtually absent in mature nevus samples but is highly expressed in a subset of primary and metastatic melanomas. For the purpose of further analyses, we therefore considered as PIR-expressing melanomas (referred to as PIR+) all those primary samples presenting moderate or high PIR expression in TMA analysis (as defined under Materials and Methods) and also established or primary cell lines presenting a value >0.4 in mRNA and protein levels, compared with primary melanocytes (Figure 2). Other melanoma samples are considered PIR-negative (PIR−).
PIR Ablation in Melanoma Cells Induces a Senescence-Like Phenotype
We next investigated the effect of PIR overexpression or ablation in PIR− or PIR+ melanoma cell lines, respectively. PIR− IGR39 cells were infected with the retroviral construct PINCO-PIR, which contains the entire PIR coding sequence cloned in the green fluorescent protein-expressing PINCO vector,24 or with the empty vector as control. Green fluorescent protein-positive cells were sorted; expression of PIR was assessed using Western blot analysis (Figure 3A), and cell growth and survival were analyzed. No significant effect on cellular proliferation and/or viability was observed (Figure 3B).
Figure 3.
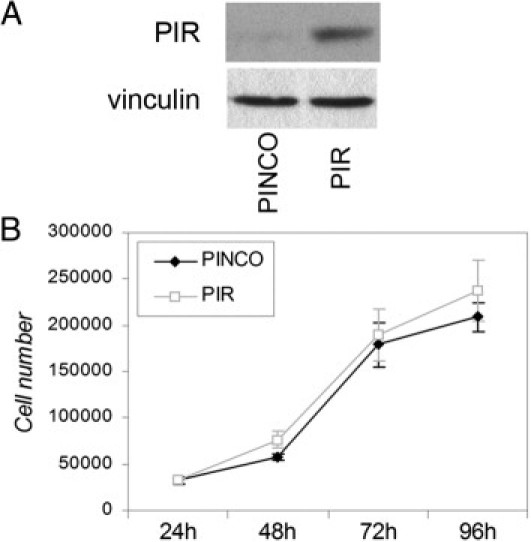
PIR overexpression in PIR− melanoma cells has no effect on proliferation. A: Western blot analysis of PIR− IGR39 cells transduced with the PINCO-PIR vector. Vinculin was used as loading control. B: Growth curve of IGR39 cells expressing PIR compared with control (PINCO) cells; 35,000 cells were seeded and counted at 24-hour intervals for 4 days. Data points represent means ± SD of triplicate wells; one representative experiment of two is shown.
PIR+ WM266-4 and IGR37 metastatic melanoma cell lines were transduced with three different lentiviral shRNAs (pSICO-R-shPIR#7, #16, and #19) to induce stable knockdown of PIR expression, or with the empty pSICO-R vector as control. Western blot analysis of PIR knockdown is shown in Figure 4A. Transduced cells were counted at 24-hour intervals for 4 days. The growth rate was significantly reduced in both melanoma cell lines stably expressing shPIR constructs, compared with that of cells bearing the empty pSICO-R (Figure 4A). A colony formation assay was also performed to measure the growth rate at low density. The number of colonies formed by shPIR cells was significantly reduced in both cell lines (Figure 4B).
Figure 4.
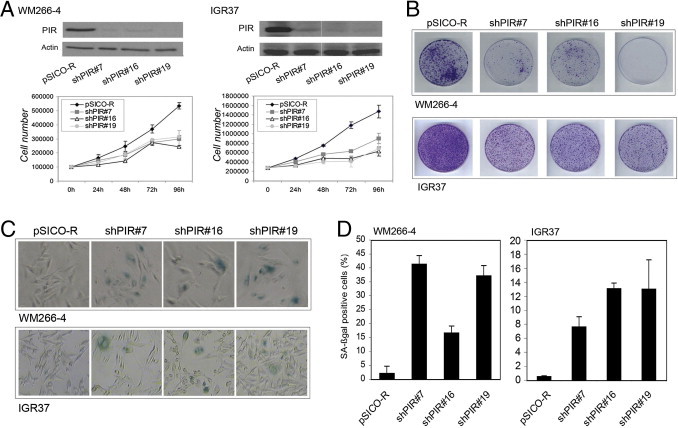
PIR ablation affects growth and induces senescence in PIR+ melanoma cells. A, top: Western blots of PIR down-regulation by shRNA in WM266-4 and IGR37 cell lines. A, bottom: Growth curve of shPIR and pSICO-infected WM266-4 and IGR37 cells. Cells were counted at 24-hour intervals for 4 days. Data points represent means ± SD of triplicate wells; one representative experiment of two is shown. B: Colony formation assay of shPIR cells, with pSICO-infected cells as control; 5000 WM266-4 and 10,000 IGR37 cells were seeded in triplicate plates, and plates were stained with Crystal Violet after 10 days. One representative plate for each condition is shown. C: Microscopic images in bright field after staining for SA-β-galactosidase in WM266-4 and IGR37 control (pSICO-R) and shPIR cells. D: Percentages of SA-β-galactosidase-positive cells, calculated on the sum of total and SA-β-galactosidase-positive cells counted in six independent fields. The experiment was repeated three times, with similar results.
The shPIR-transduced cell lines exhibited changes in size and morphology compatible with cellular senescence (flattened and enlarged phenotype). We therefore performed a senescence-associated β galactosidase (SA-β-galactosidase) assay and found that PIR knockdown in WM266-4 cells resulted in an increase from 2.1% positivity in control cells to 41.3%, 16.6%, and 37.1% in shPIR#7, #16, and #19 transduced cells, respectively (Figure 4, C and D). Similarly in IGR37 cells, SA-β-galactosidase staining was detected in 0.5% of control cells and in 7.6%, 13%, or 13.2% in shPIR#7, #16, and #19 cells, respectively (Figure 4, C and D). These results suggest that ablation of PIR is associated with induction of cellular senescence in PIR+ melanoma cells.
To assess whether senescence resulting from ablation of PIR is a specific feature of malignant melanocytic cells, we next analyzed the effect of PIR knockdown in normal cultured melanocytes. Infection with shPIR#7 and shPIR#19 resulted in efficient knockdown of the protein (Figure 5A) and induced an increase in the percentage of SA-β-galactosidase positive melanocytes from 7.7% to 28.3% for shPIR#7 and 41.1% for shPIR#19 (Figure 5, B and C). This result suggests that PIR expression is associated with negative control of cellular senescence also in nontransformed melanocytes.
Figure 5.
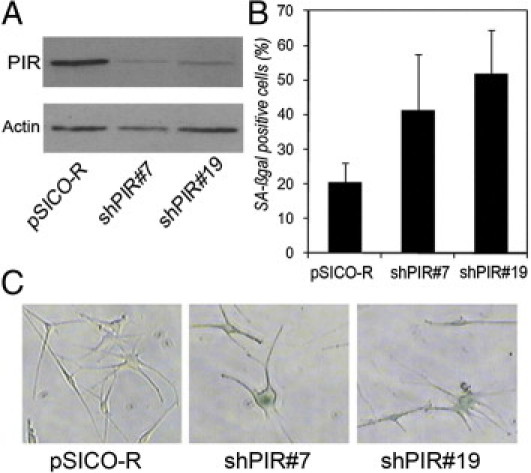
PIR ablation induces senescence in normal melanocytes. A: Western blot control of PIR knockdown in melanocytes. B: Percentages of SA-β-galactosidase-positive cells were calculated on the sum of total and SA-β-galactosidase-positive cells counted in six independent fields. The experiment was repeated twice, with similar results. C: Representative pictures of SA-β-galactosidase staining in pSICO-R, shPIR#7, and shPIR#19 melanocytes.
PIR Expression Is Down-Regulated by BRAF Activation and Camptothecin Treatment
BRAF mutations are frequent in nevi, and are directly linked to the induction of oncogene-induced senescence. Variations in PIR expression levels were therefore investigated in an experimental model of senescence induced by oncogenic BRAF. Human diploid fibroblasts (TIG3–hTERT) expressing a conditional form of constitutively activated BRAF fused to the ligand-binding domain of the estrogen receptor (ER) rapidly undergo oncogene-induced senescence on treatment with 4-hydroxytamoxifen (OHT).28,29 PIR protein and mRNA levels were measured in TIG3-BRAF-ER cells at different time points of treatment with 800 nmol/L OHT. PIR expression was significantly repressed both at the mRNA and at the protein level after BRAF activation (Figure 6A), and remained at low levels after 120 hours, suggesting that a significant reduction of PIR expression is associated with the establishment of oncogene-induced senescence in different cell types.
Figure 6.
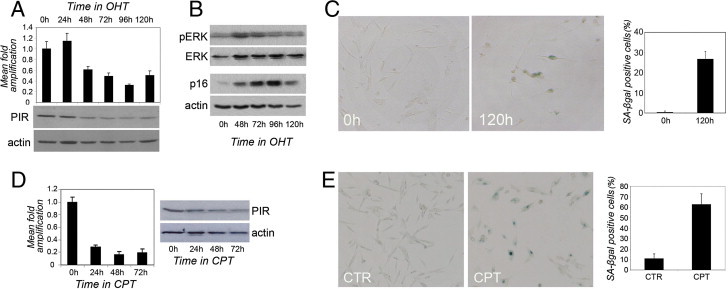
PIR expression is down-regulated by senescence stimuli. A, top: qRT-PCR analysis of PIR mRNA expression in TIG3 BRAF-ER cells on 800 nmol/L 4-hydroxytamoxifen (OHT) treatment to induce BRAF expression. Samples were run in triplicate and data were plotted as means ± SD. A, bottom: Western blot analysis of PIR protein expression in the same conditions. Actin was used as loading control. B: Western blot analysis of phospho-ERK (pERK), total ERK, p16, and actin expression in TIG3-BRAF-ER cells on 800 mmol/L OHT treatment. C: Representative images of SA-β-galactosidase staining in control cells (0 hours) and in cells treated with 800 nmol/L OHT for 120 hours, with quantification of percentages of SA-β-galactosidase-positive cells, calculated on the sum of total and SA-β-galactosidase-positive cells counted in six independent fields. The experiment was repeated twice, with similar results. D, left: qRT-PCR analysis of PIR mRNA expression in WM266-4 cells on treatment with camptothecin (CPT) at the indicated time points. Samples were run in triplicate and data were plotted as means ± SD. D, right: Western blot analysis of PIR protein expression in extracts from the same samples. E: Representative images of SA-β-galactosidase staining in control cells (CTR) and in cells treated with 250 nmol/L CPT for 96 hours (CPT), with quantification of percentages of SA-β-galactosidase-positive cells, calculated on the sum of total and SA-β-galactosidase-positive cells counted in six independent fields. The experiment was repeated twice, with similar results.
It has been shown that low levels of BRAF expression (induced by low doses of OHT) elicit a mitogenic response due to induction of cyclins D1 and E,28 while only a modest activity of mitogen-activated protein kinase (MAPK) is detected. In contrast, higher levels of BRAF result in high MAPK activity, and both conditions are associated with increased expression of cyclin-dependent kinase inhibitors and cell cycle arrest. As a read-out for effective induction of senescence in our experimental conditions, we therefore analyzed the phosphorylation levels of ELK-related tyrosine kinase ERK (p44/42 MAPK) and the expression of CDKN2A (p16INK4a) using Western blot analysis. OHT treatment and consequent BRAF expression resulted in a considerable increase in ERK phosphorylation within 48 hours, as expected for a high dose of OHT (Figure 6B; total ERK was used as control). After 72 hours of treatment and establishment of cell cycle arrest and senescence, ERK phosphorylation regains levels similar to its basal levels (Figure 6B).
In parallel, we observed a dramatic and progressive increase in the expression levels of CDKN2A (p16INK4a), a crucial player in the control of G1 cell cycle arrest and a well-known marker of senescence (Figure 6B). Moreover, SA-β-galactosidase staining of TIG3-BRAF-ER cells before and after 120 hours of OHT treatment showed approximately a 30-fold increase in the fraction of cells that express the senescence marker (Figure 6C). Taken together, our data suggest that BRAF activation in TIG3–hTERT cells induces cellular senescence that is accompanied by a significant repression of PIR expression.
To investigate whether PIR down-regulation is also associated with other stimuli that trigger senescence, PIR protein and mRNA levels were measured in WM266-4 melanoma cells treated with low doses of camptothecin (CPT), an antineoplastic agent that induces a senescence-like phenotype in colon cancer cells.30 PIR mRNA levels showed a fivefold decrease after 24 hours of CPT treatment, and a decrease in protein expression was clearly detectable after 48 hours (Figure 6D). Increased size, flattened morphology, and positive staining for SA-β-galactosidase activity after 96 hours of CPT treatment confirmed that cells had undergone senescence (Figure 6E). Thus, PIR down-regulation is not a specific feature of oncogene-induced senescence and can also be associated with senescence induced by treatment with cytotoxic agents.
Discussion
PIR is a highly conserved protein whose expression is deregulated in different tumor types. We found that expression of PIR is abundant in melanocytes, and analysis of PIR expression in different stages of melanoma progression revealed a complex and intriguing pattern. PIR is virtually absent in mature nevi, but is detectable at high levels in a proportion of primary and metastatic melanomas. The observed expression pattern suggests that PIR expression is switched off in nevi, and is reactivated in a subset of melanomas, in which PIR levels might increase as the disease progresses.
Gain and loss of function experiments were performed in PIR− or PIR+ melanoma cells to study the role of PIR in melanocytic cells. PIR overexpression in PIR− melanoma did not result in any significant effect on cell proliferation and survival. Instead, PIR ablation in normal melanocytes and in PIR+ melanoma cell lines induced growth arrest and a senescence-like phenotype. Cellular senescence is a protective mechanism triggered by a variety of stress stimuli, including DNA-damaging drugs and activated oncogenes. This anticancer barrier is of particular relevance in melanoma, which often stems from a nevus that is composed of senescent melanocytes.3 One could, therefore, hypothesize that the decrease in PIR levels that characterizes the transition from normal melanocytes to nevi is associated with the onset of cellular senescence. In accordance with this view, PIR expression in intradermal nevi is restricted to the superficial portion of the lesion, whereas deeper parts, which are rich in senescent cells, do not express PIR (data not shown). Furthermore, PIR levels rapidly and significantly decrease on expression of activated BRAF, which is an extremely frequent event in nevi and is directly associated with the onset of oncogene-induced senescence.8
PIR expression appears to be required to overcome the senescence barrier in PIR+ melanomas, given that its ablation in these models rapidly results in a senescence-like phenotype. Instead, PIR− melanomas likely reacquire the capacity to proliferate through mechanisms that do not involve PIR.
PIR down-regulation is not specific to oncogene-induced senescence, as shown by its rapid decrease in response to camptothecin treatment, and might therefore represent a more general feature of the senescence program induced by diverse stimuli in melanocytic cells. Notably, this effect is likely cell type-specific, because PIR ablation in other tissues yields different effects. We recently observed that PIR knockdown in hematopoietic precursors impairs terminal myeloid differentiation, and its down-regulation in leukemias may therefore contribute to the maturation arrest characteristic of acute myeloid leukemia.31
The molecular mechanisms underlying the role of PIR in counteracting senescence remain unknown. PIR may contribute to this phenotype by modulating the transcription of key regulators of senescence, but it may also exert its function through other mechanisms. A detailed analysis of PIR subcellular localization in melanoma revealed that advanced stage melanomas display increasing amounts of cytoplasmic PIR,27 suggesting the existence of additional functions that could confer yet unknown characteristics to tumor cells.
Our present results reveal a complex pattern of expression of PIR in melanoma and demonstrate that PIR is a negative regulator of senescence in melanocytic cells. Further studies are needed to elucidate the molecular mechanisms through which PIR participates in the control of cellular senescence.
Acknowledgments
We thank Dr. Giuseppe Ossolengo (Cogentech, Milan) for the production of anti-PIR antibody and Valentina Dall'Olio (Cogentech, Milan) for qRT-PCR experiments; Dr. Alessandro Testori (Istituto Europeo di Oncologia, Milan) for providing skin biopsies; the pathologists Dr. Renzo Boldorini (Università “Amedeo Avogadro” del Piemonte Orientale, Novara), Dr. Monica Leutner (Università “Amedeo Avogadro” del Piemonte Orientale, Novara), and Dr. Manuela Nebuloni (Universita' degli Studi di Milano) for collection of human samples; Dr. Meenhard Herlyn (The Wistar Institute, Philadelphia, PA) for melanoma cell lines; Dr. Kristian Helin for TIG3 BRAF-ER cells; Dr. Fabrizio D'Adda di Fagagna (Fondazione IFOM - Istituto FIRC di Oncologia Molecolare, Milan), Dr. Gabriele Sulli (Fondazione IFOM - Istituto FIRC di Oncologia Molecolare, Milan), and Dr. Luigi Pasini (Istituto Europeo di Oncologia, Milan) for helpful advice and discussion; and Dr. Joseph Kissil (The Wistar Institute, Philadelphia, PA) for helpful discussions and support in completing the experiments.
Footnotes
Supported by grants from the Italian Association for Cancer Research [Associazione Italiana per la Ricerca sul Cancro (AIRC)] (M.A.) and Fondazione CARIPLO (M.A. and C.T.).
Supplemental material for this article can be found at http://ajp.amjpathol.org or at doi:10.1016 /j.ajpath.2011.01.019.
Current address of S.L.: Molecular and Cellular Oncogenesis Program, The Wistar Institute, Philadelphia, Pennsylvania; Immunocytochemistry, of P.N.: Oncology Translational Laboratories–Molecular Pathology, Novartis Pharma AG, Basel, Switzerland.
Supplementary data
Characterization of polyclonal anti-PIR antibody. A: Pirin (PIR) coding sequence was cloned in the pcDNA3-Flag vector (Addgene, Cambridge, MA) and transiently transfected in HeLa cells. Empty pcDNA3-Flag transfected HeLa cells were used as control. After 48 hours, cells were lysed and protein extracts were used for Western blot. Anti-PIR serum was diluted 1:1000, 1:5000, and 1:10,000; a band was detected at the expected size (32 kDa). Note that at highest concentration (1:1000) the antibody also detected endogenous PIR, which is slightly smaller than Flag-tagged PIR. Vinculin was used as loading control. B: Immunofluorescence. HeLa cells transfected with pcDNA3-Flag-PIR were costained 48 hours after transfection with anti-PIR antibody and anti-Flag antibody (Sigma-Aldrich). Anti-PIR was followed by Cy3-conjugated anti-rabbit secondary antibody and anti-Flag was followed by fluorescein isothiocyanate (FITC)-conjugated anti-mouse secondary antibody (secondary antibodies from Jackson Immunoresearch Laboratories, West Grove, PA). Nuclei were stained with DAPI. Anti-PIR dilution 1:5000. C: Pirin transient knockdown was achieved using a siGENOME siRNA SMARTpool reagent (Dharmacon, Lafayette, CO). On-target plus siCONTROL siRNA (Dharmacon) was used as a control (ctr). HeLa cells were seeded in a 6-well plate 24 hours before siRNA transfection.; 200 pmol/L siRNA oligonucleotides were transfected with Oligofectamine (Invitrogen) in serum-free medium. Cells that underwent the transfection procedure without the addition of any oligonucleotides (no siRNA) were also analyzed to exclude off-target effects. At 72 hours after transfection, cells were lysed and protein extracts were used for Western blot. Anti-PIR was diluted 1:5000. D: Immunofluorescence. HeLa cells were transfected as in C) and stained with anti-PIR diluted 1:5000. Exposure time was high to show staining of residual PIR protein. E: Immunohistochemistry. After transfection, 10 × 106 cells in 50 μL of PBS were mixed to 50 μL of 1% agarose. After the block was solid, it was fixed in formalin and embedded in paraffin for IHC. Anti-PIR was diluted 1:5000.
References
- 1.Hayflick L., Moorhead P.S. The serial cultivation of human diploid cell strains. Exp Cell Res. 1961;25:585–621. doi: 10.1016/0014-4827(61)90192-6. [DOI] [PubMed] [Google Scholar]
- 2.Serrano M., Lin A.W., McCurrach M.E., Beach D., Lowe S.W. Oncogenic ras provokes premature cell senescence associated with accumulation of p53 and p16INK4a. Cell. 1997;88:593–602. doi: 10.1016/s0092-8674(00)81902-9. [DOI] [PubMed] [Google Scholar]
- 3.Bennett D.C. Human melanocyte senescence and melanoma susceptibility genes. Oncogene. 2003;22:3063–3069. doi: 10.1038/sj.onc.1206446. [DOI] [PubMed] [Google Scholar]
- 4.Ben-Porath I., Weinberg R.A. The signals and pathways activating cellular senescence. Int J Biochem Cell Biol. 2005;37:961–976. doi: 10.1016/j.biocel.2004.10.013. [DOI] [PubMed] [Google Scholar]
- 5.Wynford-Thomas D. Cellular senescence and cancer. J Pathol. 1999;187:100–111. doi: 10.1002/(SICI)1096-9896(199901)187:1<100::AID-PATH236>3.0.CO;2-T. [DOI] [PubMed] [Google Scholar]
- 6.Collado M., Gil J., Efeyan A., Guerra C., Schuhmacher A.J., Barradas M., Benguria A., Zaballos A., Flores J.M., Barbacid M., Beach D., Serrano M. Tumour biology: senescence in premalignant tumours. Nature. 2005;436:642. doi: 10.1038/436642a. [DOI] [PubMed] [Google Scholar]
- 7.Gray-Schopfer V.C., Cheong S.C., Chong H., Chow J., Moss T., Abdel-Malek Z.A., Marais R., Wynford-Thomas D., Bennett D.C. Cellular senescence in naevi and immortalisation in melanoma: a role for p16. Br J Cancer. 2006;95:496–505. doi: 10.1038/sj.bjc.6603283. [DOI] [PMC free article] [PubMed] [Google Scholar]
- 8.Michaloglou C., Vredeveld L.C., Soengas M.S., Denoyelle C., Kuilman T., van der Horst C.M., Majoor D.M., Shay J.W., Mooi W.J., Peeper D.S. BRAFE600-associated senescence-like cell cycle arrest of human naevi. Nature. 2005;436:720–724. doi: 10.1038/nature03890. [DOI] [PubMed] [Google Scholar]
- 9.Ha L., Merlino G., Sviderskaya E.V. Melanomagenesis: overcoming the barrier of melanocyte senescence. Cell Cycle. 2008;7:1944–1948. doi: 10.4161/cc.7.13.6230. [DOI] [PMC free article] [PubMed] [Google Scholar]
- 10.Krimpenfort P., Quon K.C., Mooi W.J., Loonstra A., Berns A. Loss of p16Ink4a confers susceptibility to metastatic melanoma in mice. Nature. 2001;413:83–86. doi: 10.1038/35092584. [DOI] [PubMed] [Google Scholar]
- 11.Pollock P.M., Harper U.L., Hansen K.S., Yudt L.M., Stark M., Robbins C.M., Moses T.Y., Hostetter G., Wagner U., Kakareka J., Salem G., Pohida T., Heenan P., Duray P., Kallioniemi O., Hayward N.K., Trent J.M., Meltzer P.S. High frequency of BRAF mutations in nevi. Nat Genet. 2003;33:19–20. doi: 10.1038/ng1054. [DOI] [PubMed] [Google Scholar]
- 12.Davies H., Bignell G.R., Cox C., Stephens P., Edkins S., Clegg S. Mutations of the BRAF gene in human cancer. Nature. 2002;417:949–954. doi: 10.1038/nature00766. [DOI] [PubMed] [Google Scholar]
- 13.Dhomen N., Reis-Filho J.S., da Rocha Dias S., Hayward R., Savage K., Delmas V., Larue L., Pritchard C., Marais R. Oncogenic Braf induces melanocyte senescence and melanoma in mice. Cancer Cell. 2009;15:294–303. doi: 10.1016/j.ccr.2009.02.022. [DOI] [PubMed] [Google Scholar]
- 14.Pang H., Bartlam M., Zeng Q., Miyatake H., Hisano T., Miki K., Wong L.L., Gao G.F., Rao Z. Crystal structure of human pirin: an iron-binding nuclear protein and transcription cofactor. J Biol Chem. 2004;279:1491–1498. doi: 10.1074/jbc.M310022200. [DOI] [PubMed] [Google Scholar]
- 15.Wendler W.M., Kremmer E., Forster R., Winnacker E.L. Identification of pirin, a novel highly conserved nuclear protein. J Biol Chem. 1997;272:8482–8489. doi: 10.1074/jbc.272.13.8482. [DOI] [PubMed] [Google Scholar]
- 16.Miyazaki I, Simizu S, Okumura H, Takagi S, Osada H: A small-molecule inhibitor shows that pirin regulates migration of melanoma cells. Nat Chem Biol 6:667–673 [DOI] [PubMed]
- 17.Adams M., Jia Z. Structural and biochemical analysis reveal pirins to possess quercetinase activity. J Biol Chem. 2005;280:28675–28682. doi: 10.1074/jbc.M501034200. [DOI] [PubMed] [Google Scholar]
- 18.Gelbman B.D., Heguy A., O'Connor T.P., Zabner J., Crystal R.G. Upregulation of pirin expression by chronic cigarette smoking is associated with bronchial epithelial cell apoptosis. Respir Res. 2007;8:10. doi: 10.1186/1465-9921-8-10. [DOI] [PMC free article] [PubMed] [Google Scholar]
- 19.Orzaez D., de Jong A.J., Woltering E.J. A tomato homologue of the human protein PIRIN is induced during programmed cell death. Plant Mol Biol. 2001;46:459–468. doi: 10.1023/a:1010618515051. [DOI] [PubMed] [Google Scholar]
- 20.Capra M., Nuciforo P.G., Confalonieri S., Quarto M., Bianchi M., Nebuloni M., Boldorini R., Pallotti F., Viale G., Gishizky M.L., Draetta G.F., Di Fiore P.P. Frequent alterations in the expression of serine/threonine kinases in human cancers. Cancer Res. 2006;66:8147–8154. doi: 10.1158/0008-5472.CAN-05-3489. [DOI] [PubMed] [Google Scholar]
- 21.Smalley K.S., Brafford P., Haass N.K., Brandner J.M., Brown E., Herlyn M. Up-regulated expression of zonula occludens protein-1 in human melanoma associates with N-cadherin and contributes to invasion and adhesion. Am J Pathol. 2005;166:1541–1554. doi: 10.1016/S0002-9440(10)62370-X. [DOI] [PMC free article] [PubMed] [Google Scholar]
- 22.Fagiani E., Giardina G., Luzi L., Cesaroni M., Quarto M., Capra M., Germano G., Bono M., Capillo M., Pelicci P., Lanfrancone L. RaLP, a new member of the Src homology and collagen family, regulates cell migration and tumor growth of metastatic melanomas. Cancer Res. 2007;67:3064–3073. doi: 10.1158/0008-5472.CAN-06-2301. [DOI] [PubMed] [Google Scholar]
- 23.Ventura A., Meissner A., Dillon C.P., McManus M., Sharp P.A., Van Parijs L., Jaenisch R., Jacks T. Cre-lox-regulated conditional RNA interference from transgenes. Proc Natl Acad Sci USA. 2004;101:10380–10385. doi: 10.1073/pnas.0403954101. [DOI] [PMC free article] [PubMed] [Google Scholar]
- 24.Grignani F., Kinsella T., Mencarelli A., Valtieri M., Riganelli D., Lanfrancone L., Peschle C., Nolan G.P., Pelicci P.G. High-efficiency gene transfer and selection of human hematopoietic progenitor cells with a hybrid EBV/retroviral vector expressing the green fluorescence protein. Cancer Res. 1998;58:14–19. [PubMed] [Google Scholar]
- 25.Breslow A. Tumor thickness, level of invasion and node dissection in stage I cutaneous melanoma. Ann Surg. 1975;182:572–575. doi: 10.1097/00000658-197511000-00007. [DOI] [PMC free article] [PubMed] [Google Scholar]
- 26.Clark W.H., Jr Human cutaneous malignant melanoma as a model for cancer. Cancer Metastasis Rev. 1991;10:83–88. doi: 10.1007/BF00049406. [DOI] [PubMed] [Google Scholar]
- 27.Licciulli S., Luise C., Zanardi A., Giorgetti L., Viale G., Lanfrancone L., Carbone R., Alcalay M. Pirin delocalization in melanoma progression identified by high content immuno-detection based approaches. BMC Cell Biol. 2010;11:5. doi: 10.1186/1471-2121-11-5. [DOI] [PMC free article] [PubMed] [Google Scholar]
- 28.Woods D., Parry D., Cherwinski H., Bosch E., Lees E., McMahon M. Raf-induced proliferation or cell cycle arrest is determined by the level of Raf activity with arrest mediated by p21Cip1. Mol Cell Biol. 1997;17:5598–5611. doi: 10.1128/mcb.17.9.5598. [DOI] [PMC free article] [PubMed] [Google Scholar]
- 29.Agger K., Cloos P.A., Rudkjaer L., Williams K., Andersen G., Christensen J., Helin K. The H3K27me3 demethylase JMJD3 contributes to the activation of the INK4A-ARF locus in response to oncogene- and stress-induced senescence. Genes Dev. 2009;23:1171–1176. doi: 10.1101/gad.510809. [DOI] [PMC free article] [PubMed] [Google Scholar]
- 30.Han Z., Wei W., Dunaway S., Darnowski J.W., Calabresi P., Sedivy J., Hendrickson E.A., Balan K.V., Pantazis P., Wyche J.H. Role of p21 in apoptosis and senescence of human colon cancer cells treated with camptothecin. J Biol Chem. 2002;277:17154–17160. doi: 10.1074/jbc.M112401200. [DOI] [PubMed] [Google Scholar]
- 31.Licciulli S., Cambiaghi V., Scafetta G., Gruszka A.M., Alcalay M. Pirin downregulation is a feature of AML and leads to impairment of terminal myeloid differentiation. Leukemia. 2010;24:429–437. doi: 10.1038/leu.2009.247. [DOI] [PubMed] [Google Scholar]
Associated Data
This section collects any data citations, data availability statements, or supplementary materials included in this article.
Supplementary Materials
Characterization of polyclonal anti-PIR antibody. A: Pirin (PIR) coding sequence was cloned in the pcDNA3-Flag vector (Addgene, Cambridge, MA) and transiently transfected in HeLa cells. Empty pcDNA3-Flag transfected HeLa cells were used as control. After 48 hours, cells were lysed and protein extracts were used for Western blot. Anti-PIR serum was diluted 1:1000, 1:5000, and 1:10,000; a band was detected at the expected size (32 kDa). Note that at highest concentration (1:1000) the antibody also detected endogenous PIR, which is slightly smaller than Flag-tagged PIR. Vinculin was used as loading control. B: Immunofluorescence. HeLa cells transfected with pcDNA3-Flag-PIR were costained 48 hours after transfection with anti-PIR antibody and anti-Flag antibody (Sigma-Aldrich). Anti-PIR was followed by Cy3-conjugated anti-rabbit secondary antibody and anti-Flag was followed by fluorescein isothiocyanate (FITC)-conjugated anti-mouse secondary antibody (secondary antibodies from Jackson Immunoresearch Laboratories, West Grove, PA). Nuclei were stained with DAPI. Anti-PIR dilution 1:5000. C: Pirin transient knockdown was achieved using a siGENOME siRNA SMARTpool reagent (Dharmacon, Lafayette, CO). On-target plus siCONTROL siRNA (Dharmacon) was used as a control (ctr). HeLa cells were seeded in a 6-well plate 24 hours before siRNA transfection.; 200 pmol/L siRNA oligonucleotides were transfected with Oligofectamine (Invitrogen) in serum-free medium. Cells that underwent the transfection procedure without the addition of any oligonucleotides (no siRNA) were also analyzed to exclude off-target effects. At 72 hours after transfection, cells were lysed and protein extracts were used for Western blot. Anti-PIR was diluted 1:5000. D: Immunofluorescence. HeLa cells were transfected as in C) and stained with anti-PIR diluted 1:5000. Exposure time was high to show staining of residual PIR protein. E: Immunohistochemistry. After transfection, 10 × 106 cells in 50 μL of PBS were mixed to 50 μL of 1% agarose. After the block was solid, it was fixed in formalin and embedded in paraffin for IHC. Anti-PIR was diluted 1:5000.