

Abstract
Identification of epigenetically affected genes has become an important tool for understanding both normal and aberrant gene expression in cancer. Here we report a whole-genome analysis of DNA methylation profiles in fresh-frozen oropharyngeal squamous cell carcinoma (OPSCC) tissues and normal mucosa samples using microarray technology with patient genomic DNA. We initially compared whole-genome patterns of DNA methylation among 24 OPSCC primary tumors and 24 matched normal mucosal samples. From a survey of 27,578 CpG dinucleotide loci spanning more than 14,000 genes, we identified 958 CpG loci in which measurements of DNA methylation were altered in the primary tumors relative to the normal mucosal samples. These alterations were validated in an independent set of 21 OPSCC patients. A survey of these loci by chromosomal location revealed an abnormally high number of differentially methylated loci on chromosome 19. Many of the loci on chromosome 19 are associated with genes belonging to the Krüppel-type zinc finger protein genes. Hypermethylation was accompanied by a significant decrease in expression of these genes in OPSCC primary tumors relative to adjacent mucosa. This study reports the epigenetic silencing of Krüppel-type zinc finger protein genes on chromosome 19q13 in oropharyngeal cancer. The aberrant methylation of these genes represents a new avenue of exploration for pathways affected in this disease.
Head and neck squamous cell carcinoma (HNSCC), an anatomically heterogeneous group arising most often from the oral cavity, oropharynx, hypopharynx, larynx, and nasopharynx, is the fifth most common malignancy in men worldwide, representing a major international health problem.1 Unfortunately, the 5-year survival rate has improved only marginally over the past decade; as a result, it is estimated that more than 45,000 new cases and 11,000 deaths will occur in 2011 in the United States from HNSCC.2 Despite treatment intervention, recurrence of the disease is observed in about 50% of patients, either locally, regionally, or at a distant site with high rates of associated mortality.3 Given the genetic complexity of this disease, it is not surprising that correlations with individual genetic abnormalities have so far been disappointing. To date, there are few molecular markers that can be used reliably in either early detection or as indicators of prognosis. Some genetic aberrations have been investigated as markers of disease progression and/or outcome, including gains of 3q, 8q, 9q, 20q, 7p, 11q13, and 5p, and losses of 3p, 9p, 21q, 5q, 13q, 18q, and 8p.4,5
Evidence has now established that aberrant DNA methylation and chromatin remodeling associated with promoters, or first exons of genes, is one mechanism frequently associated with the transcriptional silencing of critical genes in HNSCC and other cancers.6 Identification of epigenetically affected genes has therefore become an important tool for understanding aberrant gene expression in cancer. Numerous studies have identified promoter methylation of CDKN2A (p16), DAPK (DAP kinase), and DNA repair genes MGMT and MLH1.7,8 In many cases, these epigenetic markers were of prognostic value. For example, in HNSCC patients, methylation of the promoter region of MGMT was associated with decreased expression of MGMT, as well as increased tumor recurrence and decreased patient survival, independent of other factors.9 In studies by Ogi and co-workers10 with oral SCC, methylation of the DCC gene was associated significantly with bone invasion by gingival tumors, aggressive invasiveness of tumors of the tongue, and reduced survival. Methylation of two CpG islands (MINT1 and MINT31) also correlated with poor prognosis in these patients, whereas methylation of p14ARF actually correlated with a good prognosis. Invasion and metastasis of oral SCC cells recently have been shown to be dependent on methylation of the E-cadherin promoter with associated reduction of E-cadherin expression.11 Within the oropharynx, there is a statistically significant association between hypermethylation of the DAPK1 gene and the occurrence of lymph node metastases, and in the larynx there was statistically significant evidence of an association between hypermethylation of the ADAM23 gene and advanced stages of the tumors.12 Overall, the considerable variability in promoter methylation events among the tumor population makes a high-throughput approach an intriguing means to identify prognostic epigenetic markers in HNSCC disease.
Here, we describe experiments designed to measure global DNA methylation in primary tumor and matched mucosal samples of 45 patients with oropharyngeal squamous cell carcinoma. From these data, we identified a total of 958 differentially methylated CpG loci that were distributed across the human genome. Of particular interest were the high magnitude of differentially methylated CpG loci identified on chromosome 19, including a cluster of Krüppel-type zinc finger protein (ZNF) genes.
Materials and Methods
Oropharyngeal Squamous Cell Carcinoma Tissue Samples
Patients recruited for this study were undergoing treatment for histologically confirmed oropharyngeal squamous cell carcinoma (OPSCC) at Montefiore Medical Center (Bronx, NY). (Table 1). The patients were assigned to two independent patient groups based on the time of their initial enrolment. Patient set 1 comprised the initial 24 OPSCC patients in our study. Patient set 2 comprised an additional 21 OPSCC patients enrolled at a later date. All 45 patients consented to participation in this study under protocols approved by the Institutional Review Boards of the participating institutions. All primary tumor and histologically normal adjacent tissues were snap-frozen in liquid nitrogen within 30 minutes of surgical resection or biopsy and kept at −80°C until further processing. Normal mucosa was taken at a grossly unremarkable site away from the tumor identified by the surgeon (incisional biopsy) intraoperatively or the pathologist (resection specimen) when processing the specimen for frozen section or final diagnosis.
Table 1.
Clinical Characteristics of Recruited OPSCC Patients
| Patient set 1(N = 24) | Patient set 2(N = 21) | |
|---|---|---|
| N (%) | N (%) | |
| Male | 19 (79) | 16 (76) |
| Female | 5 (21) | 5 (24) |
| Median age (range, years) | 62 (40–79) | 61 (46–84) |
| Race | ||
| White | 16 (67) | 11 (52) |
| Black | 5 (21) | 10 (48) |
| Unknown | 3 (12) | 0 (0) |
| Ethnicity | ||
| Hispanic/Latino | 6 (25) | 5 (24) |
| Non-Hispanic/Latino | 16 (67) | 16 (76) |
| Unknown | 2 (8) | 0 (0) |
| Tumor stage | ||
| I | 1 (4) | 7 (33) |
| II | 2 (8) | 4 (19) |
| III | 3 (13) | 0 (0) |
| IV | 18 (75) | 10 (48) |
| Node status | ||
| N0 | 3 (13) | 11 (52) |
| N1 | 4 (17) | 1 (5) |
| N2 | 13 (54) | 8 (38) |
| N3 | 4 (17) | 1 (5) |
| Total | 24 (100) | 21 (100) |
Histologic confirmation of tumors was performed by a single pathologist assessing tumor grade, tumor-node-metastasis staging based on the American Joint Committee on Cancer classification, and degree of lymphocytic infiltration. Control samples for all tumors were acquired; microscopy slides stained with H&E were assessed for percentage of tumor, extent of necrosis, and degree of lymphocytic infiltration. When a study sample was derived from an incisional biopsy, half of the specimen was submitted for study purposes and half was used as a control sample. The study samples derived from resection specimens were taken either adjacent to a frozen section block obtained at intraoperative consultation, or adjacent to the first block of tumor sample taken for permanent sections.
The percentage of tumor and extent of necrosis were estimated by determining the number of microscopic fields containing tumor or necrotic tissue in relation to the total number of microscopic fields of the control sample on the slide. The lymphocytic infiltrate was graded at the tumor–host interface as one of three categories: strong (score = 1), intermediate (score = 2), and poor (score = 3), corresponding to approximately 21% to 30%, 6% to 20%, and 0% to 5% lymphocytic component, respectively. Grades were assigned as follows: if there was at least one lymphoid aggregate in each consecutive low-power field at the tumor–host interface then the lymphocytic component was judged as strong. A lymphoid aggregate was defined as lymphocytes occupying at least half of a microscopic field using a ×20 objective. An intermediate lymphocytic component was defined as having at least one lymphoid aggregate in one of the low-power fields at the tumor–host interface, but not in every low-power field. When no lymphoid aggregates were found, the lymphoid component was deemed poor. When the tumor–host interface was too small to use the schema described earlier then the lymphoid component was categorized according to the percentage ranges described earlier.
The majority of the tumor samples (n = 33) were composed of 50% or more invasive squamous cell carcinoma, although a subset of samples (n = 11) had <50% tumor, ranging from 5% to 40%, with only one sample containing 5% tumor. Tumor necrosis was noted in 10 samples, ranging from 1% to 20% of tumor. Lymphocytic infiltrate was a variable part of the nontumor component of the sample, ranging from <1% to approximately 30%. The lymphocytic infiltrate was predominantly present at the tumor–host interface where its density was assessed. Most tumor samples (n = 29) had a poor intermediate lymphocytic reaction, and in only 10 samples did lymphocytes comprise one third of the nontumor component.
Genome-Wide Methylation Profiling of Tissue Genomic DNA
Genomic DNA was isolated from snap-frozen tissue using the Qiagen DNeasy tissue kit (Valencia, CA). Quantity and purity of isolated DNA was measured spectrophotometrically using a NanoDrop ND-1000 spectrophotometer (Wilmington, DE). Bisulfite conversion of tissue genomic DNA was performed using the EZ DNA Gold methylation kit (Zymo Research, Irvine, CA). Profiling of genome-wide DNA methylation in genomic DNA (500 ng) was performed using the Illumina (San Diego, CA) Infinium assay with the HumanMethylation27 DNA Analysis beadchip. We interrogated 27,578 CpG loci covering more than 14,000 genes at single-nucleotide resolution. The methylation level at each CpG loci on the beadchip was determined by measuring approximately 20 independent measures of the methylation fraction (β), defined as the fraction of methylated signal over the total signal (unmethylated + methylated fractions) in each genomic DNA sample. This value ranged continuously from 0 (unmethylated) to 1 (fully methylated) for each CpG locus. Individual beadchip controls (DNA sample-dependent and sample-independent) confirmed efficient bisulfite conversion of DNA, hybridization specificity, base extension, and target removal for all genomic DNA samples (see Supplemental Table S1 at http://ajp.amjpathol.org). A complete description of these controls is available from the manufacturer.13
Bisulfite Sequencing
Primers for PCR amplification of bisulfite-converted genomic DNA were as follows: ZNF447-Bis forward, 5′-GGGAATATTTTGGTTTTTTTT-3′, and ZNF447-Bis reverse, 5′-TAAACCTTCATACTTCTCTCCCTC-3′; ZNF132-Bis forward, 5′-GGATTTGTTTTTTTAAATGTAAAATG-3′, and ZNF132-Bis reverse, 5′-CTACCAATAACCAACCCTAAAACAC-3′. PCR reactions (50 μL) were performed using HotStarTaq Plus Master Mix Kit (Qiagen). Initial denaturation of template DNA (95°C, 5 minutes) was followed by 35 cycles of 94°C (1 minute), 57°C (1 minute), and 72°C (1 minute). PCR products were resolved on a 1.5% agarose gel to confirm sizes of products for ZNF447 and ZNF132 (490 bp and 494 bp, respectively). No primer pairs amplified untreated genomic DNA (data not shown). Sequencing of PCR products was performed in both directions using an ABI 3730 DNA Analyzer (Applied Biosystems, Carlsbad, CA). In addition to all patient samples, control methylated human genomic DNA and human unmethylated genomic DNA (Zymo Research) were arrayed as positive and negative controls, respectively.
Quantitative Real-Time PCR
Expressions of ZNF447 and ZNF132 in tissue samples were measured using TaqMan One-Step RT-PCR Master Mix Kit (Applied Biosystems) with probes Hs00225073_m1 (ZNF447) and Hs01036387_m1 (ZNF132). Expression of all genes was normalized using a glyceraldehyde-3-phosphate dehydrogenase control probe (Hs99999905_m1). P values for the difference in expression between primary tumor and adjacent mucosal tissue were calculated using a Wilcoxon t-test.
Results
As part of a high-throughput approach to the identification of aberrant DNA methylation of CpG loci in OPSCC, we initially studied 24 patients undergoing treatment for OPSCC at Montefiore Medical Center in the Bronx, a high-risk area of New York City with a high incidence of head and neck cancer (Table 1, patient set 1). All pathologic grades of tumor were represented, although the majority (N = 18; 75%) had stage IV disease at presentation. Twenty-one patients (88%) had a positive nodal status at presentation. Prevalence of human papilloma virus type 16 (HPV16) in these tumors, defined by the detection of HPV DNA by MY09/11 (degenerate and type-specific HPV16-L1 fragments) or nested PCR protocols (HPV16-E6 plus URR), was 59%. For all of these patients, we also collected histologically normal mucosa in parallel with tumor tissue collection. In the case of tumor resections, this represented histologically normal tissue approximately 1 cm away from the primary tumor. In the case of tumor biopsies, this represented tissue taken from the contralateral side.
For each patient, we profiled the degree and pattern of DNA methylation observed in genomic DNA from each tissue sample using the Illumina HumanMethylation27 DNA Analysis beadchip. Of the 27,578 CpG loci on the beadchip, 20,006 loci resided in regions classically defined as CpG island sequences, whereas the remaining 7572 loci resided outside of classically defined CpG islands.14 By using the β values as a measure of DNA methylation in each pair of patient samples, we defined a differentially methylated CpG locus as one in which the difference in the β value between the OPSCC primary tumor and the corresponding adjacent normal mucosa was at least 0.20. The choice of 0.20 as a criterion for a difference in β was based largely on replicate experiments (10 replicates each of 8 biological samples) by Illumina scientists that showed that the HumanMethylation27 beadchip reliably could detect a difference in β of <0.2 with a <1% false-positive rate.15
Chromosomal Distribution of Differentially Methylated CpG Loci
Of the 27,278 CpG loci on the microarray, the average number of CpG loci showing increased methylation in the primary tumor (difference in β, >0.20) was 2040 (range, 527–5770). The average number of CpG loci showing decreased methylation in the primary tumor (difference in β, <−0.20) was 2115 (range, 562–3929). When data from the first population of 24 OPSCC patients were analyzed as a group, we identified 958 CpG loci whose difference in β between primary tumor and normal mucosa was at least 0.20 when averaged across the 24 patients. This does not imply that these loci were methylated in all 24 patients, but only indicates that these CpG loci differed in β values between the tumors and corresponding normals by at least 0.2 when averaged across the initial dataset of 24 patients. Of these loci, 630 CpG loci were hypermethylated in the primary tumors relative to normal mucosa whereas 328 were hypomethylated. Not surprisingly, the vast majority of the 630 hypermethylated CpG loci (614 loci; 97%) were located within classically defined CpG island sequences. In contrast, the 328 hypomethylated CpG loci were located predominantly outside of CpG island sequences (254 loci; 77%). However, it should be noted that a significant number of hypomethylated CpG loci (74 loci; 33%) did reside within CpG island sequences and may represent genes regulated by a mechanism of DNA hypomethylation in OPSCC.
Chromosome 19 had the highest overall number of differentially methylated CpG loci (n = 78) in our OPSCC patient samples. Of the 78 differentially methylated CpG loci identified on chromosome 19, 58 resided within the boundaries of defined CpG islands, whereas the other 20 resided outside of CpG islands. Not surprisingly, the direction of aberrant methylation (hypomethylation versus hypermethylation) largely coincided with a CpG loci's location within, or outside of, a defined CpG island sequence. Also, the magnitudes of changes in DNA methylation in chromosome 19–specific CpG loci were among the largest that we observed. When all 958 differentially methylated CpGs identified genome-wide in our analysis were ranked (highest to lowest) according to the magnitude of their average difference in β across patient set 1, 14 of the top 50 differentially methylated CpG loci (28%) were located on chromosome 19 (Figure 1). In fact, 9 of these 14 differentially methylated CpG loci were located within a 6.5-Mb region covering chromosomal positions 58188507 (19q13.41) to 63643484 (19q13.43).
Figure 1.
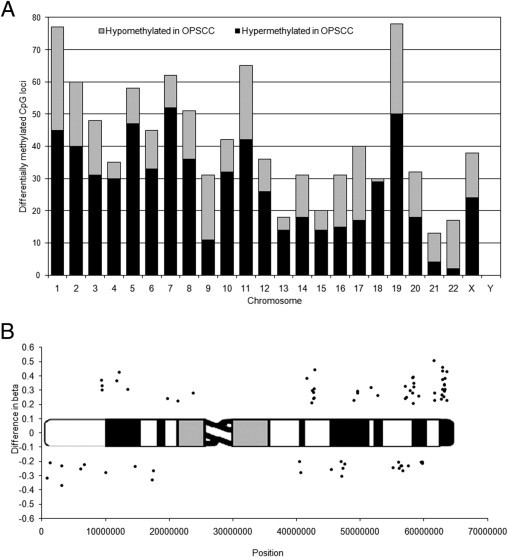
A: Chromosomal distribution of all 958 differentially methylated CpG loci according to chromosomal location on the human genome. Hypermethylated CpG loci (average difference, >0.2) are shown in black, hypomethylated CpG loci (average difference, <−0.2) are shown in gray. Chromosome 18 showed the highest percentage of differentially methylated CpG loci in our analysis (7.6%; n = 30 CpG loci) relative to the number of CpG loci measured for each chromosome on the beadchip (395 CpG loci). B: Differentially methylated CpG loci on chromosome 19. Data points are plotted as the average difference in β between OPSCC tumor and normal mucosa for the 24 patients in patient set 1 versus their chromosomal position. Points above the ideogram are identified as hypermethylated in OPSCC; those below the ideogram are identified as hypomethylated. Chromosome 19 had the highest number of differentially methylated CpG loci (n = 78) in our OPSCC patient samples. When all 958 differentially methylated CpGs were ranked according to their average difference in β across patient set 1, 14 of the top 50 differentially methylated CpG loci (28%) in our dataset were located on chromosome 19.
It was noteworthy that the vast majority of the 50 hypermethylated CpG loci identified on chromosome 19 were associated with genes belonging to the family of Krüppel-type zinc finger proteins (Table 2). Although hundreds of these genes are known to exist in the human genome as transcriptional regulators, many of their downstream targets remain unknown.16 All of the 14 chromosome 19–specific CpG loci mentioned previously that were part of the top 50 hypermethylated CpG loci in our dataset belonged to the Krüppel family zinc finger proteins. These 14 CpG loci were located within the CpG islands of 13 Krüppel family proteins, including ZNF132, ZNF154 (2 CpGs), ZNF177, ZNF415, ZNF447, ZNF491, ZNF542, ZNF545, ZNF625, ZNF671, ZNF677, ZNF702, and ZNF781. The CpG loci at chromosomal position 61571383 corresponding to gene ZNF542 was the top ranked hypermethylated locus across all 630 hypermethylated CpG loci identified in the genome (patient set 1 average difference in β, 0.51). It met the criteria for hypermethylation (difference in β, >0.20) for 18 of the 24 OPSCC patients. Other hypermethylated genes of note were two subunits of voltage-dependent calcium channels (CACNA1A and CACNG6).
Table 2.
Partial List of Differentially Methylated CpG Loci on Chromosome 19
| Location | CpG island | Gene symbol | Product | Patient set 1 |
Patient set 2 |
Patient set 2 |
Patient set 2 |
|---|---|---|---|---|---|---|---|
| Average difference in β (OPSCC vs mucosa) | Average β (OPSCC, N = 21) | Average β (mucosa, N = 21) | P value⁎ | ||||
| 3129759 | 19:3129659-3131083 | EDG6 | Endothelial differentiation; G-protein–coupled receptor 6 | −0.37 | 0.37 | 0.72 | <0.001 |
| 6723831 | 19:6723684-6723897 | VAV1 | Vav 1 oncogene | −0.22 | 0.33 | 0.52 | <0.001 |
| 9334696 | 19:9334490-9335153 | ZNF177 | Zinc finger protein 177 | 0.37 | 0.68 | 0.29 | <0.001 |
| 13477871 | 19:13477638-13478603 | CACNA1A | Calcium channel; α 1A subunit isoform 2 | 0.31 | 0.58 | 0.25 | <0.001 |
| 17377329 | 19:17377186-17377387 | BST2 | Bone marrow stromal cell antigen 2 | −0.33 | 0.24 | 0.56 | <0.001 |
| 42649837 | 19:42649044-42650631 | ZNF569 | Zinc finger protein 569 | 0.28 | 0.19 | 0.04 | <0.001 |
| 42650293 | 19:42649044-42650631 | ZNF569 | Zinc finger protein 569 | 0.24 | 0.19 | 0.03 | <0.001 |
| 42733963 | 19:42733846-42734771 | ZNF540 | Zinc finger protein 540 | 0.25 | 0.53 | 0.29 | <0.001 |
| 42734312 | 19:42733846-42734771 | ZNF540 | Zinc finger protein 540 | 0.31 | 0.68 | 0.30 | <0.001 |
| 47073790 | CD79A | CD79A antigen isoform 1 precursor | −0.30 | 0.40 | 0.64 | <0.001 | |
| 55156525 | SIGLEC11 | Sialic acid binding Ig-like lectin 11 | −0.24 | 0.29 | 0.50 | <0.001 | |
| 56026308 | KLK15 | Kallikrein 15 isoform 1 preproprotein | −0.20 | 0.54 | 0.70 | <0.001 | |
| 56067705 | KLK2 | Kallikrein 2; prostatic isoform 1 | −0.25 | 0.36 | 0.60 | <0.001 | |
| 56696442 | SIGLEC12 | Sialic acid binding imm-like lectin-like 1 iso b | −0.27 | 0.31 | 0.52 | <0.001 | |
| 58327889 | 19:58327559-58328183 | ZNF415 | Zinc finger protein 415 | 0.39 | 0.51 | 0.13 | <0.001 |
| 58328121 | 19:58327559-58328183 | ZNF415 | Zinc finger protein 415 | 0.21 | 0.37 | 0.09 | <0.001 |
| 59186995 | 19:59186361-59187120 | CACNG6 | Voltage-dependent calcium channel gamma 6 subunit isoform a | 0.26 | 0.65 | 0.36 | <0.001 |
| 59541550 | LILRA4 | Leukocyte immunoglobulin-like receptor; subfamily A member 4 | −0.21 | 0.60 | 0.75 | <0.01 | |
| 59776830 | LILRA2 | Leukocyte immunoglobulin-like receptor; subfamily A member 2 | −0.21 | 0.38 | 0.52 | <0.01 | |
| 59796968 | LILRA1 | Leukocyte immunoglobulin-like receptor; subfamily A member 1 | −0.20 | 0.40 | 0.51 | <0.05 | |
| 61571383 | 19:61570983-61571926 | ZNF542 | Zinc finger protein 542 | 0.51 | 0.60 | 0.14 | <0.001 |
| 61680914 | 19:61679899-61681705 | ZNF667 | Zinc finger protein 667 | 0.28 | 0.34 | 0.13 | <0.01 |
| 61710660 | 19:61710502-61711930 | ZNF471 | Zinc finger protein 471 | 0.23 | 0.31 | 0.13 | <0.01 |
| 62730668 | 19:62730278-62731195 | ZNF549 | Zinc finger protein 549 | 0.24 | 0.37 | 0.04 | <0.001 |
| 62817765 | 19:62817155-62817951 | ZNF134 | Zinc finger protein 134 | 0.27 | 0.45 | 0.17 | <0.001 |
| 62912306 | 19:62911404-62912681 | ZNF154 | Zinc finger protein 154 (pHZ-92) | 0.46 | 0.74 | 0.21 | <0.001 |
| 62912474 | 19:62911404-62912681 | ZNF154 | Zinc finger protein 154 (pHZ-92) | 0.37 | 0.66 | 0.21 | <0.001 |
| 62930740 | 19:62930217-62931307 | ZNF671 | Zinc finger protein 671 | 0.43 | 0.66 | 0.16 | <0.001 |
| 62930886 | 19:62930217-62931307 | ZNF671 | Zinc finger protein 671 | 0.31 | 0.63 | 0.20 | <0.001 |
| 63150791 | 19:63150421-63151659 | ZNF256 | Zinc finger protein 256 | 0.26 | 0.27 | 0.05 | <0.01 |
| 63206506 | 19:63205137-63206903 | ZNF606 | Zinc finger protein 606 | 0.29 | 0.50 | 0.25 | <0.001 |
| 63236961 | 19:63236212-63238223 | ZSCAN1 | Zinc finger and SCAN domain containing 1 | 0.34 | 0.49 | 0.11 | <0.001 |
| 63262280 | 19:63262091-63264376 | ZNF135 | Zinc finger protein 135 (clone pHZ-17) | 0.34 | 0.69 | 0.35 | <0.001 |
| 63301285 | 19:63301096-63301898 | ZNF447 | Zinc finger protein 447 | 0.38 | 0.55 | 0.10 | <0.001 |
| 63301618 | 19:63301096-63301898 | ZNF447 | Zinc finger protein 447 | 0.31 | 0.49 | 0.11 | <0.001 |
| 63643246 | 19:63642983-63644185 | ZNF132 | Zinc finger protein 132 (clone pHZ-12) | 0.23 | 0.24 | 0.11 | <0.01 |
| 63643484 | 19:63642983-63644185 | ZNF132 | Zinc finger protein 132 (clone pHZ-12) | 0.43 | 0.41 | 0.05 | <0.001 |
CpG loci are sorted according to position on the chromosome. The difference in β seen in patient set 1, as well as the average β values for OPSCC primary tumors and adjacent mucosa for patient set 2, are reported for each loci.
Pairwise t-test comparing β values for primary OPSCC tumor with adjacent mucosa in patient set 2.
Of the 28 CpG loci identified as hypomethylated on chromosome 19, only 8 of these (29%) resided within the boundaries of defined CpG island sequences. However, these genes may indicate targets whose mechanism of transcriptional activation in OPSCC includes DNA hypomethylation. These included the VAV1 oncogene, the endothelial differentiation receptor (EDG6), the bone marrow stromal cell antigen 2 (BST2), the transcription factor POU2F2 (OCT2), and the guanine nucleotide binding protein (GNA15). Interestingly, the CpG loci corresponding to EDG6 and BST2 were among the most hypomethylated CpGs measured across the entire genome-wide survey, ranking 1st and 11th of 27,578, respectively, based on the average difference in β between primary tumors and adjacent mucosa. Several CpG loci outside of CpG islands, but upstream of known genes, also were identified in our analysis. These included two kallikrein genes (KLK2 and KLK15), two sialic acid–binding Ig-like lectin-like protein genes (SIGLEC11 and SIGLEC12), and three leukocyte Ig-like receptor genes (LILRA1, LILRA2, and LILRA4). Their role in OPSCC is unknown.
Independent Validation of CpG Loci Differential Methylation
We validated the differential methylation of the identified CpG loci, both on a genome-wide scale and locally on chromosome 19. First, we collected genomic DNA from OPSCC primary tumor and normal mucosa for 21 independent patients undergoing treatment for OPSCC at Montefiore Medical Center in the Bronx (Table 1, patient set 2). When global DNA methylation data were analyzed for this second group of OPSCC patients, both in terms of overall numbers of differentially methylated CpG loci on each chromosome and the percentages of differentially methylated CpG loci for each chromosome, we observed a high level of agreement with the previous patient data set (data not shown). We used this validation dataset to empirically determine whether or not the use of a difference in β cut-off of 0.2 could be confirmed independently using a separate statistical analysis with an independent group of OPSCC patients. To do this, we performed in the second group of OPSCC patients a pairwise comparison of β values between genomic DNA isolated from primary OPSCC tumor and normal mucosal tissue samples using a paired t-test. When examined on a genome-wide scale, we observed that of the 958 differentially methylated CpG loci identified in patient set 1, 928 (97%) showed a statistically significant difference in β values in patient dataset 2 OPSCC tumors compared with their corresponding normal mucosa (Table 3, Student's paired t-test, P < 0.05). For each individual chromosome, at least 93% of the differentially methylated CpG loci identified in patient set 1 showed a significant difference in β values between primary OPSCC tumors and their corresponding normal mucosa in patient set 2. For 8 of the 24 chromosomal datasets, 100% of the differentially methylated CpG loci identified from patient set 1 were verified independently in patient set 2. For chromosome 19, 48 of the 50 hypermethylated CpG loci (96%) identified from patient set 1 also showed significantly higher β values in patient dataset 2 OPSCC tumors compared with their corresponding normal mucosa (Table 3, patient set 2, Student's paired t-test). Of the 28 hypomethylated CpG loci on chromosome 19 that were identified in patient set 1, 27 (96%) showed a significant decrease in β values in patient dataset 2 OPSCC tumors compared with their corresponding normal mucosa (Table 3, patient set 2, Student's paired t-test). Overall, our results confirm that a calculation of the difference in β values between primary OPSCC tumors and their corresponding normal adjacent mucosa successfully could identify hypermethylated and hypomethylated CpG loci in OPSCC that then could be validated in an independent OPSCC patient population.
Table 3.
Genome-Wide Validation of Differentially Methylated CpG Loci in OPSCC
| Chromosome | Total no. CpGs |
Differentially methylated CpGs in patient set 1 |
Subset of CpGs also showing significant differential methylation in patient set 2 |
|---|---|---|---|
| (% total) | (difference in β < 0.2) | (P < 0.05) (% of patient set 1)⁎ | |
| 1 | 2904 (10.5) | 77 | 75 (97) |
| 2 | 1712 (6.2) | 60 | 56 (93) |
| 3 | 1523 (5.5) | 48 | 48 (100) |
| 4 | 1028 (3.7) | 35 | 34 (97) |
| 5 | 1159 (4.2) | 58 | 54 (93) |
| 6 | 1490 (5.4) | 45 | 44 (98) |
| 7 | 1260 (4.6) | 62 | 61 (98) |
| 8 | 942 (3.4) | 51 | 49 (96) |
| 9 | 1076 (3.9) | 31 | 31 (100) |
| 10 | 1045 (3.8) | 42 | 39 (93) |
| 11 | 1735 (6.3) | 65 | 63 (97) |
| 12 | 1529 (5.5) | 36 | 36 (100) |
| 13 | 493 (1.8) | 18 | 18 (100) |
| 14 | 833 (3.0) | 31 | 31 (100) |
| 15 | 829 (3.0) | 20 | 19 (95) |
| 16 | 1198 (4.3) | 31 | 31 (100) |
| 17 | 1586 (5.8) | 40 | 38 (95) |
| 18 | 395 (1.4) | 30 | 30 (100) |
| 19 | 1905 (6.9) | 78 | 75 (96) |
| 20 | 884 (3.2) | 32 | 31 (97) |
| 21 | 315 (1.1) | 13 | 13 (100) |
| 22 | 645 (2.3) | 17 | 16 (94) |
| X | 1085 (3.9) | 38 | 36 (95) |
| Y | 7 (0.03) | 0 | NA |
| Total | 27,578 | 958 | 928 (96.9) |
All CpG loci on the beadchip are distributed by chromosomal location.
Pairwise t-test comparing β values for primary OPSCC tumor with adjacent mucosa in patient set 2.
Within the chromosomal region of 19q13, we also validated differential methylation at the individual CpG level using bisulfite sequencing. To do this, we selected two genes (ZNF447 and ZNF132) that were associated with differentially methylated CpG loci located within the 6.5-Mb chromosomal region described earlier. Bisulfite sequencing measured the methylation status of CpG loci spanning the transcription start site of each gene, and included the CpG loci measured on the initial beadchip dataset. For both genes, we observed a significant increase in the level of DNA hypermethylation in primary OPSCC tumor DNA compared with adjacent mucosal samples from the same patient when viewing multiple CpG loci across each CpG island (Figure 2). This hypermethylation spanned the transcription start site for each gene. Overall, these results confirm the differences in methylation observed from our initial beadchip data. Furthermore, these data confirm that the changes in methylation observed in just a couple of CpG loci on the beadchip are in fact representative of a larger change in multiple CpG loci spanning the CpG islands of these genes.
Figure 2.
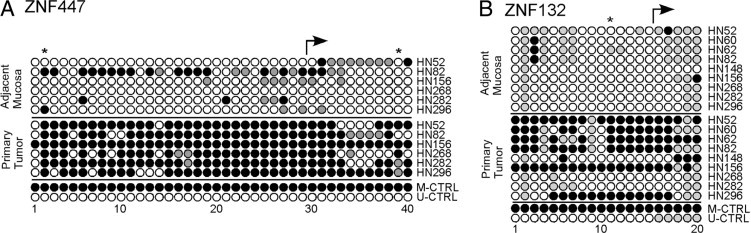
Measurements of DNA methylation for ZNF447 (A) and ZNF132 (B) in oropharyngeal primary tumor DNA and adjacent mucosal tissue DNA using bisulfite sequencing. For each gene, CpG loci were surveyed in the vicinity of the transcription start site. Individual methylated CpG loci are indicated by closed circles; unmethylated CpG loci are indicated by open circles. Partially methylated CpG loci are indicated by gray circles. Positions of CpG loci included on the Illumina HumanMethylation27 beadchip are indicated by an asterisk. The location of the transcription start site for each gene is indicated by an arrow. Patient identifiers are indicated on the right.
Hypermethylation of CpG Loci Corresponded to Decreased Expression of Corresponding Genes
Aberrant DNA methylation is an event frequently associated with the transcriptional silencing of genes. We therefore wanted to examine the consequence of these newly identified hypermethylation events on corresponding gene expression. We measured expression of ZNF447 and ZNF132 in a subset of oropharyngeal cancer patients using quantitative TaqMan real-time PCR. For both genes, we observed a significant decrease in expression in primary oropharyngeal tumors compared with adjacent mucosa from the same patient (Figure 3). Taken together, these results show that hypermethylation of CpG loci in the CpG islands of ZNF447 and ZNF132 is accompanied by a corresponding decrease in expression of the gene in OPSCC primary tumors. Overall, the findings identify a new class of epigenetically silenced genes that may play an important role in the development and progression of oropharyngeal cancer.
Figure 3.
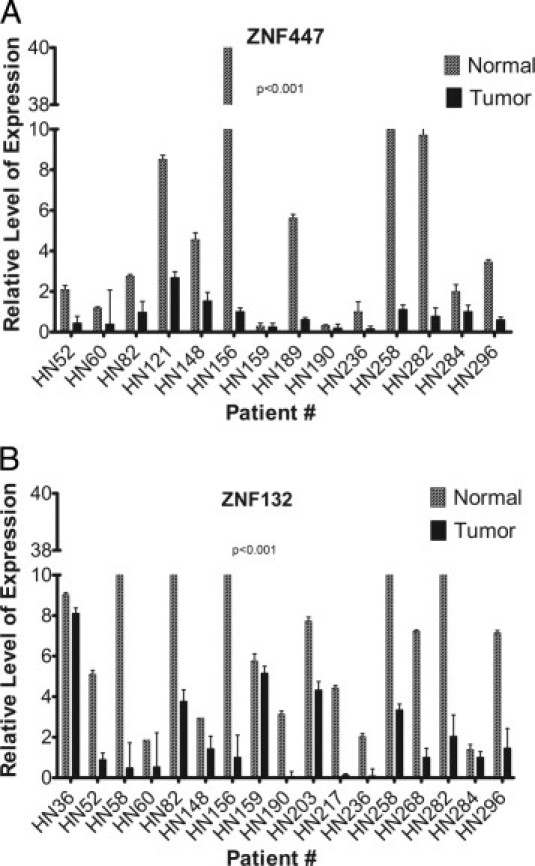
Relative expression of ZNF447 (A) and ZNF132 (B) in oropharyngeal primary tumor samples and adjacent mucosal samples measured using TaqMan quantitative real-time PCR. Expression data were normalized to glyceraldehyde-3-phosphate dehydrogenase. P values were calculated using a Wilcoxon t-test to look for a statistical difference in expression between paired primary tumor and adjacent mucosal tissue. Patient identifiers are shown at the bottom of each graph. One sample pair (HN62) did not have sufficient RNA for expression analysis. Additional OPSCC sample pairs were included in this expression analysis for which DNA was not available for methylation analysis. Error bars indicate the SE of three independent measurements of gene expression for each RNA sample.
Discussion
As with other cancers, epigenetic factors have emerged as a significant mechanism of transcriptional silencing of critical genes in HNSCC.17 In fact, it is now known that such DNA methylation events represent an important tumor-specific marker occurring early in tumor progression. The identification of genes specifically silenced by DNA methylation represents a powerful approach for the comprehensive identification of new tumor suppressor genes in HNSCC. To date, promoter hypermethylation has been associated with the transcriptional silencing of more than 90 genes in human neoplasias.18 However, recent studies suggest that gene silencing by promoter hypermethylation is more common in human cancer than originally thought and may have a causal relationship with tumor development and progression.19
From our genome-wide view of differential methylation events in oropharyngeal cancer patients, most of the 958 CpG loci showing alteration in DNA methylation (>96%) were validated in an independent population of oropharyngeal cancer patients. Furthermore, the differentially methylated CpG loci represented approximately 2% to 4% of the total CpG loci measured for any given chromosome with six chromosomes having >4% methylation: 18 (7.6%), 8 (5.4%), 5 (5.0%), 7 (4.9%), 21 (4.1%), and 19 (4.1%). We were also aware of the fact that some alterations in global methylation have been associated with HPV status in head and neck cancer cases.20,21 However, in our dataset of 958 differentially methylated CpG loci, only a very small subset (2.5%) had a differential methylation status that correlated significantly with the HPV status of the patient (Student's t-test, P < 0.01). Only one of these (cg07054095 associated with ZNF549) was located within the 6.5-Mb region of 19q13 mentioned earlier.
Of the 78 CpG loci identified on chromosome 19, 50 were identified as hypermethylated in OPSCC tumors compared with corresponding normal adjacent mucosa. All of these resided within the boundaries of CpG islands. Within that list of 50 CpG loci and associated genes, neither of the two subunits of calcium channels (CACNA1A and CACNG6) previously had been identified in OPSCC, although CACNA1A was one of three genes, along with p16INK4A and p19ARF, identified by restriction landmark genomic scanning as hypermethylated in poorly differentiated prostate tumors of the transgenic adenocarcinoma of mouse prostate (TRAMP) model.22 Perhaps most intriguing is the fact that the vast majority of the hypermethylated CpG loci identified on chromosome 19 were associated with genes belonging to the Krüppel-type zinc finger protein family. There are estimated to be more than 600 Krüppel-type genes in the human genome, and many appear to exist in clustered families.23 In situ hybridization experiments have indicated that a large number of these genes are located on chromosome 19.24 Furthermore, clusters of ZNF genes appear to be concentrated in six major clusters along the length of chromosome 19.25 Members of this family are known to be involved in diverse cellular processes including cellular differentiation, proliferation, apoptosis, and neoplastic transformation.16,26 Of the genes we studied, only ZNF447 (also known as ZSCAN18) has been shown to be silenced by methylation in some esophageal SCC cell lines.27
Several of the other Krüppel-type genes identified here have been implicated in other cancers. For example, ZNF177 recently was identified as a methylation-silenced gene in gastric cancer using a gene expression microarray approach in combination with the demethylating agent 5-aza-2′-deoxycytidine.28 Similarly, analysis of pancreatic adenocarcinoma and normal pancreas using a promoter microarray platform in combination with methylation-specific PCR and bisulfite sequencing successfully identified the ZNF415 gene promoter as aberrantly hypermethylated in this disease.29 Both ZNF540 and ZNF569 have been shown to act as transcriptional repressors of the mitogen-activated protein kinase signaling pathway to mediate cellular functions.30,31 Finally, Krüppel-family gene ZNF382, which is silenced by methylation in multiple carcinomas, recently was shown to be a proapoptotic tumor suppressor gene capable of repressing multiple oncogenes.32
Within the group of hypomethylated genes identified within chromosome 19, up-regulation of bone marrow stromal cell antigen 2/CD317 recently was reported in head and neck squamous cell carcinoma in an analysis of larynx-derived serial analysis of gene expression libraries.33 Furthermore, expression of bone marrow stromal cell antigen 2/CD317 was shown by real-time RT-PCR, Western blot, and TMA to be increased significantly in the bone metastatic breast cancer cell lines and tumor tissues compared with non–bone metastatic breast cancer cell lines and tumor tissues.34 For the CD79A/MB-1 gene, examination of lymphoid cell lines and nonlymphoid tissues has shown a lineage-specific correlation between demethylation in the 5′ region and expression of this gene.35 Similarly, the identification of the Vav1 oncogene on chromosome 19 in OPSCC supports a study highlighting promoter demethylation of this gene as an important event in prostate cancer progression.36 In fact, high levels of Vav1 expression have been shown to have prognostic value in human breast cancer cases.37 Finally, KLK2 and KLK15 expression levels have been shown to be increased in prostate and ovarian cancers, respectively.38,39 In the case of ovarian cancer, KLK15 overexpression was also a significant predictor of reduced progression-free survival.39
These methylation events on chromosome 19 represented some of the largest methylation changes we observed in our genome-wide survey. For the genes that we tested, these changes corresponded with a significant decrease in gene expression in tumors, suggesting an epigenetic mechanism of gene silencing. Furthermore, these observations are consistent with what is known in other neoplastic diseases for ZNF177 and ZNF447/ZSCAN18.27,28 However, many questions remain unanswered. First, the downstream targets of many of these genes are not known. We are now examining the consequences of re-expression of ZNF447 and ZNF132 in oropharyngeal SCC cell lines, and using a genome-wide high-throughput expression platform to identify potential targets. Second, we do not know whether the aberrant hypermethylation observed on chromosome 19q13 is specific to the oropharynx, or is also seen in other head and neck cancers. However, our initial profiling of methylation in oral cavity primary tumors and adjacent mucosa from 18 oral cavity SCC patients revealed that 12 of the 14 chromosome 19–specific CpG loci mentioned earlier as being associated with Krüppel family zinc finger protein genes also showed a statistically significant increase in methylation levels in these primary tumors (data not shown). This suggests that these methylation events occur in primary head and neck tumors across multiple anatomic sites. Finally, although we have designed this analysis to focus on the differences in DNA methylation events between primary tumors and corresponding normal mucosa, we also plan to use the primary tumor data described here to identify methylation events predictive of clinical parameters in this disease.
In conclusion, the work described in this report has uncovered hundreds of new targets of aberrant methylation and possible epigenetic regulation in oropharyngeal cancer. Overall, the aberrant methylation of these genes, including the many Krüppel-type genes mentioned in this report, represents a new avenue of exploration for pathways affected in oropharyngeal cancer.
Acknowledgment
We thank the Pathology Core at Montefiore Medical Center for their assistance with preparation and scanning of Illumina beadchips.
Footnotes
This work was supported by grant R21CA131648 (T.J.B.) from the National Cancer Institute.
Supplemental material for this article can be found at http://ajp.amjpathol.org or at doi: 10.1016/j.ajpath.2011.01.049.
A guest editor acted as editor-in-chief for the manuscript. No person at Thomas Jefferson University or Albert Einstein College of Medicine was involved in the peer-review process or final disposition of this article.
Supplementary data
References
- 1.Ferlay J., Bray F., Pissani P., Parkin D.M. IRAC Press; Lyon: 2011. GLOBOCAN 2000: cancer incidence, mortality and prevalence worldwide, version 1.0. IARC CancerBase 2001, No. 5. [Google Scholar]
- 2.Jemal A., Siegel R., Ward E., Murray T., Xu J., Thun M.J. Cancer statistics, 2007. CA Cancer J Clin. 2007;57:43–66. doi: 10.3322/canjclin.57.1.43. [DOI] [PubMed] [Google Scholar]
- 3.Takes R.P., Baatenburg de Jong R.J., Schuuring E., Hermans J., Vis A.A., Litvinov S.V., van Krieken J.H. Markers for assessment of nodal metastasis in laryngeal carcinoma. Arch Otolaryngol Head Neck Surg. 1997;123:412–419. doi: 10.1001/archotol.1997.01900040048008. [DOI] [PubMed] [Google Scholar]
- 4.Gollin S.M. Chromosomal alterations in squamous cell carcinomas of the head and neck: window to the biology of disease. Head Neck. 2001;23:238–253. doi: 10.1002/1097-0347(200103)23:3<238::aid-hed1025>3.0.co;2-h. [DOI] [PubMed] [Google Scholar]
- 5.Wreesmann V.B., Singh B. Chromosomal aberrations in squamous cell carcinomas of the upper aerodigestive tract: biologic insights and clinical opportunities. J Oral Pathol Med. 2005;34:449–459. doi: 10.1111/j.1600-0714.2005.00343.x. [DOI] [PubMed] [Google Scholar]
- 6.Jones P.A., Baylin S.B. The fundamental role of epigenetic events in cancer. Nat Rev Genet. 2002;3:415–428. doi: 10.1038/nrg816. [DOI] [PubMed] [Google Scholar]
- 7.Rosas S.L.B., Koch W., da Gloria da Costa Carvalho M., Wu L., Califano J., Westra W., Jen J., Sidransky D. Promoter hypermethylation patterns of p16: O6-methylguanine-DNA-methyltransferase, and death-associated protein kinase in tumors and saliva of head and neck cancer patients. Cancer Res. 2001;61:939–942. [PubMed] [Google Scholar]
- 8.Maruya S., Issa J.P., Weber R.S., Rosenthal D.I., Haviland J.C., Lotan R., El-Naggar A.K. Differential methylation status of tumor-associated genes in head and neck squamous carcinoma: incidence and potential implications. Clin Cancer Res. 2004;10:3825–3830. doi: 10.1158/1078-0432.CCR-03-0370. [DOI] [PubMed] [Google Scholar]
- 9.Zuo C., Ai L., Ratliff P., Suen J.Y., Hanna E., Brent T.P., Fan C.Y. O6-methylguanine-DNA methyltransferase gene: epigenetic silencing and prognostic value in head and neck squamous cell carcinoma. Cancer Epidemiol Biomarkers Prev. 2004;13:967–975. [PubMed] [Google Scholar]
- 10.Ogi K., Toyota M., Ohe-Toyota M., Tanaka N., Noguchi M., Sonoda T., Kohama G., Tokino T. Aberrant methylation of multiple genes and clinicopathological features in oral squamous cell carcinoma. Clin Cancer Res. 2002;8:3164–3171. [PubMed] [Google Scholar]
- 11.Kudo Y., Kitajima S., Ogawa I., Hiraoka M., Sargolzaei S., Keikhaee M.R., Sato S., Miyauchi M., Takata T. Invasion and metastasis of oral cancer cells require methylation of E-cadherin and/or degradation of membranous beta-catenin. Clin Cancer Res. 2004;10:5455–5463. doi: 10.1158/1078-0432.CCR-04-0372. [DOI] [PubMed] [Google Scholar]
- 12.Calmon M.F., Colombo J., Carvalho F., Souza F.P., Filho J.F., Fukuyama E.E., Camargo A.A., Caballero O.L., Tajara E.H., Cordeiro J.A., Rahal P. Methylation profile of genes CDKN2A (p14 and p16): DAPK1, CDH1, and ADAM23 in head and neck cancer. Cancer Genet Cytogenet. 2007;173:31–37. doi: 10.1016/j.cancergencyto.2006.09.008. [DOI] [PubMed] [Google Scholar]
- 13.Illumina, Inc. 2008. Infinium Assay Methylation Protocol Guide. Catalog # WG-901-2701. Part # 11322371 Rev. A. [Google Scholar]
- 14.Takai D., Jones P.A. Comprehensive analysis of CpG islands in human chromosomes 21 and 22. Proc Natl Acad Sci U S A. 2002;99:3740–3745. doi: 10.1073/pnas.052410099. [DOI] [PMC free article] [PubMed] [Google Scholar]
- 15.2008. Illumina Epigenetics TechNote: DNA Methylation Analysis. Pub. No. 270-2008-001. [Google Scholar]
- 16.Bellefroid E.J., Lecocq P.J., Benhida A., Poncelet D.A., Belayew A., Martial J.A. The human genome contains hundreds of genes coding for finger proteins of the Krüppel type. DNA. 1989;8:377–387. doi: 10.1089/dna.1.1989.8.377. [DOI] [PubMed] [Google Scholar]
- 17.Ha P.K., Califano J.A. Promoter methylation and inactivation of tumour-suppressor genes in oral squamous-cell carcinoma. Lancet Oncol. 2006;7:77–82. doi: 10.1016/S1470-2045(05)70540-4. [DOI] [PubMed] [Google Scholar]
- 18.Costello J.F., Plass C. Methylation matters. J Med Genet. 2001;38:285–303. doi: 10.1136/jmg.38.5.285. [DOI] [PMC free article] [PubMed] [Google Scholar]
- 19.Baylin S.B. DNA methylation and gene silencing in cancer. Nat Clin Pract Oncol. 2005;2(Suppl 1):S4–S11. doi: 10.1038/ncponc0354. [DOI] [PubMed] [Google Scholar]
- 20.Richards K.L., Zhang B., Baggerly K.A., Colella S., Lang J.C., Schuller D.E., Krahe R. Genome-wide hypomethylation in head and neck cancer is more pronounced in HPV-negative tumors and is associated with genomic instability. PLoS One. 2009;4:e4941. doi: 10.1371/journal.pone.0004941. [DOI] [PMC free article] [PubMed] [Google Scholar]
- 21.Bennett K.L., Lee W., Lamarre E., Zhang X., Seth R., Scharpf J., Hunt J., Eng C. HPV status-independent association of alcohol and tobacco exposure or prior radiation therapy with promoter methylation of FUSSEL18: EBF3, IRX1, and SEPT9, but not SLC5A8, in head and neck squamous cell carcinomas. Genes Chromosomes Cancer. 2010;49:319–326. doi: 10.1002/gcc.20742. [DOI] [PubMed] [Google Scholar]
- 22.Morey Kinney S.R., Smiraglia D.J., James S.R., Moser M.T., Foster B.A., Karpf A.R. Stage-specific alterations of DNA methyltransferase expression, DNA hypermethylation, and DNA hypomethylation during prostate cancer progression in the transgenic adenocarcinoma of mouse prostate model. Mol Cancer Res. 2008;6:1365–1374. doi: 10.1158/1541-7786.MCR-08-0040. [DOI] [PMC free article] [PubMed] [Google Scholar]
- 23.Shannon M., Ashworth L.K., Mucenski M.L., Lamerdin J.E., Branscomb E., Stubbs L. Comparative analysis of a conserved zinc finger gene cluster on human chromosome 19q and mouse chromosome 7. Genomics. 1996;33:112–120. doi: 10.1006/geno.1996.0166. [DOI] [PubMed] [Google Scholar]
- 24.Rousseau-Merck M.F., Koczan D., Legrand I., Möller S., Autran S., Thiesen H.J. The KOX zinc finger genes: genome wide mapping of 368 ZNF PAC clones with zinc finger gene clusters predominantly in 23 chromosomal loci are confirmed by human sequences annotated in EnsEMBL. Cytogenet Genome Res. 2002;98:147–153. doi: 10.1159/000069802. [DOI] [PubMed] [Google Scholar]
- 25.Hoffman SMG, Amemiya C, Mohrenweiser HW: Distribution and Organization of Zinc Finger Genes on Chromosome 19. Report of the D.O.E. Human Genome Program Contractor-Grantee Workshop IV, NM. November 13–17, 1994, p. 49
- 26.Urrutia R. KRAB-containing zinc-finger repressor proteins. Genome Biol. 2003;4:231. doi: 10.1186/gb-2003-4-10-231. [DOI] [PMC free article] [PubMed] [Google Scholar]
- 27.Oka D., Yamashita S., Tomioka T., Nakanishi Y., Kato H., Kaminishi M., Ushijima T. The presence of aberrant DNA methylation in noncancerous esophageal mucosae in association with smoking history: a target for risk diagnosis and prevention of esophageal cancers. Cancer. 2009;115:3412–3426. doi: 10.1002/cncr.24394. [DOI] [PubMed] [Google Scholar]
- 28.Yamashita S., Tsujino Y., Moriguchi K., Tatematsu M., Ushijima T. Chemical genomic screening for methylation-silenced genes in gastric cancer cell lines using 5-aza-2′-deoxycytidine treatment and oligonucleotide microarray. Cancer Sci. 2006;97:64–71. doi: 10.1111/j.1349-7006.2006.00136.x. [DOI] [PMC free article] [PubMed] [Google Scholar]
- 29.Omura N., Li C.P., Li A., Hong S.M., Walter K., Jimeno A., Hidalgo M., Goggins M. Genome-wide profiling of methylated promoters in pancreatic adenocarcinoma. Cancer Biol Ther. 2008;7:1146–1156. doi: 10.4161/cbt.7.7.6208. [DOI] [PMC free article] [PubMed] [Google Scholar]
- 30.Xiang Z., Yuan W., Luo N., Wang Y., Tan K., Deng Y., Zhou X., Zhu C., Li Y., Liu M., Wu X., Li Y. A novel human zinc finger protein ZNF540 interacts with MVP and inhibits transcriptional activities of the ERK signal pathway. Biochem Biophys Res Commun. 2006;347:288–296. doi: 10.1016/j.bbrc.2006.06.076. [DOI] [PubMed] [Google Scholar]
- 31.Huang X., Yuan W., Huang W., Bai Y., Deng Y., Zhu C., Liang P., Li Y., Du X., Liu M., Wang Y., Wu X. ZNF569, a novel KRAB-containing zinc finger protein, suppresses MAPK signaling pathway. Biochem Biophys Res Commun. 2006;346:621–628. doi: 10.1016/j.bbrc.2006.05.109. [DOI] [PubMed] [Google Scholar]
- 32.Cheng Y., Geng H., Cheng S.H., Liang P., Bai Y., Li J., Srivastava G., Ng M.H., Fukagawa T., Wu X., Chan A.T., Tao Q. KRAB zinc finger protein ZNF382 is a proapoptotic tumor suppressor that represses multiple oncogenes and is commonly silenced in multiple carcinomas. Cancer Res. 2010;70:6516–6526. doi: 10.1158/0008-5472.CAN-09-4566. [DOI] [PubMed] [Google Scholar]
- 33.Silveira N.J., Varuzza L., Machado-Lima A., Lauretto M.S., Pinheiro D.G., Rodrigues R.V., Severino P., Nobrega F.G., Silva W.A., Jr, de B Pereira C.A., Tajara E.H. Searching for molecular markers in head and neck squamous cell carcinomas (HNSCC) by statistical and bioinformatic analysis of larynx-derived SAGE libraries. BMC Med Genomics. 2008;1:56. doi: 10.1186/1755-8794-1-56. [DOI] [PMC free article] [PubMed] [Google Scholar]
- 34.Cai D., Cao J., Li Z., Zheng X., Yao Y., Li W., Yuan Z. Up-regulation of bone marrow stromal protein 2 (BST2) in breast cancer with bone metastasis. BMC Cancer. 2009;9:102. doi: 10.1186/1471-2407-9-102. [DOI] [PMC free article] [PubMed] [Google Scholar]
- 35.Ha H., Barnoski B.L., Sun L., Emanuel B.S., Burrows P.D. Structure, chromosomal localization, and methylation pattern of the human mb-1 gene. J Immunol. 1994;152:5749–5757. [PubMed] [Google Scholar]
- 36.Denicola G., Tuveson D.A. VAV1: a new target in pancreatic cancer? Cancer Biol Ther. 2005;4:509–511. doi: 10.4161/cbt.4.5.1781. [DOI] [PubMed] [Google Scholar]
- 37.Lane J., Martin T.A., Mansel R.E., Jiang W.G. The expression and prognostic value of the guanine nucleotide exchange factors (GEFs) Trio, Vav1 and TIAM-1 in human breast cancer. Int Semin Surg Oncol. 2008;5:23. doi: 10.1186/1477-7800-5-23. [DOI] [PMC free article] [PubMed] [Google Scholar]
- 38.Nam R.K., Zhang W.W., Trachtenberg J., Diamandis E., Toi A., Emami M., Ho M., Sweet J., Evans A., Jewett M.A., Narod S.A. Single nucleotide polymorphism of the human kallikrein-2 gene highly correlates with serum human kallikrein-2 levels and in combination enhances prostate cancer detection. J Clin Oncol. 2003;21:2312–2319. doi: 10.1200/JCO.2003.11.007. [DOI] [PubMed] [Google Scholar]
- 39.Yousef G.M., Scorilas A., Katsaros D., Fracchioli S., Iskander L., Borgono C., Rigault de la Longrais I.A., Puopolo M., Massobrio M., Diamandis E.P. Prognostic value of the human kallikrein gene 15 expression in ovarian cancer. J Clin Oncol. 2003;21:3119–3126. doi: 10.1200/JCO.2003.09.111. [DOI] [PubMed] [Google Scholar]
Associated Data
This section collects any data citations, data availability statements, or supplementary materials included in this article.