

Abstract
Based on the analysis of exudates from injured adipose tissue, we prepared a mixture containing the injury-associated growth factors at the same proportion as the exudates, named adipose injury cocktail (AIC). We hypothesized that AIC induces a series of regenerating and angiogenic processes without actual wounding. The purpose of this study is to elucidate the therapeutic potentials of AIC. AIC preferentially activated adipose-derived stem/progenitor/stromal cells (ASCs) to proliferate, migrate, and form networks compared with vascular endothelial cells, whereas vascular endothelial growth factor did not induce mitogenesis or chemotaxis in human ASCs. Each component growth factor of AIC was differently responsible for the ASC activation. AIC-treated ASCs tended to differentiate into adipocytes or vessel-constituting cells rather than into other cell types. In ischemic adipose tissues of mice, induced by either a surgical intervention or diabetes, AIC administration enhanced proliferation, especially of CD31–/CD34+ ASCs, and mitigated tissue hypoxia by increasing capillary density and reducing fibrogenesis. These results suggest that AIC may have therapeutic potentials for various ischemic/hypoxic conditions by inducing adipose remodeling and neovascularization through activation of ASCs and other cells. Treatment with AIC has many advantages over cell-based therapies regarding morbidity, cost, and physical risks and may be used as an alternative therapy for improving tissue oxygen.
Adipose tissue turns over very slowly and contains a diversity of cell types, including adipocytes, stromal cells, vascular endothelial cells (ECs), pericytes, and resident blood-derived cells.1,2 Vascular stromal cells isolated from adipose tissue have been shown to contain multipotent cells called adipose-derived stem/progenitor/stromal cells (ASCs).3 The adipose progenitors were recently identified in perivascular locations, and this generated a hypothesis about their identity with pericytes.4–7 ASCs contribute to adipose tissue turnover by providing new-generation cells, and they also play predominant roles during the remodeling process that compensate for apoptotic or degenerative changes.8,9 In diverse models of ischemic tissues, ASCs were shown to be potential therapeutic tools owing to their ability to promote angiogenesis by providing ECs and/or releasing angiogenic growth factors.9–15
In regenerative medicine, stem or progenitor cells need to be activated with a microenvironment optimized for each purpose. By supplying conditions and factors involved in inflammation or tissue remodeling/repair, we can provide microenvironments that evoke regenerative events, including cell proliferation, migration, and differentiation. Therefore, tissue pretreatments, eg, intentional wounding, have been occasionally used for preparing microenvironments to induce tissue remodeling. For example, skin resurfacing procedures, such as laser or chemical peeling, are destructive but induce skin renewal and resolve various cutaneous problems. As another example, ectopic osteogenesis in skeletal muscle could be experimentally induced by overexpression of bone morphogenetic protein only when muscle ischemia and regeneration were induced by free grafting.16 Thus, tissue wounding is considered to be a potent method for preparing microenvironments to be suitable for tissue engineering and regenerative therapies. In this study, instead of tissue wounding, we used injury-associated soluble factors to mimic such regenerative microenvironments.
The repair/remodeling process of injured adipose tissue is controlled by spatiotemporal actions of multiple growth factors secreted from the extracellular matrix and various types of cells, including dying cells. We previously showed that after surgical injury to human adipose tissue, different growth or inflammatory factors were secreted from the injured tissue in each wound-healing phase (coagulation, inflammation, and proliferation).17 In the coagulation stage (within 1 day after wounding), basic fibroblast growth factor (bFGF), epidermal growth factor (EGF), platelet-derived growth factor (PDGF), and transforming growth factor-β (TGF-β) were released, but all of them were detected in decreasing amounts in the following stages.
In this study, we hypothesized that the soluble factors released in the initial phase triggered a series of subsequent inflammatory and regenerating responses and that administration of the factors in vivo or in vitro would reproduce at least part of the microenvironment associated with adipose injury without actual wounding. We prepared a mixture of the factors, termed adipose injury cocktail (AIC), which comprised the four major early-stage factors (bFGF, EGF, PDGF, and TGF-β) combined in the proportions found in early wound exudates. We also hypothesized that AIC may improve tissue oxygen tension by activating quiescent ASCs and/or ECs, initiating a series of adipose-repairing events and regenerating adipose and vasculature. To examine the therapeutic potential of AIC, we further performed in vivo experiments to evaluate the effects of AIC on acutely induced ischemic adipose tissue, chronically ischemic adipose tissue with diabetes, and unperturbed adipose tissue.
Materials and Methods
Human Cell Isolation and Culture
Human liposuction aspirates were obtained from 12 healthy female donors [mean ± SD age, 39.3 ± 3.4 years; mean ± SD body mass index (calculated as weight in kilograms divided by height in meters squared), 22.6 ± 0.7] undergoing elective liposuction of the abdomen or thighs. Each patient provided informed consent. The protocol was approved by the ethical committee of University of Tokyo School of Medicine before the procedure. Human ASCs (hASCs) were isolated from the aspirated fat as described previously.18 Briefly, the aspirated fat tissue was washed with PBS and was digested at 37°C in PBS containing 0.075% collagenase for 30 minutes on a shaker. Mature adipocytes and connective tissue were separated from pellets by centrifugation (800 × g for 10 minutes). The cell pellets were resuspended, filtered through 100-μm mesh, plated at a density of 5 × 10⁵ nucleated cells/100-mm dish, and cultured at 37°C in an atmosphere of 5% CO2 in humid air. The culture medium was Dulbecco's modified Eagle's medium (Nissui Pharmaceutical, Tokyo, Japan) containing 10% fetal bovine serum (FBS). Primary cells were cultured for 7 days and were defined as passage 0. The medium was replaced every 3 days. Cells were passaged every week by trypsinization. hASCs at passages 1 to 3 were used in the experiments.
Isolation and culture of human umbilical vein ECs (HUVECs) were performed according to the methods described previously.19 Samples were collected immediately after delivery. The umbilical cord was separated from the placenta by clipping both ends and was irrigated with 1% iodine/PBS solution. To eliminate iodine, the intracelial space was rinsed with M199 medium and filled with 0.25% trypsin in PBS. Both ends were again clipped, followed by incubation for 10 minutes at 37°C. Then, the intracelial space was rinsed with endothelial basal medium (EBM; Cambrex, Walkersville, MD), and cells were collected. The cells were centrifuged at 450 × g for 5 minutes, attached to 100-mm plastic dishes, and cultured with EBM containing 2% FBS. Primary cells were cultured for 7 days and were defined as passage 0. HUVECs at passages 3 to 5 were used in the experiments.
Proliferation Assay
In this study, the mixture of four injury-associated growth factors (PDGF, TGF-β, bFGF, and EGF) composed the AIC. The final concentration of AIC was 2.5 ng/mL PDGF, 1 ng/mL TGF-β, 10 ng/mL bFGF, and 2 ng/mL EGF (all from Wako Pure Chemicals, Osaka, Japan) mixed in an appropriate solution (EBM containing 0% or 2% FBS in vitro or PBS in vivo); the proportion of the four factors was determined in a previous study,17 and the concentrations were determined based on a preliminary experiment. hASCs or HUVECs were plated in a six-well plate at 2 × 10⁴ cells per well in EBM containing 2% FBS with AIC or without AIC (control). The cell numbers were counted after 3, 6, and 9 days in culture using a cell counter (NucleoCounter; ChemoMetec, Allerod, Denmark). 5-Bromo-2-deoxyuridine (BrdU) incorporation assays were performed using the APC BrdU Flow Kit (BD Biosciences, San Jose, CA). Cells were cultured for 48 hours in EBM containing 2% FBS with or without AIC, followed by BrdU labeling for 2 hours at a final concentration of 10 μmol/L. Flow cytometry was then performed using an LSR II flow cytometry system (BD Biosciences).
Migration Assay
hASCs and HUVECs were resuspended (2 × 10⁵ cells in 200 μL of serum-free EBM) and seeded into the upper chamber of a cell migration apparatus that had a floor perforated with 8-μm pores (Transwell; Corning Life Sciences, Lowell, MA). The lower chamber was filled with 600 μL of serum-free EBM with or without AIC or with 100 ng/mL vascular endothelial growth factor (VEGF). To evaluate the dose-dependent effects of AIC, a medium containing 10 times the concentration of AIC (10× AIC) and diluted AIC media (0.1×, 0.01×, and 0.001× AIC) were used. Furthermore, we tested different combinations of two or three of the four AIC factors (incomplete AIC). The cells were then allowed to migrate for 4 hours at 37°C. Then they were fixed in 100% methanol for 15 minutes and stained with 0.1% Giemsa solution for 10 minutes. Cells remaining on the bottom of the upper chamber were removed using a cotton swab. Cells that migrated through the pores were counted under a light microscope.
Induced Differentiation of Cultured Cells
After culturing in EBM containing 2% FBS with or without AIC for 3 days, hASCs were differentiated into adipogenic, chondrogenic, and osteogenic lineages. For adipogenic differentiation, cells were incubated for 21 days in adipogenic medium (Dulbecco's modified Eagle's medium containing 10% FBS, 0.5 mmol/L isobutyl-methylxanthine, 1 μmol/L dexamethasone, 10 μmol/L insulin, and 200 μmol/L indomethacin). Adipogenic differentiation was visualized with oil red O staining. For quantitative analysis of lipid droplets, Nile red fluorescence was measured by AdipoRed (Cambrex) excitation at 485 nm and emission at 535 nm using a fluorescent plate reader (DTX 880 Multimode Detector; Beckman Coulter, Fullerton, CA). For chondrogenic differentiation, cells were incubated for 21 days in Dulbecco's modified Eagle's medium containing 1% FBS supplemented with 6.25 mg/mL insulin, 10 ng/mL TGF-β1, and 50 nM of ascorbate-2-phosphate. Chondrogenic differentiation was visualized with Alcian blue staining. For quantitative analysis, a micromass culture system was used, as reported previously.20 Cells were plated in a 15-mL tube and were cultured in the chondrogenic medium for 21days. Then, the diameter of a micromass was measured. For osteogenic differentiation, cells were incubated for 21 days in Dulbecco's modified Eagle's medium containing 10% FBS supplemented with 0.1 mM of dexamethasone, 50 mm of ascorbate-2-phosphate, and 10 mM of β-glycerophosphate (Nacalai Tesque, Kyoto, Japan). Osteogenic differentiation was visualized with von Kossa staining. For quantitative analysis of total calcium, calcium deposition was evaluated based on the ortho-cresolphthalein complexone method using the Calcium C-Test Wako Kit (Wako Chemicals, Osaka, Japan) according to the manufacturer's instructions.
Quantitative Real-Time RT-PCR
Extraction of total RNA from homogenized mouse inguinal adipose tissue was performed using the RNeasy Mini Kit (QIAGEN Inc., Valencia, CA), followed by reverse transcription. We amplified cDNA in 40 cycles using a SYBR Green PCR Master Mix and an ABI 7700 sequence detection system (both from Applied Biosystems, Foster City, CA). Expression levels were calculated by the comparative CT method with ribosomal 18S RNA as an internal control. The primer sequences used in real-time PCR analysis were as follows: CD31: 5′-TTGAGCCTCACCAAGAGAACGGAA-3′, 5′-AATCCAGGAATCGGCTGCTCTTCT-3′; Flk-1: 5′-AGGCCCATTGAGTCCAACTACACA-3′, 5′-AGACCATGTGGCTCTGTTTCTCCA-3′; CD34: 5′-AGACTCAGGGAAAGGCCAATGTGA-3′, 5′-GCCACCACATGTTGTCTTGCTGAA-3′; and 18SrRNA: 5′-TCAACTTTCGATGGTAGTCGCCGT-3′, 5′-TCCTTGGATGTGGTAGCCGTTTCT-3′.
In Vitro Angiogenesis (Network Formation) Assay
Network formation was assessed for hASCs and HUVECs. Matrigel (BD Biosciences) was poured into 96-well plates (50 μL per well) and polymerized (30 minutes at 37°C). After incubation in EBM containing 2% FBS with or without AIC for 24 hours as a pretreatment, 5000 cells resuspended in 50 μL of EBM containing 2% FBS without AIC were plated on Matrigel and cultured for 6 hours. Branching formation was observed with phase microscopy, and the length of cytoplasmic extensions per field was calculated. Dose-dependent effects of AIC on network formation were also evaluated as described in the migration assay. To distinguish the two types of cells co-cultured on Matrigel, hASCs and HUVECs were stained with DiO and CM-DiI (Invitrogen-Molecular Probes, Carlsbad, CA), respectively, in advance (overnight at 37°C). For staining the networks formed on the Matrigel, cells were fixed with 4% paraformaldehyde, blocked with 10% normal goat serum with PBS containing 1% bovine serum albumin for 30 minutes at room temperature, and incubated with Alexa Fluor 488–conjugated isolectin or anti-von Willebrand factor (vWF) antibody overnight at 4°C. After 1 hour of incubation with a secondary antibody (only for immunostaining), Hoechst 33342 (Invitrogen) staining was performed, and the cells were observed using a confocal microscope system.
Mouse Nonischemic and Ischemic Models of Inguinal Adipose Tissue
All animal care was in accordance with institutional guidelines. Eight-week-old ICR mice or db/db mice were anesthetized with pentobarbital (50 mg/kg weight).
Intact (Nonischemic) Model
A 3-mm incision was made in the inguinal region, and the subcutaneous adipose pad was identified. After the measurement of tissue partial pressure of oxygen (pO2), AIC (0.2 mL of PBS containing 12.5 ng/mL PDGF, 5 ng/mL TGF-β, 50 ng/mL bFGF, and 10 ng/mL EGF; 5× AIC used in vitro) was injected into the fat pad via a 29-gauge needle-attached syringe (Myjector; Terumo, Tokyo, Japan). As a control, 0.2 mL of PBS was injected into the contralateral fat pad. At designated time points (before injection and at 1, 2, and 4 weeks; n = 10 mice per time point), tissue pO2 was measured, and the fat pad was harvested. The samples were evaluated using whole-mount staining and capillary density measurements.
Acute Ischemia Model
A linear 1-cm incision was made in the inguinal region, and the pO2 of the subcutaneous fat pad was measured. The nutrient vessels of the fat pad arising from the femoral artery and its branch to the adductor muscles were exposed and ligated. Small communicating vessels to the skin from the fat pad were left intact. Immediately after the ligation, pO2 was measured again, and then AIC or PBS was injected into the adipose tissue as described for experiment 1. At designated time points (before injection and at 1, 2, and 4 weeks; n = 10 mice per time point), tissue pO2 was measured and the fat pad was harvested. The samples were evaluated using whole-mount staining, measurements of capillary density and fibrosis area, and real-time PCR.
Chronic Ischemia Model in db/db Mice
The subcutaneous inguinal adipose tissue of db/db mouse was identified after a small incision, pO2 was measured, and AIC or PBS was injected as described for experiment 1. At designated time points (before injection and at 1, 2, and 4 weeks; n = 5 mice per time point), tissue pO2 was measured and the fat pad was harvested. The samples were evaluated using whole-mount staining, capillary density measurements, histologic analysis, and flow cytometric analysis.
Measurements of pO2 in Inguinal Adipose Tissue
Tissue pO2 was measured using an oxygen electrode (200 μm in diameter) and an oxygen monitor (Eiko Kagaku, Tokyo, Japan). The oxygen electrode was directly inserted into mouse inguinal adipose tissue, and an indifferent electrode was inserted into the abdominal subcutaneous space; the system was allowed to equilibrate for 15 to 20 minutes before every measurement.
Whole-Mount Staining
Visualization of living adipose tissue was performed as described previously.9,21 Briefly, the adipose tissue was minced into 3-mm pieces and was incubated with the following reagents for 30 minutes: BODIPY 558/568 (Invitrogen-Molecular Probes) to stain adipocytes, Alexa Fluor 488–conjugated isolectin to stain ECs, and Hoechst 33342 to stain all nuclei. The sample was then washed and directly observed using a confocal microscope system.
Histologic and Immunohistochemical Analyses
Harvested adipose tissue samples were cleaned in PBS, zinc fixed (Zinc Fixative; BD Biosciences), and paraffin embedded. Specimens were sliced into 5-μm sections and were stained with H&E to examine histologic changes. Azan staining was performed to assess tissue fibrosis. To evaluate capillary density, the sections were incubated for 30 minutes with a staining solution containing Alexa Fluor 488–conjugated isolectin and Hoechst 33342. For the same purpose, immunostaining with goat anti-mouse CD31 antibody (BD Biosciences) was also performed. Photographic images of the stained sections were acquired using a fluorescence microscope equipped with a camera. Capillary density was expressed as the number of microvessels observed per optical field averaged across three to four images acquired from each section. The sections were also immunostained with rabbit anti-mouse perilipin antibody (Sigma-Aldrich, St. Louis, MO) to visualize viable adipocytes. The images acquired using the fluorescence microscope were evaluated for the average size of viable adipocytes and their distribution.
Flow Cytometry
Mouse inguinal adipose tissue was minced into 1-mm pieces and digested at 37°C in PBS containing 0.075% collagenase for 60 minutes on a shaker. After centrifugation (800 × g for 10 minutes), the cell pellets (stromal vascular fraction) were resuspended, filtered through a 100-μm mesh, and counted for the total number of cells. Cells were stained with the following monoclonal antibodies conjugated to fluorochromes: anti-mouse CD31-phycoerythrin (PE; BD Biosciences), anti-mouse CD34–fluorescein isothiocyanate (eBioscience, San Diego, CA), and anti-mouse CD45-PE Cy7 (Beckman Coulter, Fullerton, CA). Then, multicolor flow cytometric analyses were performed using an LSR II flow cytometry system. We counted the total number of CD45–/CD31+ cells (vascular ECs) and CD45–/CD31–/CD34+ cells (ASCs) contained in the stromal vascular fraction.
Primary cultured hASCs and HUVECs were examined for surface marker expression using flow cytometry. The following fluorochrome-conjugated monoclonal antibodies were used: anti-CD31–PE, anti-CD34–PE, anti-CD45–PE, anti-CD90–PE, anti-CD105–PE, anti-CD146–PE, anti-CD117–PE (all from BD Biosciences), anti–Flk-1–PE (R&D Systems, Minneapolis, MN), anti-CD133–PE (Miltenyi Biotec, Gladbach, Germany), and anti-vWF–PE (Abcam, Cambridge, UK). Cells were incubated with each antibody for 30 minutes and then were analyzed using an LSR II flow cytometry system. Gates were set on the basis of staining with isotype controls so that no more than 0.1% of cells were detected with control antibodies.
Statistical Analysis
Results are expressed as mean ± SEM The unpaired t-test was used to evaluate the differences between two groups, except in the comparison of pO2 among different mouse inguinal adipose tissues, for which the paired t-test was applied. The level of significance was set at P < 0.05.
Results
AIC Promotes the Proliferation of hASCs and HUVECs
Because AIC administration was intended to simulate adipose tissue injury, we first investigated the response to AIC in vitro of two primary cellular components of adipose tissue, ASCs and ECs. Using fluorescence-activated cell sorting analysis, we confirmed in advance that there were no contaminating ECs in isolated hASC populations (see Supplemental Figure S1 at http://ajp.amjpathol.org).
AIC significantly promoted proliferation of hASCs and HUVECs (Figure 1, A and B; also see Supplemental Figure S2 at http://ajp.amjpathol.org). Although the promotion was observed earlier in HUVECs than in hASCs, HUVECs lost the proliferative effects by day 9 and detached from the dishes. To examine the synergism of the AIC factors, we performed BrdU incorporation assays with incomplete AIC (different combinations with three factors contained in AIC). The proliferative effect of incomplete AIC on hASCs was maintained despite the lack of any one of the four growth factors in AIC (Figure 1C). This suggests that the four factors acted synergistically to promote hASC proliferation. All the growth factors of AIC showed proliferative effects on ASCs except TGF-β, and EGF had the strongest effect of the four growth factors (see Supplemental Figure S3A at http://ajp.amjpathol.org).
Figure 1.
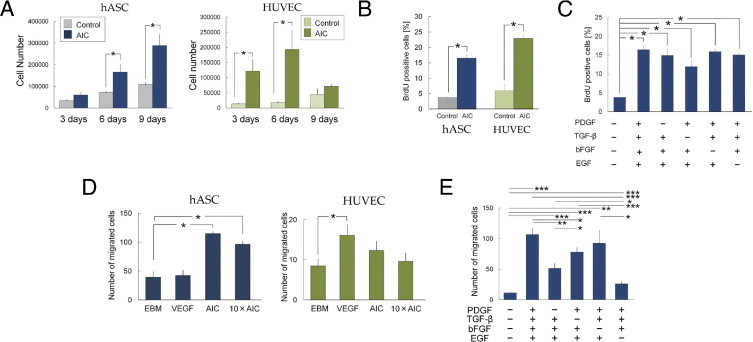
Proliferative and chemotactic effects of AIC. A: Cell numbers of hASCs and HUVECs after culture with or without AIC (n = 6). B: Flow cytometric analysis of BrdU-positive cells (n = 3). C: The proliferative effect of incomplete AIC on hASCs was examined using BrdU incorporation assays (n = 3). D: The number of hASCs (n = 8) and HUVECs (n = 8) that had migrated through 8-μm pores were counted. E: Effects of incomplete AIC on hASC migration (n = 6). *P < 0.05, **P < 0.01, ***P < 0.001. Error bars represent SEM.
AIC Induces hASC Migration but Not HUVEC Migration
The migration assay showed that AIC induced hASC migration but not HUVEC migration (Figure 1D). In contrast, VEGF induced HUVEC migration but not hASC migration. Medium containing 10× AIC promoted the migration of both cell types to the same degree as 1× AIC (Figure 1D), whereas the dilution experiments showed that media containing <0.1× AIC had no significant effects on the migration of either hASCs or HUVECs (see Supplemental Figure S4A at http://ajp.amjpathol.org).
Incomplete AIC had a reduced migration effect on hASCs, except for the combination lacking bFGF (Figure 1E). These results suggest that three growth factors, PDGF, TGF-β, and EGF, worked synergistically in promoting hASC migration, although an increased synergistic effect of all four factors cannot be completely ruled out. Of the three necessary factors, EGF seemed to be the most influential for inducing hASC migration.
AIC-Treated hASCs Show a Higher Capacity for Adipogenic Differentiation and a Lower Capacity for Chondrogenic and Osteogenic Differentiation
Human ASCs were experimentally induced to differentiate into adipocytes, chondrocytes, or osteocytes, regardless of AIC treatment (Figure 2A). Quantitative analyses showed that hASCs pretreated with AIC produced significantly more lipid droplets with the induced adipogenic differentiation compared with controls. On the other hand, AIC-treated hASCs formed significantly smaller micromasses after chondrogenic differentiation, and significantly less calcium was deposited after osteogenic differentiation than control (Figure 2B).
Figure 2.
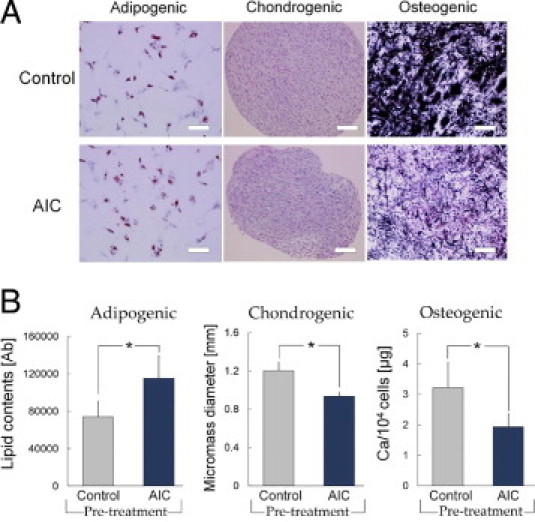
AIC effects on the differentiation capacity of hASCs into adipogenic, chondrogenic, and osteogenic lineages. A: After incubation in EBM with or without AIC for 3 days, hASCs were cultured in separate differentiation media. Representative microscopic images from each assay are shown. Lipid droplets were stained in red (oil red O staining) in adipocytes, chondrogenic micromass was visualized with Alcian blue staining, and Ca deposits in osteocytes were stained in black with von Kossa staining. Scale bars = 100 μm. B: Quantitative analyses of cell differentiation (n = 6). The hASC differentiation capacity was evaluated by measuring lipid droplet content (adipogenic), micromass diameter (chondrogenic), or total calcium content (osteogenic). *P < 0.05. Error bars represent SEM.
AIC-Treated hASCs Form Complex Capillary-Like Networks
Network formation assay on Matrigel showed that AIC-pretreated hASCs formed a complex capillary-like network structure, whereas untreated hASCs showed cell sprouting and formed only closed polygon-like structures (Figure 3A). AIC-treated hASCs formed networks more quickly and intricately than did HUVECs, which formed orderly networks regardless of AIC pretreatment. Supplementation of VEGF did not affect the network length of hASCs or HUVECs, except when HUVECs had been pretreated with AIC (Figure 3B). The effects of AIC on hASC network formation were dose dependent in a range of 0.001× to 1× AIC, although 1× and 10× AIC showed equivalent efficacy (see Supplemental Figure S4B at http://ajp.amjpathol.org). The assessments using incomplete AIC showed that the growth factors had synergistic effects on hASC network formation. Among the four factors, bFGF had the strongest promoting effect; the absence of bFGF significantly suppressed hASC network formation. In addition, any combination of two growth factors including bFGF or bFGF alone showed a significant increase in total network length compared with control (Figure 3C; also see Supplemental Figure S3B at http://ajp.amjpathol.org).
Figure 3.
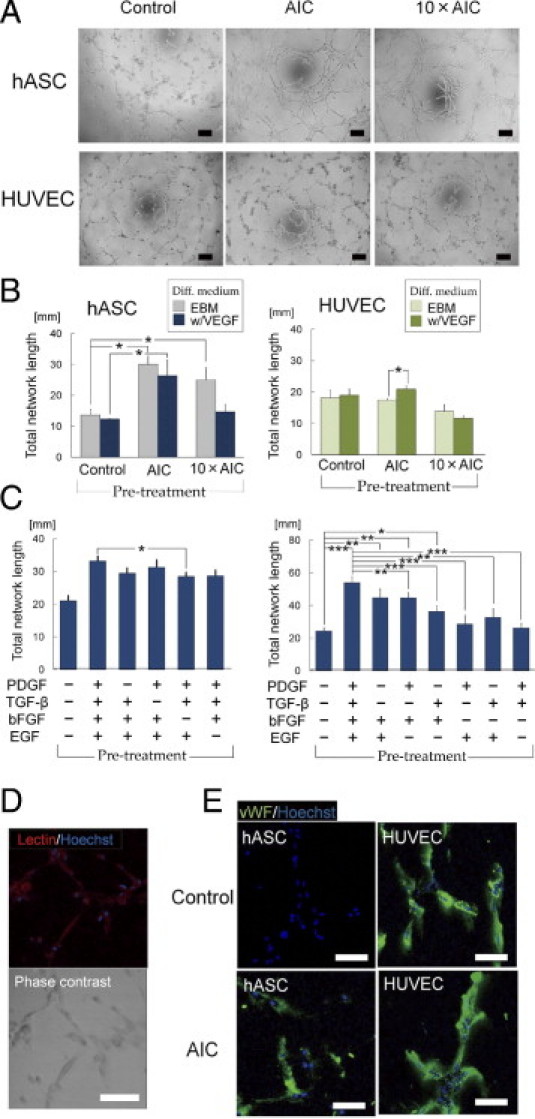
AIC effects on network formation of hASCs and HUVECs. After pretreatment with or without AIC for 24 hours, cells were cultured on Matrigel for 6 hours. A: Representative photographs of network formations. Scale bars = 200 μm. B: Effects of AIC on total network length (n = 4). C: Effects of incomplete AIC on hASC network formation (n = 7). *P < 0.05, **P < 0.01, ***P < 0.001. D: The networks formed by AIC-treated hASCs were stained with lectin (red stain). Scale bar = 100 μm. E: The capillary-like networks were immunostained with vWF (green stain). Scale bars = 100 μm. Error bars represent SEM.
The networks formed by AIC-treated hASCs were positive for lectin (Figure 3D) and expressed vWF at the levels observed in HUVECs, whereas the formations of control hASCs were nearly negative for vWF (Figure 3E). Furthermore, we detected a small number of CD31-expressing cells in the networks formed by AIC-treated hASCs (see Supplemental Figure S5 at http://ajp.amjpathol.org). These indicated that AIC pretreatment contributed to ASCs' differentiation into ECs. In the co-culture assay with HUVECs and AIC-treated hASCs on Matrigel, the two types of cells collaboratively formed networks. Both cells were equally positive for vWF, suggesting that AIC-treated hASCs were similar to ECs (see Supplemental Figure S6 at http://ajp.amjpathol.org).
AIC Effect Quicker Recovery of pO2 and Higher Capillary Density in a Surgically Induced Ischemic Adipose Tissue
To investigate the in vivo effects, AIC was injected into ischemic or nonischemic subcutaneous adipose tissue in mice. When AIC or vehicle was administered into unperturbed inguinal adipose tissue of healthy mice, AIC increased capillary density and resulted in a higher mean ± SEM pO2 value (61.5 ± 3.5 mm Hg, n = 9) than in controls (51.9 ± 3.6 mm Hg, n = 9) at 1 week, but there was no significant difference between the two groups at 2 and 4 weeks (see Supplemental Figures S7 and S8 at http://ajp.amjpathol.org). By surgical intervention (ligation of the nutrient vessels; Figure 4A) for the ischemic models, mean ± SEM tissue pO2 was reduced from 61.4 ± 1.0 mmHg (n = 134) to 18.1 ± 1.0 mmHg (n = 64). One week later, the AIC-treated ischemic adipose tissue showed significantly improved mean ± SEM pO2 (44.6 ± 2.9 mmHg, n = 9) compared with the vehicle-injected contralateral ischemic adipose tissue (29.2 ± 2.1 mmHg, n = 9) (Figure 4B). Whole-mount histologic analysis showed a visible increase in adipose capillaries as early as 1 week after AIC treatment (Figure 4C), and the capillary density was significantly higher in the AIC-treated group throughout the investigation period (Figure 4D; see also Supplemental Figure S8 at http://ajp.amjpathol.org).
Figure 4.
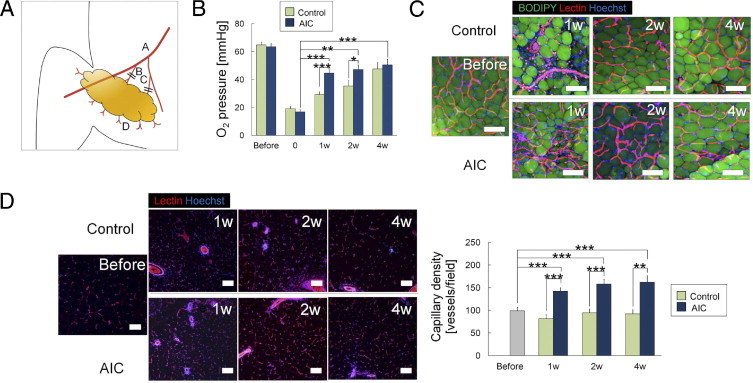
AIC effects on adipose tissue with acute ischemia, part I. A: Schematic of surgical induction of ischemia in the inguinal adipose tissue of mice. Acute ischemia was induced by severing dominant nutrient vessels arising from the femoral vessels (B) and vessels arising from the branch to the adductor muscles (C). A, femoral vessels; D, communicating branches to the skin. B: Time course of adipose tissue pO2 (n = 10). C: Whole-mount histologic analysis of adipose tissue. Harvested living tissue samples were stained with BODIPY (adipocytes; green), lectin (ECs; red), and Hoechst 33342 (nuclei; blue). Scale bars = 100 μm. D: Vascular density was evaluated using lectin-stained sections (n = 9). *P < 0.05, **P < 0.01, ***P < 0.001. Error bars represent SEM.
Gene expression analyses of the whole inguinal adipose tissue revealed that AIC treatment induced up-regulation of CD34 mRNA at 1 week, followed by up-regulation of Flk-1 and CD31 (Figure 5A). The CD34 up-regulation might suggest the ASC proliferation promoted by AIC because CD34+/CD31– cells in a living adipose tissue are regarded as ASCs. In the adipose repair/remodeling processes, fibrous scar tissue was also formed. Histologic assessment revealed that ischemia induction and vehicle administration caused a significant increase in the fibrous area throughout the 4-week experimental period (Figure 5B). AIC treatment significantly suppressed the fibrogenesis at 2 and 4 weeks.
Figure 5.
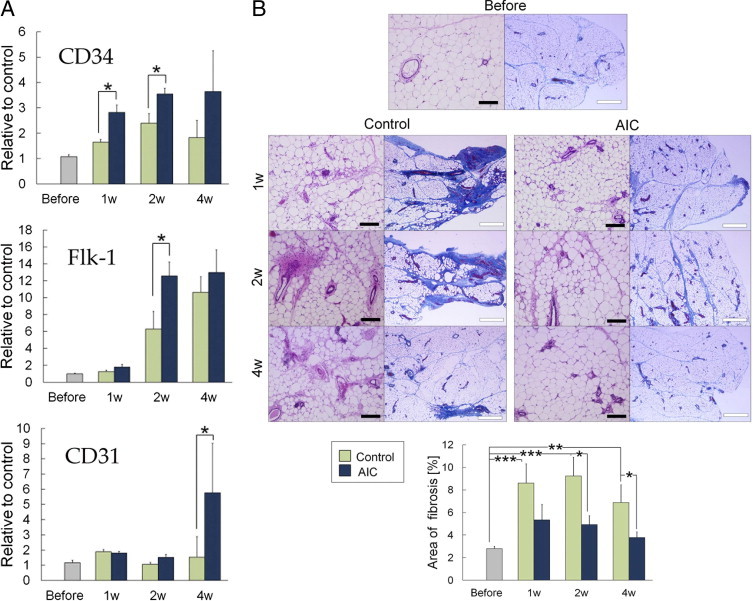
AIC effects on adipose tissue with acute ischemia, part II. A: Whole inguinal adipose tissue was homogenized, and mRNA expressions were examined using real-time PCR analysis (n = 3). B: Representative histologic assessment and quantification of fibrous areas (n = 6) with azan-stained sections. *P < 0.05; **P < 0.01; ***P < 0.001. Error bars represent SEM. Black bar indicates 200 μm; white bar indicates 500 μm.
AIC Induces Angiogenesis and Adipogenesis in Chronically Ischemic Adipose Tissue of Diabetic Mouse
The adipose tissue of diabetic obese mice showed significantly lower mean ± SEM pO2 (45.5 ± 1.5 mmHg, n = 36) than did that of nondiabetic mice (61.4 ± 1.0 mmHg, n = 134). Administration of AIC also caused an elevation of pO2 in the chronically ischemic adipose tissue accompanying diabetes; the pO2 level was significantly higher at 1 and 4 weeks in AIC-treated adipose tissue compared with untreated adipose tissue and vehicle-treated counterparts (Figure 6A). AIC treatment was also associated with a significant increase in capillary density compared with control; this was observed as early as 1 week and up to 4 weeks (Figure 6, B and C; see also Supplemental Figure S8 at http://ajp.amjpathol.org).
Figure 6.

AIC effects on diabetic adipose tissue with chronic hypoxia, part I. A: Time course of adipose tissue pO2 in db/db mice (n = 5). B: Whole-mount histologic analysis of living adipose tissue. Harvested, unfixed tissue samples were stained with BODIPY (adipocytes; green), lectin (ECs; red), and Hoechst 33342 (nuclei; blue). Scale bars = 50 μm. C: Histologic sections were stained with lectin (ECs; red) and Hoechst 33342 (nuclei; blue), and capillary density was calculated (n = 6). *P < 0.05; **P < 0.01. Scale bars = 100 μm. Error bars represent SEM.
Flow cytometric analysis showed that AIC-treated adipose tissue included a much larger number of adipose-derived proliferating (CD45–/BrdU+) cells than did the control tissue (Figure 7A). Among the proliferating cells, CD31–/CD34+ cells (ASCs) and CD31+ cells (ECs) were main populations and composed 53.1% and 32.4%, respectively. Next, we performed immunohistologic staining with perilipin. We observed viable small-sized adipocytes (<25 μm in diameter), suggesting ongoing adipogenesis, and they increased in number over time in AIC-administered adipose tissue (Figure 7, B and C). Capillaries were frequently observed around the small-sized adipocytes.
Figure 7.
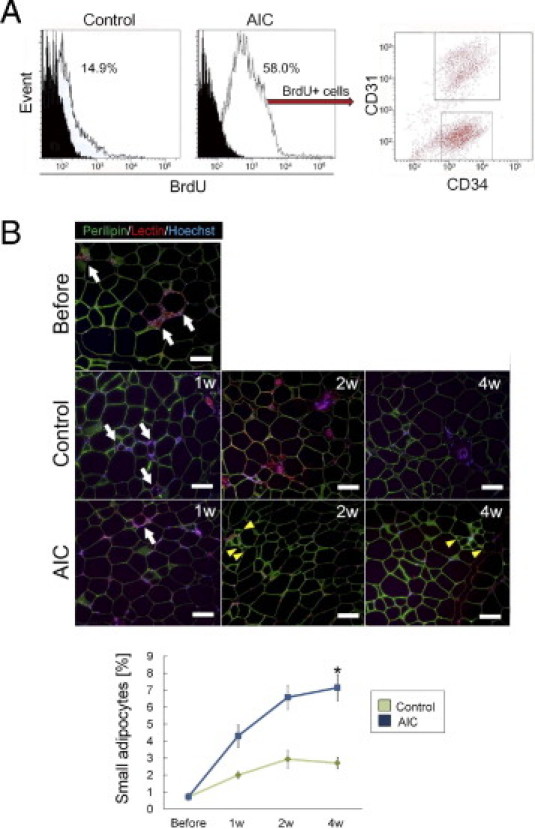
AIC effects on diabetic adipose tissue with chronic hypoxia, part II. A: Flow cytometric analysis of freshly isolated stromal vascular fraction from diabetic adipose tissue. The histograms of CD45– cells represent the proportion of BrdU+ cells in vehicle-treated tissue (left) or in AIC-treated tissue (right). B: Immunohistochemical staining images. The sections were stained with perilipin (viable adipocytes; green), lectin (ECs; blue), and Hoechst 33342 (nuclei; blue). Perilipin-negative adipocytes surrounded by macrophages (so-called crown-like structure; white arrows), suggesting degenerated adipocytes, were occasionally observed. The proportion of perilipin-positive small-sized adipocytes (yellow arrowheads), suggesting ongoing adipogenesis, was counted and calculated (n = 4). *P < 0.05. Scale bars = 100 μm. Error bars represent SEM.
Thus, local administration of AIC mitigated hypoxia of diabetic adipose tissue. Our results suggest that AIC-responsive cellular events contributed to angiogenesis and adipogenesis during the remodeling process and improved tissue oxygen tension.
Discussion
Of the four AIC factors, bFGF and TGF-β are generally released from injured extracellular matrix or dying cells, whereas EGF, PDGF, and TGF-β are released from activated platelets on bleeding.17,22,23 Recently, it was also demonstrated that EGF is released from apoptotic ECs and activates antiapoptotic response in mesenchymal stem cells.24 AIC does not contain either VEGF or hepatocyte growth factor (HGF), which are considered to be major proangiogenic factors. In migration and capillary-forming assays, VEGF preferentially affected ECs compared with hASCs. VEGF and HGF are released from hASCs in some conditions, including hypoxia,13 and may not be essential activators for ASCs. Indeed, VEGF and HGF protein levels increased in the later phase of adipose wound healing.17
We found that AIC significantly promoted hASCs to proliferate, migrate, and form networks. Especially, the promotion of ASCs to form networks was one of the most impressive effects of AIC in this study. AIC-treated hASCs were able to form complex networks, which were positive for vWF and lectin, by themselves. Untreated hASCs expressed pericyte markers, such as α-smooth muscle actin and CD140b, yet their expression was suppressed by AIC treatment (data not shown). These results suggest that AIC induced hASCs at least partly to differentiate into cells of endothelial lineage. As for mesenchymal differentiation capacities, AIC-treated hASCs showed a higher capacity for adipogenic differentiation and a lower capacity for chondrogenic or osteogenic differentiation compared with controls. Thus, in response to AIC, hASCs seemed to preferentially differentiate into adipocytes and/or vascular cells. This would explain a lot about the physiologic manifestations of adipose tissue remodeling observed after injury.
We performed preliminary experiments to evaluate the extent of endothelial differentiation of hASCs placed in diverse environments (eg, in cultures with bFGF or inflammatory cytokines, in various major media, on major extracellular matrix, in hypoxic conditions, and in co-cultures with HUVECs), and we found that no single factor or simple combination could induce a remarkable tendency to differentiate the endothelial lineage of hASCs (data not shown), although antibodies against bFGF and PDGF were reported to affect tube formation by ASCs.25 Therefore, various factors and their complicated interplay seemed to be essential. Indeed, in some previous reports, superior results for angiogenesis have been obtained through the application of multiple factors than through the introduction of a single factor, eg, paired combinations of bFGF and PDGF,26,27 VEGF and bFGF,28,29 VEGF and PDGF,30 or PDGF and TGF-β,31 or a triple combination of bFGF, PDGF, and VEGF.32 Our findings with incomplete AIC with either two or three growth factors suggest that PDGF, EGF, and TGF-β contributed to hASC migration and that bFGF played a pivotal role in network formation, although these effects were likely augmented by the synergism of all of the factors. Although the reproducible methods for inducing hASC differentiation into smooth muscle cell lineages have been reported previously,33 ASC differentiation protocols into ECs currently remain to be established. These results provide some insights into establishing an efficient, standard protocol for this purpose.
After confirmation of AIC potentials in vitro, we targeted the development of a therapy for mitigating tissue hypoxia; the overall results of animal studies indicated that AIC had promising therapeutic effects. When administered in normoxic adipose tissue (mean ± SEM pO2 = 61.4 ± 1.0 mmHg), the capillary density significantly increased, but the adipose tissue pO2 did not significantly change. This was possibly because each tissue has an individual maximum tissue pO2 that is restricted by the arterial pO2. When administered into hypoxic adipose tissue induced by surgical intervention, the AIC treatment significantly increased capillary density and accelerated the recovery of tissue pO2. Furthermore, AIC contributed to the inhibition of ischemia-induced fibrogenesis, probably by accelerating favorable tissue regeneration/remodeling, as suggested by a previous study.9 A key contribution of AIC in the repair process is likely angiogenesis; AIC administration activated ASCs, increased the number of ECs, increased capillary density, and, consequently, accelerated tissue pO2 recovery. In chronically hypoxic adipose tissue of diabetic mice, the most influential effects among the three experimental models were observed. The subcutaneous adipose tissue in diabetic obese mice exhibited low pO2, as reported previously,34,35 presumably as a result of increased adipocyte size and lower capillary density; in other words, because of imbalance of adipogenesis and angiogenesis.8,36,37 Decreased capillary density in obese adipose tissue might underlie low pO2 and chronic adipose inflammation, which increased the risk of cardiovascular disease.37 The present results suggest that AIC has therapeutic potential as a proangiogenic tool against chronic ischemia and inflammation in obese adipose tissue and may also contribute to reducing the risk of metabolic syndrome. A recent study suggested that aggregate formation and delivery may be another way to induce the therapeutic potentials of ASCs in diabetic mice,15 although it is cell therapy.
This study focused on adipose tissue as a target tissue. To our knowledge, adipose tissue generally shows considerably high tissue pO2 compared with other tissues or organs and supports the vascularity of overlying skin. Intact adipose tissue exhibited pO2 >50 mmHg,37,38 whereas other tissues were reported to exhibit pO2 <30 mmHg; eg, the pO2 values of brain, spleen, and thymus were reported to range from 5 to 20 mmHg.38–40 Tissue pO2 is affected by arterial pO2, blood flow, and the cellular oxygen consumption rate.37 It is known that adipose tissue is more vulnerable to ischemia than skin, and necrosis of subcutaneous adipose tissue, known as deep tissue injury, can seriously affect the vascularity of overlying skin.41 Therefore, it is practical to target adipose tissue for angiogenesis in clinical settings. For example, AIC could be used to treat intractable skin ulcers with ischemia or hypoxia, such as diabetic or decubitus ulcers, or to improve vascularity in ischemic limbs with artery occlusive diseases.
Angiogenic therapy with AIC has several therapeutic advantages. First, AIC treatment is a minimally invasive therapy without any particular donor site morbidity and the need for cell preparation and manipulation, which are costly and raise risk issues. Second, a single administration of AIC is likely to be sufficiently effective, as shown in this study; AIC was the initiator, but presumably not a main player, in the remodeling process. Third, AIC can be prepared at a low cost. Because EGF, PDGF, and TGF-β are released from activated platelets and are well contained in the platelet-rich plasma of patients,17,42 a solution similar to AIC can be prepared by supplementing platelet-rich plasma with bFGF, although the therapeutic effects of this substitute remain to be determined. Recombinant bFGF protein is an approved therapeutic product (Fiblast Spray; Kaken Pharmaceutical Co. Ltd., Tokyo, Japan) in Japan; it is topically used to accelerate wound healing in chronic skin ulcers.
There are also some unresolved issues that suggest limitations of AIC therapy. AIC administration is not expected to show remarkable effects in tissues with acute wounds because the release of AIC components is a natural response to injury and hemorrhage and the beneficial effects unlikely increase with excessive administration of AIC, as shown by our results with 10× AIC. In addition, AIC would not have large effects in ASC-deficient (or resident stem/progenitor cell–deficient) sites, such as irradiated tissues, because many AIC effects are likely mediated by the activation of ASCs. In those cases, the administration of AIC-treated ASCs or the combined administration of ASCs and AIC may be required to achieve sufficient therapeutic effects.
Acknowledgments
We thank Ayako Kurata for her technical support (University of Tokyo, Tokyo, Japan).
Footnotes
Supported by contract grant B-21791739 from the Japanese Ministry of Education, Culture, Sports, Science, and Technology.
Kaken Pharmaceutical Co. Ltd. provided recombinant bFGF reagent.
Supplemental material for this article can be found at http://ajp.amjpathol.org or at doi: 10.1016/j.ajpath.2011.01.032.
Supplementary data
Flow cytometric analysis of primary isolated hASCs (n = 3) and HUVECs (n = 3). In fluorescence-activated cell sorting plots, solid gray histograms represent cells stained with the fluorescent-conjugated antibody of interest, and solid red lines represent cells stained with fluorescent-conjugated isotype control antibody. None of the hASCs expressed CD31, vWF, Flk-1, or CD117, which were expressed by HUVECs, whereas all of the hASCs expressed CD90, which was not expressed by HUVECs, suggesting the absence of contamination of vascular ECs in the ASC population.
Inverted microscopic images of hASCs and HUVECs cultured with or without AIC for 5 days. Scale bars = 200 μm.
The effects of each growth factor included in AIC on proliferation and network formation of hASCs. A: The proliferative effect of each single factor on hASCs was examined using BrdU incorporation assays (n = 3).*P < 0.05. B: Effect of each single factor on network formation by hASCs (n = 3). *P < 0.05. Error bars represent SEM.
Dose-dependent effects of AIC on migration and network formation of hASCs and HUVECs. A: Effects of the concentrated AIC medium (10× AIC) and diluted AIC media (0.1×, 0.01×, and 0.001× AIC) on migration of hASCs (n = 4) and HUVECs (n = 4). “0×” indicates control medium (no AIC). *P < 0.05. B: Effects of the concentrated AIC medium (10× AIC) and diluted AIC media (0.1×, 0.01×, and 0.001× AIC) on network formation by hASCs (n = 3) and HUVECs (n = 3). *P < 0.05. NS, not significant. Error bars represent SEM.
Immunohistochemical analysis of networks formed by hASCs and HUVECs. Most HUVECs on Matrigel were positive for CD31 (green) regardless of AIC pretreatment. A small number of AIC-treated ASCs were positive for CD31 (green), whereas none of the control hASCs were positive for CD31. All nuclei were stained with Hoechst 33342 (blue). Scale bars = 50 μm.
The Matrigel co-culture system of AIC-treated hASCs and HUVECs. A: AIC-treated hASCs were labeled with DiO (green) and seeded with DiI-labeled HUVECs (red). Scale bars = 200 μm. B: AIC-treated and DiO-labeled hASCs (green) and unlabeled HUVECs. The networks were immunostained for vWF (red). Scale bar = 100 μm.
AIC effects on nonischemic adipose tissue. A:pO2 of the inguinal adipose pad (n = 10). To investigate the in vivo effects of AIC on nonischemic subcutaneous adipose tissue, AIC or vehicle was injected into the inguinal subcutaneous adipose pad of mice. At 1 week, the AIC-treated adipose tissue showed a higher pO2 value than did the vehicle-treated control, but there was no significant difference between the two groups at 2 or 4 weeks. *P < 0.05. B: Whole-mount histologic analysis of the adipose tissue. Harvested living tissue samples were stained with BODIPY (adipocytes; green), lectin (ECs; red), and Hoechst 33342 (nuclei; blue). An increased number of infiltrating nucleated cells and lectin-positive cells were observed in the interstitial spaces between adipocytes at 1 week in both groups, and they seemed to decrease in number earlier in the AIC-treated group than in controls. Scale bars = 50 μm. C: Quantification of capillary density (n = 10). Paraffin-embedded tissue was stained with lectin (ECs; red) and Hoechst 33342 (nuclei; blue). A significantly increased number of capillaries compared with the control were observed in AIC-treated adipose tissue at 1, 2, and 4 weeks. Scale bars = 100 μm. *P < 0.05; **P < 0.01. Error bars represent SEM.
Microscopic images of ischemic and nonischemic murine adipose tissues after administration of AIC or vehicle. Each section was stained with CD31 (red) and Hoechst 33342 (blue). A: Nonischemic adipose tissue. B: Surgically induced ischemic adipose tissue. C: Chronically ischemic adipose tissue of diabetic mice. In all cases, AIC treatment increased the number of CD31-positive vascular structures. Inflammatory cells infiltrating interstitial spaces and around dead adipocytes were also stained with CD31, especially in the surgically induced ischemia model. Scale bars = 100 μm.
References
- 1.Strawford A., Antelo F., Christiansen M., Hellerstein M.K. Adipose tissue triglyceride turnover, de novo lipogenesis, and cell proliferation in humans measured with 2H2O. Am J Physiol Endocrinol Metab. 2004;286:E577–E588. doi: 10.1152/ajpendo.00093.2003. [DOI] [PubMed] [Google Scholar]
- 2.Spalding K.L., Arner E., Westermark P.O., Bernard S., Buchholz B.A., Bergmann O., Blomqvist L., Hoffstedt J., Näslund E., Britton T., Concha H., Hassan M., Rydén M., Frisén J., Arner P. Dynamics of fat cell turnover in humans. Nature. 2008;453:783–787. doi: 10.1038/nature06902. [DOI] [PubMed] [Google Scholar]
- 3.Zuk P.A., Zhu M., Ashjian P., De Ugarte D.A., Huang J.I., Mizuno H., Alfonso Z.C., Fraser J.K., Benhaim P., Hedrick M.H. Human adipose tissue is a source of multipotent stem cells. Mol Biol Cell. 2002;13:4279–4295. doi: 10.1091/mbc.E02-02-0105. [DOI] [PMC free article] [PubMed] [Google Scholar]
- 4.Zannettino A.C., Paton S., Arthur A., Khor F., Itescu S., Gimble J.M., Gronthos S. Multipotential human adipose-derived stromal stem cells exhibit a perivascular phenotype in vitro and in vivo. J Cell Physiol. 2008;214:413–421. doi: 10.1002/jcp.21210. [DOI] [PubMed] [Google Scholar]
- 5.Crisan M., Yap S., Casteilla L., Chen C.W., Corselli M., Park T.S., Andriolo G., Sun B., Zheng B., Zhang L., Norotte C., Teng P.N., Traas J., Schugar R., Deasy B.M., Badylak S., Buhring H.J., Giacobino J.P., Lazzari L., Huard J., Péault B. A perivascular origin for mesenchymal stem cells in multiple human organs. Cell Stem Cell. 2008;3:301–313. doi: 10.1016/j.stem.2008.07.003. [DOI] [PubMed] [Google Scholar]
- 6.Tang W., Zeve D., Suh J.M., Bosnakovski D., Kyba M., Hammer R.E., Tallquist M.D., Graff J.M. White fat progenitor cells reside in the adipose vasculature. Science. 2008;322:583–586. doi: 10.1126/science.1156232. [DOI] [PMC free article] [PubMed] [Google Scholar]
- 7.Traktuev D.O., Merfeld-Clauss S., Li J., Kolonin M., Arap W., Pasqualini R., Johnstone B.H., March K.L. A population of multipotent CD34-positive adipose stromal cells share pericyte and mesenchymal surface markers, reside in a periendothelial location, and stabilize endothelial networks. Circ Res. 2008;102:77–85. doi: 10.1161/CIRCRESAHA.107.159475. [DOI] [PubMed] [Google Scholar]
- 8.Yoshimura K., Suga H., Eto H. Adipose-derived stem/progenitor cells: roles in adipose tissue remodeling and potential use for soft tissue augmentation. Regen Med. 2009;4:265–273. doi: 10.2217/17460751.4.2.265. [DOI] [PubMed] [Google Scholar]
- 9.Suga H., Eto H., Shigeura T., Inoue K., Aoi N., Kato H., Nishimura S., Manabe I., Gonda K., Yoshimura K. IFATS collection: fibroblast growth factor-2–induced hepatocyte growth factor secretion by adipose-derived stromal cells inhibits postinjury fibrogenesis through a c-Jun N-terminal kinase-dependent mechanism. Stem Cells. 2009;27:238–249. doi: 10.1634/stemcells.2008-0261. [DOI] [PubMed] [Google Scholar]
- 10.Planat-Benard V., Silvestre J.S., Cousin B., André M., Nibbelink M., Tamarat R., Clergue M., Manneville C., Saillan-Barreau C., Duriez M., Tedgui A., Levy B., Pénicaud L., Casteilla L. Plasticity of human adipose lineage cells toward endothelial cells: physiological and therapeutic perspectives. Circulation. 2004;109:656–663. doi: 10.1161/01.CIR.0000114522.38265.61. [DOI] [PubMed] [Google Scholar]
- 11.Miranville A., Heeschen C., Sengenes C., Curat C.A., Busse R., Bouloumié A. Improvement of postnatal neovascularization by human adipose tissue-derived stem cells. Circulation. 2005;110:349–355. doi: 10.1161/01.CIR.0000135466.16823.D0. [DOI] [PubMed] [Google Scholar]
- 12.Matsumoto D., Sato K., Gonda K., Takaki Y., Shigeura T., Sato T., Aiba-Kojima E., Iizuka F., Inoue K., Suga H., Yoshimura K. Cell-assisted lipotransfer: supportive use of human adipose-derived cells for soft tissue augmentation with lipoinjection. Tissue Eng. 2006;12:3375–3382. doi: 10.1089/ten.2006.12.3375. [DOI] [PubMed] [Google Scholar]
- 13.Rehman J., Traktuev D., Li J., Merfeld-Clauss S., Temm-Grove C.J., Bovenkerk J.E., Pell C.L., Johnstone B.H., Considine R.V., March K.L. Secretion of angiogenic and antiapoptotic factors by human adipose stromal cells. Circulation. 2004;109:1292–1298. doi: 10.1161/01.CIR.0000121425.42966.F1. [DOI] [PubMed] [Google Scholar]
- 14.Kilroy G.E., Foster S.J., Wu X., Ruiz J., Sherwood S., Heifetz A., Ludlow J.W., Stricker D.M., Potiny S., Green P., Halvorsen Y.D., Cheatham B., Storms R.W., Gimble J.M. Cytokine profile of human adipose-derived stem cells: expression of angiogenic, hematopoietic, and pro-inflammatory factors. J Cell Physiol. 2007;212:702–709. doi: 10.1002/jcp.21068. [DOI] [PubMed] [Google Scholar]
- 15.Amos P.J., Kapur S.K., Stapor P.C., Shang H., Bekiranov S., Khurgel M., Rodeheaver G.T., Peirce S.M., Katz A.J. Human adipose-derived stromal cells accelerate diabetic wound healing: impact of cell formulation and delivery. Tissue Eng Part A. 2010;16:1595–1606. doi: 10.1089/ten.tea.2009.0616. [DOI] [PMC free article] [PubMed] [Google Scholar]
- 16.Gonda K., Nakaoka T., Yoshimura K., Otawara-Hamamoto Y., Harrii K. Heterotopic ossification of degenerating rat skeletal muscle induced by adenovirus-mediated transfer of bone morphogenetic protein-2 gene. J Bone Miner Res. 2000;15:1056–1065. doi: 10.1359/jbmr.2000.15.6.1056. [DOI] [PubMed] [Google Scholar]
- 17.Aiba-Kojima E., Tsuno N.H., Inoue K., Matsumoto D., Shigeura T., Sato T., Suga H., Kato H., Nagase T., Gonda K., Koshima I., Takahashi K., Yoshimura K. Characterization of wound drainage fluids as a source of soluble factors associated with wound healing: comparison with platelet-rich plasma and potential use in cell culture. Wound Repair Regen. 2007;15:511–520. doi: 10.1111/j.1524-475X.2007.00259.x. [DOI] [PubMed] [Google Scholar]
- 18.Yoshimura K., Shigeura T., Matsumoto D., Sato T., Takaki Y., Aiba-Kojima E., Sato K., Inoue K., Nagase T., Koshima I., Gonda K. Characterization of freshly isolated and cultured cells derived from the fatty and fluid portions of liposuction aspirates. J Cell Physiol. 2006;208:64–76. doi: 10.1002/jcp.20636. [DOI] [PubMed] [Google Scholar]
- 19.Jaffe E.A., Nachman R.L., Becker C.G., Minick C.R. Culture of human endothelial cells derived from umbilical veins: identification by morphologic and immunologic criteria. J Clin Invest. 1973;52:2745–2756. doi: 10.1172/JCI107470. [DOI] [PMC free article] [PubMed] [Google Scholar]
- 20.Johnstone B., Hering T.M., Caplan A.I. In vitro chondrogenesis of bone marrow-derived mesenchymal progenitor cells. Exp Cell Res. 1998;238:265–272. doi: 10.1006/excr.1997.3858. [DOI] [PubMed] [Google Scholar]
- 21.Nishimura S., Manabe I., Nagasaki M., Hosoya Y., Yamashita H., Fujita H., Ohsugi M., Tobe K., Kadowaki T., Nagai R., Sugiura S. Adipogenesis in obesity requires close interplay between differentiating adipocytes, stromal cells, and blood vessels. Diabetes. 2007;56:1517–1526. doi: 10.2337/db06-1749. [DOI] [PubMed] [Google Scholar]
- 22.Muthukrishnan L., Warder E., McNeil P.L. Basic fibroblast growth factor is efficiently released from a cytolsolic storage site through plasma membrane disruptions of endothelial cells. J Cell Physiol. 1991;148:1–16. doi: 10.1002/jcp.1041480102. [DOI] [PubMed] [Google Scholar]
- 23.Werner S., Grose R. Regulation of wound healing by growth factors and cytokines. Physiol Rev. 2003;83:835–870. doi: 10.1152/physrev.2003.83.3.835. [DOI] [PubMed] [Google Scholar]
- 24.Soulez M., Sirois I., Brassard N., Raymond M.A., Nicodème F., Noiseux N., Durocher Y., Pshezhetsky A.V., Hébert M.J. Epidermal growth factor and perlecan fragments produced by apoptotic endothelial cells co-ordinately activate ERK1/2-dependent antiapoptotic pathways in mesenchymal stem cells. Stem Cells. 2010;28:810–820. doi: 10.1002/stem.403. [DOI] [PubMed] [Google Scholar]
- 25.Keerl S., Gehmert S., Gehmert S., Song Y.H., Alt E. PDGF and bFGF modulate tube formation in adipose tissue-derived stem cells. Ann Plast Surg. 2010;64:487–490. doi: 10.1097/SAP.0b013e31819f3a3d. [DOI] [PubMed] [Google Scholar]
- 26.Cao R., Bråkenhielm E., Pawliuk R., Wariaro D., Post M.J., Wahlberg E., Leboulch P., Cao Y. Angiogenic synergism, vascular stability and improvement of hind-limb ischemia by a combination of PDGF-BB and FGF-2. Nat Med. 2003;9:604–613. doi: 10.1038/nm848. [DOI] [PubMed] [Google Scholar]
- 27.Nissen L.J., Cao R., Hedlund E.M., Wang Z., Zhao X., Wetterskog D., Funa K., Bråkenhielm E., Cao Y. Angiogenic factors FGF2 and PDGF-BB synergistically promote murine tumor neovascularization and metastasis. J Clin Invest. 2007;117:2766–2777. doi: 10.1172/JCI32479. [DOI] [PMC free article] [PubMed] [Google Scholar]
- 28.Ley C.D., Olsen M.W., Lund E.L., Kristjansen P.E. Angiogenic synergy of bFGF and VEGF is antagonized by Angiopoietin-2 in a modified in vivo Matrigel assay. Microvasc Res. 2004;68:161–168. doi: 10.1016/j.mvr.2004.06.002. [DOI] [PubMed] [Google Scholar]
- 29.Kano M.R., Morishita Y., Iwata C., Iwasaka S., Watabe T., Ouchi Y., Miyazono K., Miyazawa K. VEGF-A and FGF-2 synergistically promote neoangiogenesis through enhancement of endogenous PDGF-B-PDGFRβ signaling. J Cell Sci. 2005;118:3759–3768. doi: 10.1242/jcs.02483. [DOI] [PubMed] [Google Scholar]
- 30.Richardson T.P., Peters M.C., Ennett A.B., Mooney D.J. Polymeric system for dual growth factor delivery. Nat Biotechnol. 2001;19:1029–1034. doi: 10.1038/nbt1101-1029. [DOI] [PubMed] [Google Scholar]
- 31.Ashraf A., Lee P.H., Kim K., Zaporojan V., Bonassar L., Valentini R., Spangenberger A., Weinzweig J. Effect of sustained-release PDGF and TGF-β on cyclophosphamide-induced impaired wound healing. Plast Reconstr Surg. 2009;124:1118–1124. doi: 10.1097/PRS.0b013e3181b5a349. [DOI] [PubMed] [Google Scholar]
- 32.Rophael J.A., Craft R.O., Palmer J.A., Hussey A.J., Thomas G.P., Morrison W.A., Penington A.J., Mitchell G.M. Angiogenic growth factor synergism in a murine tissue engineering model of angiogenesis and adipogenesis. Am J Pathol. 2007;171:2048–2057. doi: 10.2353/ajpath.2007.070066. [DOI] [PMC free article] [PubMed] [Google Scholar]
- 33.Jeon E.S., Park W.S., Lee M.J., Kim Y.M., Han J., Kim J.H. A Rho kinase/myocardin-related transcription factor-A–dependent mechanism underlies the sphingosylphosphorylcholine-induced differentiation of mesenchymal stem cells into contractile smooth muscle cells. Circ Res. 2008;103:635–642. doi: 10.1161/CIRCRESAHA.108.180885. [DOI] [PubMed] [Google Scholar]
- 34.Ye J., Gao Z., Yin J., He Q. Hypoxia is a potential risk factor for chronic inflammation and adiponectin reduction in adipose tissue of ob/ob and dietary obese mice. Am J Physiol Endocrinol Metab. 2007;293:E1118–E1128. doi: 10.1152/ajpendo.00435.2007. [DOI] [PubMed] [Google Scholar]
- 35.Hosogai N., Fukuhara A., Oshima K., Miyata Y., Tanaka S., Segawa K., Furukawa S., Tochino Y., Komuro R., Matsuda M., Shimomura I. Adipose tissue hypoxia in obesity and its impact on adipocytokine dysregulation. Diabetes. 2007;56:901–911. doi: 10.2337/db06-0911. [DOI] [PubMed] [Google Scholar]
- 36.Lijnen H.R. Angiogenesis and obesity. Cardiovasc Res. 2008;78:286–293. doi: 10.1093/cvr/cvm007. [DOI] [PubMed] [Google Scholar]
- 37.Pasarica M., Sereda O.R., Redman L.M., Albarado D.C., Hymel D.T., Roan L.E., Rood J.C., Burk D.H., Smith S.R. Reduced adipose tissue oxygenation in human obesity: evidence for rarefaction, macrophage chemotaxis, and inflammation without an angiogenic response. Diabetes. 2009;58:718–725. doi: 10.2337/db08-1098. [DOI] [PMC free article] [PubMed] [Google Scholar]
- 38.Erecińska M., Silver I.A. Tissue oxygen tension and brain sensitivity to hypoxia. Respir Physiol. 2001;128:263–276. doi: 10.1016/s0034-5687(01)00306-1. [DOI] [PubMed] [Google Scholar]
- 39.Braun R.D., Lanzen J.L., Snyder S.A., Dewhirst M.W. Comparison of tumor and normal tissue oxygen tension measurements using OxyLite or microelectrodes in rodents. Am J Physiol Heart Circ Physiol. 2001;280:H2533–H2544. doi: 10.1152/ajpheart.2001.280.6.H2533. [DOI] [PubMed] [Google Scholar]
- 40.Brahimi-Horn M.C., Pouysségur J. Oxygen, a source of life and stress. FEBS Lett. 2007;581:3582–3591. doi: 10.1016/j.febslet.2007.06.018. [DOI] [PubMed] [Google Scholar]
- 41.Aoi N., Yoshimura K., Kadono T., Nakagami G., Iizuka S., Higashino T., Araki J., Koshima I., Sanada H. Ultrasound assessment of deep tissue injury in pressure ulcers: possible prediction of pressure ulcer progression. Plast Reconstr Surg. 2009;124:540–550. doi: 10.1097/PRS.0b013e3181addb33. [DOI] [PubMed] [Google Scholar]
- 42.Eppley B.L., Woodell J.E., Higgins J. Platelet quantification and growth factor analysis from platelet-rich plasma: implications for wound healing. Plast Reconstr Surg. 2004;114:1502–1508. doi: 10.1097/01.prs.0000138251.07040.51. [DOI] [PubMed] [Google Scholar]
Associated Data
This section collects any data citations, data availability statements, or supplementary materials included in this article.
Supplementary Materials
Flow cytometric analysis of primary isolated hASCs (n = 3) and HUVECs (n = 3). In fluorescence-activated cell sorting plots, solid gray histograms represent cells stained with the fluorescent-conjugated antibody of interest, and solid red lines represent cells stained with fluorescent-conjugated isotype control antibody. None of the hASCs expressed CD31, vWF, Flk-1, or CD117, which were expressed by HUVECs, whereas all of the hASCs expressed CD90, which was not expressed by HUVECs, suggesting the absence of contamination of vascular ECs in the ASC population.
Inverted microscopic images of hASCs and HUVECs cultured with or without AIC for 5 days. Scale bars = 200 μm.
The effects of each growth factor included in AIC on proliferation and network formation of hASCs. A: The proliferative effect of each single factor on hASCs was examined using BrdU incorporation assays (n = 3).*P < 0.05. B: Effect of each single factor on network formation by hASCs (n = 3). *P < 0.05. Error bars represent SEM.
Dose-dependent effects of AIC on migration and network formation of hASCs and HUVECs. A: Effects of the concentrated AIC medium (10× AIC) and diluted AIC media (0.1×, 0.01×, and 0.001× AIC) on migration of hASCs (n = 4) and HUVECs (n = 4). “0×” indicates control medium (no AIC). *P < 0.05. B: Effects of the concentrated AIC medium (10× AIC) and diluted AIC media (0.1×, 0.01×, and 0.001× AIC) on network formation by hASCs (n = 3) and HUVECs (n = 3). *P < 0.05. NS, not significant. Error bars represent SEM.
Immunohistochemical analysis of networks formed by hASCs and HUVECs. Most HUVECs on Matrigel were positive for CD31 (green) regardless of AIC pretreatment. A small number of AIC-treated ASCs were positive for CD31 (green), whereas none of the control hASCs were positive for CD31. All nuclei were stained with Hoechst 33342 (blue). Scale bars = 50 μm.
The Matrigel co-culture system of AIC-treated hASCs and HUVECs. A: AIC-treated hASCs were labeled with DiO (green) and seeded with DiI-labeled HUVECs (red). Scale bars = 200 μm. B: AIC-treated and DiO-labeled hASCs (green) and unlabeled HUVECs. The networks were immunostained for vWF (red). Scale bar = 100 μm.
AIC effects on nonischemic adipose tissue. A:pO2 of the inguinal adipose pad (n = 10). To investigate the in vivo effects of AIC on nonischemic subcutaneous adipose tissue, AIC or vehicle was injected into the inguinal subcutaneous adipose pad of mice. At 1 week, the AIC-treated adipose tissue showed a higher pO2 value than did the vehicle-treated control, but there was no significant difference between the two groups at 2 or 4 weeks. *P < 0.05. B: Whole-mount histologic analysis of the adipose tissue. Harvested living tissue samples were stained with BODIPY (adipocytes; green), lectin (ECs; red), and Hoechst 33342 (nuclei; blue). An increased number of infiltrating nucleated cells and lectin-positive cells were observed in the interstitial spaces between adipocytes at 1 week in both groups, and they seemed to decrease in number earlier in the AIC-treated group than in controls. Scale bars = 50 μm. C: Quantification of capillary density (n = 10). Paraffin-embedded tissue was stained with lectin (ECs; red) and Hoechst 33342 (nuclei; blue). A significantly increased number of capillaries compared with the control were observed in AIC-treated adipose tissue at 1, 2, and 4 weeks. Scale bars = 100 μm. *P < 0.05; **P < 0.01. Error bars represent SEM.
Microscopic images of ischemic and nonischemic murine adipose tissues after administration of AIC or vehicle. Each section was stained with CD31 (red) and Hoechst 33342 (blue). A: Nonischemic adipose tissue. B: Surgically induced ischemic adipose tissue. C: Chronically ischemic adipose tissue of diabetic mice. In all cases, AIC treatment increased the number of CD31-positive vascular structures. Inflammatory cells infiltrating interstitial spaces and around dead adipocytes were also stained with CD31, especially in the surgically induced ischemia model. Scale bars = 100 μm.