

Abstract
Substantial evidence implicates the ubiquitin-conjugating enzyme E2C (UBE2C) gene, in several human cancers, including colorectal carcinoma (CRC). We therefore investigated the prognostic value of UBE2C alterations in CRC and UBE2C signaling in CRC cell lines. UBE2C protein expression and UBE2C gene copy number were evaluated on clinical samples by immunohistochemistry and fluorescence in situ hybridization in a TMA format. The effect of the proteasome inhibitor bortezomib and small-interfering RNA knockdown was assessed by apoptotic assays and immunoblotting. UBE2C dysregulation was associated with proliferative marker Ki-67, accumulation of cyclin A and B1, and a poor overall survival. UBE2C expression was an independent prognostic marker in early-stage (I and II) CRC. UBE2C depletion resulted in suppression of cellular growth and accumulation of cyclin A and B1. In vitro, bortezomib treatment of CRC cells caused inhibition of cell viability via down-regulation of UBE2C. UBE2C knockdown by bortezomib or transfection with specific small-interfering RNA against UBE2C also caused cells to be arrested at the G2/M level, leading to accumulation of cyclin A and cyclin B1. In vivo, a significant reduction in tumor volume and weight was noted in mice treated with a combination of subtoxic doses of oxaliplatin and bortezomib compared with treatment with oxaliplatin or bortezomib alone. Altogether, our results suggest that UBE2C and the ubiquitin-proteasome pathway may be potential targets for therapeutic intervention in CRC.
Although colorectal cancer (CRC) is a major cause of mortality and morbidity worldwide, various therapeutic modalities followed in clinical practice are not life saving. More recently, advances in understanding of tumor biology have led to the development of targeted therapies,1 allowing progress in the treatment of CRC.2
The ubiquitin proteasome system is important for the orchestration of several important cell cycle events, such as proteolysis of cyclin-dependent kinase and their inhibitors.3,4 Proper cell cycle progression is orchestrated by the controlled oscillation of a series of cell cycle events. Deregulation of appropriate cell cycle control often results in chromosomal instability, which is a potential trigger for the initiation of cancer.5 In this system, substrate molecules are regulated for degradation by ubiquitin-activating enzyme (E1), ubiquitin-conjugating enzyme (E2), and E3 ligase. The ubiquitin-conjugating enzyme E2C (UBE2C), also known as UBCH10, along with the E3 ligase of the anaphase-promoting complex catalyze the ubiquitination of mitotic cyclins A and B1, as well as securin.3,6 UBE2C is essential for cell cycle progression, and mutation of its active site cysteine confers a dominant-negative phenotype.3,6 Overexpression of UBE2C at the mRNA level has been reported in a number of cancer cell lines and primary tumors, whereas only low levels were found in normal tissues.7 The oncogenic role of UBE2C is also reported in thyroid,8 ovarian,9 esophageal,10 breast,11 lung,12 liver,13 and brain14 tumors. Takahashi et al15 suggest that overexpression of UBE2C may play an important role in advanced colon cancer with liver metastases and that this overexpression may be a result of chromosomal amplification at the UBE2C locus, 20q13.1.
Considering the ubiquitous expression of UBE2C in various cancers,8–13 it may be beneficial to target UBE2C in these cancers by specific inhibitors. In a recent study16 using CRC cell lines, depletion of UBE2C resulted in suppression of cellular growth, whereas overexpression of UBE2C promoted cell proliferation and oncogenic cellular growth. Although no specific UBE2C inhibitors are currently available for clinical use, proteasome inhibitors form a novel class of chemotherapeutic agents that lead to cell cycle arrest and cell death. Bortezomib is a specific reversible inhibitor of proteasome function that is crucial for protein degradation17 and has been approved by the US Food and Drug Administration for therapy for multiple myeloma.18 Earlier studies by other groups, including our laboratory, have shown that SCF-SKP2 ubiquitin proteasome pathway alterations in tumors is a ubiquitous phenomenon and is present in various tumors, such as CRC, ovarian carcinomas, and diffuse large B-cell lymphomas.19–21 Bortezomib is a potential therapeutic agent in a subset of such tumors that show dysregulation in SCF-SKP2 ubiquitin proteasome pathway.19,22
However, to date no experimental evidence exists as to whether bortezomib can be used in CRC that expresses alteration in UBE2C. Therefore, in this study, we first investigated the role of UBE2C dysregulation in Middle Eastern patients with CRC. To elucidate the utility of UBE2C as a potential therapeutic target, we studied the efficacy of the proteasome inhibitor bortezomib and small-interfering (siRNA) knockdown of the UBE2C gene to induce cell cycle arrest and apoptosis in CRC cells by in vivo and in vitro analysis.
Materials and Methods
Patient Selection and TMA Construction
A total of 448 patients with CRC diagnosed between 1990 and 2006 were selected from King Faisal Specialist Hospital and Research Centre. Samples from all 448 CRC, 24 adenoma, and 229 adjacent normal colorectal mucosa patients were analyzed in a TMA format as described previously.23 Clinical and histopathologic data were available for all these patients. Colorectal Unit, Department of Surgery, provided long-term follow-up data. Two pathologists (P.B., K.S.A-K.) reviewed all tumors for grade and histologic subtype. The institutional review board of the King Faisal Specialist Hospital and Research Centre approved the study.
Immunohistochemistry
TMA slides were processed and stained manually as described earlier. Primary antibodies used and their dilutions are listed in Supplemental Table S1 (available at http://ajp.amjpathol.org). UBE2C expression was categorized by assigning an H score.24 Each TMA spot was assigned an intensity score from 0 to 3 (I0, I1–3), and the proportion of the tumor staining for that intensity was recorded as 5% increments from a range of 0 to 100 (P0, P1–3). A final H score (range, 0 to 300) was obtained by adding the sum of scores obtained for each intensity and proportion of area stained. X-tile plots were constructed for assessment of biomarker and optimization of cutoff points based on outcome as has been described earlier.25–27 CRCs were grouped into two groups based on X-tile plots: one with complete absence or reduced staining (H score = 0 to 40) and the other with UBE2C expression (H score >110), depending on the H score. Similarly, X-tile plots were used to stratify the CRC cases into two groups for cyclin A and cyclin B1. Two pathologists (P.B. and K.S.A.) performed all immunohistochemistry (IHC) scoring independently and blindly.
FISH
Fluorescence in situ hybridization (FISH) analysis was performed on 4-μm TMA sections for the detection of UBE2C copy number changes as previously reported.28 For the study of UBE2C amplification, we used the bacterial artificial chromosome clone RP3-447F3, from Children's Hospital Oakland Research Institute (Oakland, CA). A UBE2C/centromere 20 ratio of 1.0 was considered normal, a ratio between 1.0 and 2.0 was considered as having UBE2C gains, and a ratio of >2.0 was considered as amplified. A minimum of 20 cells with both the centromeric and UBE2C gene signals were scored to give conclusive data.
Statistical Analysis
The JMP8 (SAS Institute Inc., Cary, NC) software package was used for data analyses. Survival curves were generated using the Kaplan-Meier method, with significance evaluated using the Mantel-Cox log-rank test. Risk ratio was calculated using the Cox proportional hazard model in both univariate and multivariate analyses. χ2 tests were used to examine the relationship among nominal variables. The limit of significance for all analyses was defined as P = 0.05.
Cell Culture
CRC cell lines Colo-320, HCT-15, and SW-480 were cultured as described previously.21 Cell lines were cultured in RPMI 1640 medium supplemented with 10% (vol/vol) fetal bovine serum, 100 U/mL of penicillin, and 100 U/mL of streptomycin at 37°C in humidified atmosphere containing 5% CO2. All experiments were performed in RPMI 1640 containing 5% serum.
Cell Cycle Analysis and Annexin V Staining
Colo-320 cell line was treated with different agents and siRNA as described in the figure legends. For cell cycle analysis, cells were washed once with PBS and resuspended in 500 μL of hypotonic staining buffer and analyzed by flow cytometry as described previously.19 For detection of apoptosis, cells were harvested and percentage apoptosis was measured by flow cytometry after staining with fluorescein-conjugated annexin V and propidium iodide (PI) (Molecular Probes, Eugene, OR).
Gene Silencing Using UBE2C siRNA
UBE2C siRNA and scrambled control siRNA (Dharmacon, Lafayette, CO) transfected into cell lines by using LipofectAMINE 2000 reagent (Invitrogen, Carlsbad, CA) according to the manufacturer's instructions as described previously.29
Real-Time RT-PCR
Total RNA was extracted and reverse transcribed, and real-time PCR was performed using the LightCycler 2.0 instrument (Roche, Mannheim, Germany) and the LighterCycler FastStart DNA Master SYBR Green I kit (Roche) as described previously.30 The primer pair used for UBE2C was forward 5′-CTGCCGAGCTCTGGAAAAAC-3′ and reverse 5′-AGGAAAAATTAAAAAGACGACACAAG-3′. The glyceraldehyde-3-phosphate dehydrogenase (GAPDH) gene was used as the internal control. The forward primer of GAPDH was 5′-CGGGAAGCTTGTCATCAATGG-3′, and the reverse primer of GAPDH was 5′-CATGGTTCACACCCATGACG-3′. A standard curve was generated with series of dilutions from a reference cDNA converted from total RNA using the Superscript II kit. PCR amplification consisted of 50 cycles (95°C for 10 seconds, 61°C for 10 seconds, and 72°C for 15 seconds) after the initial denaturation step (95°C for 10 minutes). Expression levels of the UBE2C gene was based on the amount of the target message relative to the GAPDH control to normalize the initial input of total RNA.
MTT Assay
Cell viability was assessed with the MTT assay. All experiments using UBE2C and scrambled control siRNA were performed in triplicate. Cells were allowed to grow for 24, 48, and 72 hours. Cell viability was determined by MTT assays, as previously described.29
In Vivo Tumor Xenograft Studies
Six-week-old nude mice were obtained from Jackson Laboratories (Bar Harbor, ME) and maintained in a pathogen-free animal facility at least one week before use. All animal studies were performed in accordance with institutional guidelines as described previously.29 For xenograft study, mice were inoculated subcutaneously into the right abdominal quadrant with 5 million Colo-320 cells in 200 μL of PBS. After 1 week, mice were randomly assigned to four groups: bortezomib (0.5 mg/kg), oxaliplatin (5 mg/kg), a combination of bortezomib and oxaliplatin, or 0.9% saline (vehicle). Bortezomib (Velcade) was a gift from Millennium Pharmaceuticals, Inc. Treatment with bortezomib and oxaliplatin was given intraperitoneally twice weekly. The control group received the vehicle alone at the same schedule. The body weight of each mouse was monitored weekly, and tumor volume was measured as described previously.19 After 4 weeks of treatment, mice were sacrificed and individual tumors were snap-frozen in liquid nitrogen for storage. Cell lysates were prepared from each tumor, and Western blot assays were performed to determine the status of various proteins.
Results
UBE2C Expression, Gene Amplification, and Colorectal Carcinogenesis
UBE2C expression was significantly higher in both colorectal adenomas (96.82 ± 40.52; P = 0.0015) and carcinoma (109.37 ± 59.65; P < 0.0001; Figure 1, A, B, and E) compared with normal colorectal mucosa (64.80 ± 37.40). However, there was no difference in expression between colorectal adenomas and carcinoma (P = 0.1839; Figure 1E). The mean copy number of the UBE2C gene was significantly higher in both colorectal adenomas (2.86 ± 1.39; P = 0.0223) and carcinoma (3.26 ± 2.47; P < 0.0001) compared with normal colorectal mucosa (2.10 ± 0.50; Figure 1, C, D, and F). There was no difference in UBE2C copy number in CRC compared with colorectal adenoma (P = 0.2320). These findings suggest that dysregulation in the UBE2C pathway is an early event in colorectal carcinogenesis.
Figure 1.

TMA-based IHC analysis of UBE2C in normal colonic mucosa (A) and CRC (B). UBE2C FISH analysis shows normal copy number in normal colonic mucosa (C) and UBE2C gene amplification in CRC (D). A progressive increase in IHC expression levels (E) is seen along with increases in UBE2C gene copy number (F) in normal colonic mucosa, adenomas, and CRCs (20×/0.70 objective on an Olympus BX 51 microscope; Olympus America Inc, Center Valley, PA; with the inset showing a 40×/0.85 aperture magnified view of the same for Figure 1, A, B, and C). Tissue samples were classified with a UBE2C/centromere 20 ratio of 1.0 as normal, between 1.0 and 2.0 as having UBE2C gains, and >2.0 as amplified. A minimum of 20 cells with both the centromeric and UBE2C gene signals were scored to give conclusive data. Box plot charts indicate the mean and SD of UBE2C IHC expression in 3 groups: adjacent normal colorectal mucosa, adenomas, and CRCs. With the use of Student's t-test, the expression of UBE2C in colorectal adenomas (96.82 ± 40.52) and CRCs (109.37 ± 59.65) was significantly higher than normal colon (64.80 ± 37.41; P = 0.0015 and P < 0.0001, respectively) (E). Similarly, the UBE2C gene copy number in colorectal adenomas (2.86 ± 1.39) and CRCs (3.26 ± 2.47) was significantly higher than normal colon (2.10 ± 0.50; P = 0.0223 and P < 0.0001, respectively) (F).
UBE2C Expression, Gene Amplification, and Association with Clinicopathologic Parameters
UBE2C expression was observed in 161 (45.9%) of 351 of the CRC samples (Table 1). The incidences of UBE2C gene amplification, gain, and normal samples were 30.7% (114/371), 6.9% (22/317), and 63.4% (235/371), respectively (Table 2). Gene amplification in a few representative normal and tumor samples was validated by quantitative real-time PCR assay as described previously (see Supplemental Figure S1 at http://ajp.amjpathol.org). Good correlation was observed between amplification by FISH and quantitative real-time PCR. Similarly, there was concordance between gene copy number and protein expression in >55.0% of the tumor samples analyzed: 52 CRC samples (16.7%) showed UBE2C amplification and high protein expression, whereas 122 CRC samples (38.4%) showed normal UBE2C copy number and low protein expression status. As indicated in Table 2, UBE2C amplification was associated with histologic subtype of adenocarcinomas (P = 0.0181) and presence of distant metastasis (pM1; P = 0.0487). UBE2C IHC expression was associated with cyclin A (P = 0.0161) and cyclin B1 (P = 0.0022; Figure 2), and a trend of high UBE2C expression was seen in CRC from the descending colon (P = 0.0801). UBE2C expression was not associated with patient age, patient sex, tumor histologic type, tumor grade, and AJCC stage (Table 1).
Table 1.
Correlation of UBE2C Copy Number with Clinicopathologic Parameters in CRC
| Total no. (%) | High UBE2C, no. (%) | Low UBE2C, no. (%) | P value | |
|---|---|---|---|---|
| Total no. of cases | 351 | 161 (45.9) | 190 (54.1) | |
| Age | ||||
| ≤50 years | 115 (32.8) | 54 (47.0) | 61 (53.0) | 0.7754 |
| >50 years | 236 (67.2) | 107 (45.3) | 129 (54.7) | |
| Sex | ||||
| Male | 170 (48.4) | 78 (45.9) | 92 (54.1) | 0.9961 |
| Female | 181 (51.6) | 83 (45.9) | 98 (54.1) | |
| Tumor site | ||||
| Descending colon | 292 (83.2) | 140 (48.0) | 152 (52.0) | 0.0801 |
| Ascending colon | 59 (16.8) | 21 (35.6) | 38 (64.4) | |
| Histologic type | ||||
| Adenocarcinoma | 305 (86.9) | 145 (47.5) | 160 (52.5) | 0.1024 |
| Mucinous carcinoma | 46 (13.1) | 16 (34.8) | 30 (65.2) | |
| Tumor stage | ||||
| I | 44 (13.2) | 23 (52.3) | 21 (47.7) | 0.3240 |
| II | 112 (33.5) | 44 (39.3) | 68 (60.7) | |
| III | 137 (41.0) | 68 (49.6) | 69 (50.4) | |
| IV | 41 (12.3) | 19 (46.3) | 22 (53.7) | |
| Differentiation | ||||
| Well | 27 (7.7) | 9 (33.3) | 18 (66.7) | 0.3523 |
| Moderate | 261 (74.4) | 124 (47.5) | 137 (52.5) | |
| Poor | 63 (17.9) | 28 (44.4) | 35 (55.6) | |
| Cyclin A⁎ | ||||
| High expression | 276 (81.2) | 136 (49.3) | 140 (50.7) | 0.0161 |
| Low expression | 64 (18.8) | 21 (32.8) | 43 (67.2) | |
| Cyclin B1⁎ | ||||
| High expression | 298 (87.4) | 149 (50.0) | 149 (50.0) | 0.0022 |
| Low expression | 43 (12.6) | 11 (25.6) | 32 (74.4) | |
| Ki-67⁎ | ||||
| High expression | 293 (85.9) | 141 (48.1) | 152 (51.9) | 0.0541 |
| Low expression | 48 (14.1) | 16 (33.3) | 32 (66.7) | |
| 5-year overall survival, % | 52.9 | 70.5 | 0.0267 |
Analysis failure of some IHC markers was attributed to missing or nonrepresentative spots.
Table 2.
Correlation of UBE2C Copy Number with Clinicopathologic Parameters in CRC
| Total no. (%) | Amplified, no (%)⁎ | Nonamplified, no. (%) | P value | |
|---|---|---|---|---|
| Total no. of cases | 371 | 114 (30.7) | 257 (69.3) | |
| Age | ||||
| ≤50 years | 130 (35.0) | 40 (30.8) | 90 (69.2) | 0.9899 |
| >50 years | 241 (65.0) | 74 (30.7) | 167 (69.3) | |
| Sex | ||||
| Male | 176 (47.4) | 50 (28.4) | 126 (71.6) | 0.3573 |
| Female | 195 (52.6) | 64 (32.8) | 131 (67.2) | |
| Tumor site | ||||
| Descending colon | 309 (83.3) | 97 (31.4) | 212 (68.6) | 0.5326 |
| Ascending colon | 62 (16.7) | 17 (27.4) | 45 (72.6) | |
| Histologic type | ||||
| Adenocarcinoma | 315 (84.9) | 104 (33.0) | 211 (67.0) | 0.0181 |
| Mucinous carcinoma | 56 (15.1) | 10 (17.9) | 46 (82.1) | |
| Tumor stage | ||||
| I | 55 (15.6) | 20 (36.4) | 35 (63.6) | 0.0838 |
| II | 116 | 28 (24.0) | 88 (76.0) | |
| III | 135 (38.4) | 40 (29.6) | 95 (70.4) | |
| IV | 46 (13.1) | 20 (43.5) | 26 (56.5) | |
| Differentiation | ||||
| Well | 32 (8.6) | 11 (34.4) | 21 (65.6) | 0.5864 |
| Moderate | 266 (71.7) | 84 (3.6) | 182 (68.4) | |
| Poor | 73 (19.7) | 19 (26.0) | 54 (74.0) | |
| Cyclin A† | ||||
| High expression | 273 (81.0) | 89 (32.6) | 184 (67.4) | 0.2299 |
| Low expression | 64 (19.0) | 16 (25.0) | 48 (75.0) | |
| Cyclin B1† | ||||
| High expression | 290 (85.5) | 98 (33.8) | 195 (66.2) | 0.0037 |
| Low expression | 49 (14.5) | 7 (14.3) | 42 (85.7) | |
| Ki-67† | ||||
| High expression | 297 (85.3) | 101 (34.0) | 196 (66.0) | 0.0152 |
| Low expression | 51 (14.7) | 9 (17.6) | 42 (82.4) | |
| 5-year overall survival, % | 65.2 | 70.9 | 0.4190 |
UBE2C amplified: tissue samples were classified with a UBE2C centromere 20 ratio of 1.0 as normal, between 1.0 and 2.0 as having UBE2C gains, and of >2.0 as amplified.
Analysis failure of some IHC markers was attributed to missing or nonrepresentative spots.
Figure 2.

TMA-based IHC analysis of UBE2C, cyclin A, and cyclin B1 in CRC patients. A CRC array spot showing overexpression of UBE2C (A), cyclin A (C), and cyclin B1 (E). In contrast, another CRC tissue array spot showing low expression of UBE2C (B), cyclin A (D), and cyclin B1 (F) (20×/0.70 objective on an Olympus BX 51 microscope; Olympus America Inc, Center Valley, PA; with the inset showing a 40×/0.85 aperture magnified view of the same).
UBE2C Alteration and Its Association with Clinicopathologic Parameters
Because UBE2C amplifications were seen to commonly overlap with UBE2C protein expression, we have combined these two groups to study the associations of UBE2C alterations with clinicopathologic features. A CRC case was defined to have a UBE2C alteration if it had UBE2C gene amplification by FISH and/or UBE2C protein overexpression by IHC. Data for both UBE2C expression by IHC and UBE2C gene copy number by FISH were available in 317 cases, and the incidence of UBE2C alteration was 61.5% (195/317). As indicated in Table 3, UBE2C alterations were directly associated with expression of key cell cycle regulatory proteins: cyclin A (P = 0.0175), cyclin B1 (P = 0.0026), and proliferative marker Ki-67 (P = 0.0023). Although no association was seen with UBE2C alterations and patient age (P = 0.6187), patient sex (P = 0.6893), tumor site (P = 0.3263), and tumor differentiation (P = 0.2979), we observed a significant association with histologic subtype of adenocarcinomas (P = 0.0122).
Table 3.
Correlation of UBE2C Alteration with Clinicopathologic Parameters in CRC
| Total no. (%) | UBE2C alterations, no. (%)⁎ | No UBE2C alterations, no. (%) | P value | |
|---|---|---|---|---|
| Total no. of cases | 317 | 195 (61.5) | 122 (38.5) | |
| Age | ||||
| ≤50 years | 109 (34.4) | 65 (59.6) | 44 (40.4) | 0.6187 |
| >50 years | 208 (65.6) | 130 (62.5) | 78 (37.5) | |
| Sex | ||||
| Male | 150 (47.3) | 94 (62.7) | 56 (37.3) | 0.6893 |
| Female | 167 (52.7) | 101 (60.5) | 66 (39.5) | |
| Tumor site | ||||
| Descending colon | 263 (83.0) | 165 (62.7) | 98 (37.3) | 0.3263 |
| Ascending colon | 54 (17.0) | 30 (55.6) | 24 (44.4) | |
| Histologic type | ||||
| Adenocarcinoma | 272 (85.8) | 175 (64.3) | 97 (36.7) | 0.0122 |
| Mucinous carcinoma | 45 (14.2) | 20 (44.4) | 25 (55.6) | |
| Tumor stage | ||||
| I | 39 (13.0) | 25 (64.1) | 14 (35.9) | 0.1049 |
| II | 99 (33.0) | 52 (52.5) | 47 (47.5) | |
| III | 125 (41.7) | 81 (64.8) | 44 (35.2) | |
| IV | 37 (12.3) | 27 (73.0) | 10 (27.0) | |
| Differentiation | ||||
| Well | 25 (7.9) | 13 (52.0) | 12 (48.0) | 0.2979 |
| Moderate | 231 (72.9) | 148 (64.1) | 83 (35.9) | |
| Poor | 61 (19.2) | 34 (55.7) | 27 (44.3) | |
| Cyclin A† | ||||
| >5 | 252 (82.1) | 163 (64.7) | 89 (35.3) | 0.0175 |
| ≤5 | 55 (17.9) | 26 (47.3) | 29 (52.7) | |
| Cyclin B1† | ||||
| >5 | 270 (87.7) | 176 (64.2) | 94 (34.8) | 0.0026 |
| ≤5 | 38 (12.3) | 15 (39.5) | 23 (60.5) | |
| Ki-67† | ||||
| >50 | 266 (85.8) | 174 (65.4) | 92 (34.6) | 0.0023 |
| ≤50 | 44 (14.2) | 18 (40.9) | 26 (59.1) | |
| 5-Year overall survival | 0.0348 |
UBE2C alterations: presence of either protein overexpression and/or UBE2C gene amplification in a CRC samples.
Analysis failure of some IHC markers was attributed to missing or nonrepresentative spots.
Prognostic Significance of UBE2C in CRC
CRC with UBE2C expression also showed a poor 5-year overall survival of 52.9% compared with 70.5% with low UBE2C expression (P = 0.0267; Figure 3A). Similarly, the CRC subset with UBE2C alterations (UBE2C protein expression or UBE2C amplification) showed a significantly poor overall survival of 59.7% compared with 75.2% in CRC tumors with no UBE2C alterations (P = 0.0348; Figure 3B). However, UBE2C gene amplification did not show any prognostic significance (P = 0.4190). In a multivariate analysis with patient age, patient sex, AJCC stage, tumor grade, and microsatellite instability status, both UBE2C expression and UBE2C alterations failed to remain significant and thus were not independent prognostic markers. We further investigated the prognostic significance of UBE2C expression in the CRC subgroup with early-stage (I and II; Figure 3C) and late-stage (III and IV; Figure 3D) disease. Although UBE2C IHC expression was not significant in the stage III and IV subgroup (P = 0.4892), patients with stage I and II CRC overexpression of UBE2C (n = 89) had a reduced overall survival of 83.2% at 5 years compared with 89.3% in those with reduced UBE2C expression (n = 67; P = 0.0254). In a multivariate analysis with patient age, patient rex, tumor grade, and microsatellite instability status in the stage I and II subgroup, the relative risk was 3.67 for UBE2C overexpression (95% CI, 1.15 to 14.03; Table 4) Thus, UBE2C expression was an independent prognostic marker in early-stage (I and II) CRC in Middle Eastern patients. To avoid bias because of some patients with stage II disease receiving adjuvant therapy, we reanalyzed this cohort by stratifying the stage I and II cases according to treatment modalities. Of these 156 stage I and II cases, some form of adjuvant therapy was given in 52 patients (33.3%), only surgical resection was performed in 74 patients (47.4%), and treatment details were unknown in 30 patients (19.2%). In the CRC subgroup of patients with stage I and II disease treated only by surgical resection alone, overexpression of UBE2C had a reduced overall survival of 88.1% at 5 years compared with 100% with reduced UBE2C expression (P = 0.0618). Thus, UBE2C overexpression retained its prognostic significance (a statistical trend was noted) in this small cohort of 74 patients (data not shown).
Figure 3.

Prognostic significance of UBE2C in CRC and Kaplan-Meier survival analysis. A: CRC patients with overexpression of UBE2C had a reduced overall survival of 52.9% at 5 years compared with 70.5% with reduced UBE2C expression (n = 190; P = 0.0267). B: CRC patients showing UBE2C alterations showed a reduced overall survival of 59.7% compared with 75.2% CRC tumors with no UBE2C alterations (P = 0.0348). C: In the group with early-stage (I and II) disease, CRC patients with overexpression of UBE2C (n = 89) had a reduced overall survival of 83.2% at 5 years compared with 89.3% with reduced UBE2C expression (n = 67; P = 0.0254). D: UBE2C expression was not associated with any difference in overall survival (P = 0.4892) in the CRC subgroup with advanced-stage (III and IV) disease.
Table 4.
Cox Regression Analysis for Overall Survival in the CRC Subset with Stage I and II Tumors
| Clinical parameters | Univariate |
Multivariate |
||
|---|---|---|---|---|
| Risk ratio (95% CI) | P value | Risk ratio (95% CI) | P value | |
| Age ≥50 years | 1.17 (0.80 –1.74) | 0.4306 | 1.37 (0.36 –6.62) | 0.6550 |
| Male sex | 1.10 (0.76 –1.59) | 0.6084 | 1.32 (0.41 –4.47) | 0.6379 |
| Grade 3 tumor (poorly differentiated) | 1.41 (0.90 –2.14) | 0.1307 | 0.78 (0.04 –4.77) | 0.8199 |
| MSI-S/L (stable/low) | 2.04 (1.14 –4.05) | 0.0149 | 2.78 (0.51 –52.0) | 0.2770 |
| UBE2C overexpression | 3.35 (1.13 –11.1) | 0.0291 | 3.67 (1.15 –14.03) | 0.0276 |
CI, confidence interval; MSI, microsatellite instability status; S/L, stable/low [ie, not MSI-H (high)].
Suppression of the UBE2C Synthesis Inhibits CRC Cell Growth
We sought to determine whether UBE2C overexpression had a role in the process of CRC carcinogenesis. We analyzed a panel of CRC cell lines for the expression of UBE2C by immunoblotting. As shown in Figure 4A, an appreciable level of UBE2C expression was seen in most of CRC cell lines, with Colo-320 expressing a high level of UBE2C. Next, we examined the expression of UBE2C, cyclin A, and cyclin B1 after transfection with UBE2C-specific siRNA. Colo-320 cells were transfected with either scrambled or UBE2C siRNA as described earlier.31 As shown in Figure 4B, after transfection of UBE2C siRNA, we observed an efficient knockdown of the UBE2C protein. In addition, knockdown of UBE2C in CRC cells accumulated cyclin A and cyclin B1. We further analyzed the growth rate of Colo-320 in the presence and absence of UBE2C siRNA. Our data showed that growth of Colo-320 cells was significantly reduced in cells treated with UBE2C siRNA compared with scrambled control siRNA (Figure 4C). Finally, we examined whether siRNA knockdown of UBE2C induced apoptosis in CRC cells. As shown in Figure 4D (upper panel), there was an increase in the subG1/Apo fraction of cells in Colo-320 cells transfected with UBE2C siRNA compared with scrambled siRNA. When these cells were stained by annexin V/PI and analyzed by flow cytometry, apoptosis was confirmed, with an increase in population of cells in the right upper quadrant depicting apoptotic cells (Figure 4D, lower panel). These data demonstrate that UBE2C play an important role in the CRC cell viability.
Figure 4.

UBE2C expression in human CRC cell lines. A: HCT-15, HCT-116, HT-29, Colo-320, and SW-480 cell lines were lysed and Western blot analysis was performed using UBE2C, and β-actin was used as the loading control (upper panel). Spot densitometry analysis of UBE2C band was performed with the α imager software (San Leandro, CA). The data of each UBE2C band were normalized with β-actin (lower panel). B: Effect of UBE2C siRNA on cyclin A and cyclin B1 accumulation. After transfection of UBE2C si-RNA for 48 hours, cells were lysed and immunoblotted with antibodies against UBE2C, cyclin A, cyclin B, and β-actin. C: Depletion of UBE2C protein synthesis by UBE2C siRNA inhibits cell proliferation of CRC cells. Colo-320 cell were transfected either with UBE2C specific or scrambled siRNA, and cell proliferation was determined by the MTT assay. The reduction of cell proliferation in Colo-320 cells treated with siRNA against UBE2C demonstrated a maximal decrease in 24 hours and 48 hours compared with control cells. D: Down-regulation of UBE2C expression by siRNA induces apoptosis in CRC cells. Colo-320 cells were transfected with either scrambled siRNA or siRNA targeted against UBE2C for 48 hours, and cells were either stained with PI and cell cycle was determined by FACS analysis (upper panel) or stained with annexin V/PI and apoptosis was assessed by flow cytometry (lower panel).
Bortezomib Mediated Accumulation of Cyclin A and Cyclin B1 via Degradation of UBE2C in Vitro and in Vivo
It has been shown that treatment of UBE2C-overexpressing esophageal adenocarcinoma cells with proteasome inhibitor showed a significant decrease in cell proliferation.10 Furthermore, depletion of UBE2C resulted in accumulation of cyclin A and B1.32 We, therefore, sought to determine whether treatment of CRC cells with bortezomib modulates the accumulation of cyclins in CRC cells. Colo-320 cells were treated with bortezomib, 50 nmol/L and 100 nmol/L, for 48 hours. Cells were lysed and proteins were separated on SDS–polyacrylamide gel electrophoresis (PAGE) and immunoblotted with UBE2C, cyclin A, cyclin B1, and β-actin antibodies as indicated. Treatment of Colo-320 cells at a concentration of 100 nmol/L bortezomib down-regulated the expression of UBE2C at the protein and the mRNA levels (Figure 5A; see Supplemental Figure S2 at http://ajp.amjpathol.org), consequently leading to stabilization/up-regulation of cyclin A and cyclin B1. To assess whether up-regulation of cyclin B1 and cyclin A is dose dependent or time dependent, we first treated Colo-320 cells with various doses of bortezomib for 48 hours and assessed the expression of cyclin B1 and cyclin A by immunoblotting. As shown in Figure 5B, there was a dose-dependent increase in expression of cyclin B1 and cyclin A after treatment with bortezomib. In addition, we also found that cyclin B1 and cyclin A up-regulation was time dependent (Figure 5C). These data were further confirmed using another proteasome inhibitor, MG-132, that showed down-regulation of UBE2C, consequently leading to up-regulation of cyclin B1 and cyclin A in CRC (Figure 5D). In addition, MG-132 also inhibited cell viability in these cells (data not shown). These results suggest that MG-132 has similar effects as bortezomib in CRC cells.
Figure 5.
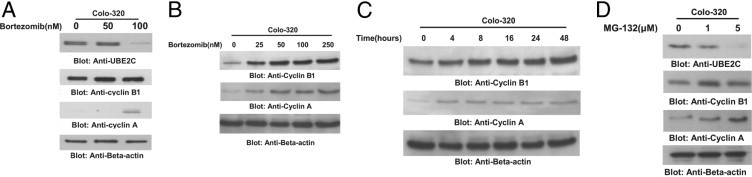
Bortezomib mediated accumulation of cyclin A and cyclin B1 via degradation of UBE2C in vitro and in vivo. A: Bortezomib treatment down-regulated expression of UBE2C protein and increased levels of cyclin A and cyclin B. Colo-320 cells were treated with and without 50 and 100 nmol/L of bortezomib for 48 hours. After cell lysis, equal amounts of proteins were separated by SDS-PAGE, transferred to immobilon membrane, and immunoblotted with antibodies against UBE2C, cyclin A, cyclin B, and β-actin as indicated. Bortezomib treatment causes up-regulation of cyclins B1 and A in a dose-dependent (B) and time-dependent (C) manner. Colo-320 cells were either treated with various doses of bortezomib for 48 hours or treated with 100 nmol/L bortezomib for indicated periods. Proteins were isolated and immunoblotted with antibodies against cyclin B1, cyclin A, and β-actin. D: Colo-320 cells were treated with 1 and 5 μmol/L MG-132 for 48 hours. Cells were harvested and proteins were separated on SDS-PAGE and immunoblotted with antibodies against UBE2C, cyclin B1, cyclin A, and β-actin. One of three independent experiments is depicted in the Figure.
Down-Regulation of UBE2C Sensitizes CRC Cells to Bortezomib- and Oxaliplatin-Induced Apoptosis
We have shown that down-regulation of UBE2C after transfection with specific siRNA (100 nmol/L) leads to apoptosis; however, we were also interested to see whether suppression of UBE2C expression with lower doses of siRNA could sensitize CRC cells to bortezomib- or oxaliplatin-induced apoptosis. For these reasons, we transfected Colo-320 cells with either scrambled siRNA (50 nmol/L) or siRNA targeted against UBE2C (50 nmol/L) for 48 hours. After transfection, Colo-320 cells were treated with either 25 nmol/L bortezomib or 500 nmol/L oxaliplatin for 48 hours and cells were analyzed by flow cytometry for apoptosis. As shown in Supplemental Figure S3A (available at http://ajp.amjpathol.org), there was an increase in SubG1/Apo population of cells that were transfected with siRNA against UBE2C followed by treatment with either bortezomib or oxaliplatin compared with cells that were mock transfected with scrambled siRNA. These data were further confirmed by annexin V/PI dual staining that showed an increase in apoptotic cells as depicted by cells in the upper right quadrant in UBE2C siRNA transfected cells after treatment with either bortezomib or oxaliplatin (see Supplemental Figure S3B at http://ajp.amjpathol.org). These results suggest that UBE2C plays an important role in prevention of bortezomib- and oxaliplatin-induced apoptosis in CRC cells.
In Vivo Experiments Confirm Role of UBE2C in CRC Pathogenesis
We have previously shown that bortezomib significantly inhibits tumor volume and weight in CRC xenografts at 1 mg/kg.19 Because our in vitro data showed that bortezomib treatment down-regulated UBE2C and subsequently induced the expression of cyclin A and cyclin B1 in the Colo-320 cell line, we tested whether proteasome inhibition in vivo altered the expression of these proteins. We therefore analyzed the UBE2C and cyclin levels in primary tumors derived from vehicle-treated mice and mice treated with bortezomib using Western blot analysis and RT-PCR. The level of UBE2C was markedly decreased in mice treated with bortezomib at the protein and mRNA levels compared with vehicle-treated mice (Figure 6A; see Supplemental Figure S4 at http://ajp.amjpathol.org). Furthermore, bortezomib treatment also up-regulated the expression of cyclin A and B mRNA level in bortezomib-treated Colo-320 xenografts (data not shown). These data clearly demonstrate that bortezomib inhibits UBE2C and stabilizes cyclin A and cyclin B1 in vitro and in vivo both at the transcriptional and translational levels. Finally, we sought to determine whether down-regulation of UBE2C by bortezomib treatment sensitized CRC xenografts to chemotherapeutic agents. Nude mice were inoculated with Colo-320 cells, and then we divided the animals into four groups: i) oxaliplatin (5 mg/kg), ii) bortezomib (0.5 mg/kg), iii) combination of oxaliplatin and bortezomib, and iv) 0.9% normal saline (vehicle) treated twice weekly for 4 weeks. After 4 weeks, the animals were sacrificed and tumor volume and weight were measured. As shown in Figure 6B, the tumor volume regressed significantly in animals that were treated with a combination of subtoxic doses of oxaliplatin and bortezomib and reached statistical significance after 4 weeks of treatment (P < 0.05). The tumor weight was found to be significantly decreased in mice treated with a combination of oxaliplatin and bortezomib compared with the other groups (P < 0.05) (Figure 6C). In addition, regression of xenograft tumor size was seen after necropsy, which clearly indicated that the combination of oxaliplatin and bortezomib resulted in significant shrinkage of tumors size compared with the other groups (Figure 6D).
Figure 6.

A: Whole cell homogenates of individual tumor from bortezomib- and vehicle-treated mice were prepared, and Western blot analyses were performed using UBE2C, cyclin A, cyclin B1, and β-actin antibodies as indicated. Combination of oxaliplatin and bortezomib treatment causes regression of tumor volume and weight in Colo-320 xenografts. Colo-320 xenografts were treated with either oxaliplatin (5 mg/kg) or bortezomib (0.5 mg/kg) alone or a combination of oxaliplatin and bortezomib for 4 weeks. B: The tumor volume was measured weekly and plotted as a graph. *P < 0.05 (statistically significant). C: After 4 weeks treatment, the mice were sacrificed and the tumor weight was measured and plotted as a bar graph. *P < 0.05 (statistically significant). D: Representative tumor images of postnecropsy mice treated with vehicle, oxaliplatin, bortezomib, and a combination of oxaliplatin and bortezomib. Overlay images, ×10 magnification.
Discussion
UBE2C is a cell cycle–related protein involved in mitosis completion via cyclins and proteasome pathways.33 In the present study, dysregulation of UBE2C was investigated at the gene copy number, protein, and transcriptional RNA expression level in CRC, and we investigated the clinical utility of UBE2C enzyme as a potential target for therapy.
UBE2C dysregulation was seen in a large percentage of CRCs (in 45.9% at the protein level and 30.7% at the gene copy number), and UBE2C alteration was seen in 61.5% of the CRC cases. Both UBE2C protein expression and UBE2C gene amplification occur relatively early in the progression from adenoma to carcinoma, with significantly higher expression levels of UBE2C protein and UBE2C gene copy number in adenoma compared with normal mucosa. This is in agreement with earlier studies in which UBE2C expression was significantly higher in a wide variety of cancer from colon, esophagus, ovary, breast, and lung compared with their healthy counterparts.12,16 Lin et al10 demonstrated a higher expression of UBE2C at the protein and mRNA levels in esophageal carcinoma and dysplastic lesions compared with metaplastic lesions. In concordance with earlier studies, UBE2C gene amplification was associated with distant metastasis (pM1),15 and UBE2C alteration was significantly associated with Ki-67 (a proliferative marker), accumulation of cyclin A and B1, and a poor overall survival.16 UBE2C expression was associated with a poor overall survival in all CRC patients, and, interestingly, in the early-stage CRC subgroup, UBE2C expression was an independent prognostic marker. Thus, these findings show the potential of targeting UBE2C enzyme in early-stage CRC and in preneoplastic adenomatous lesions.
We performed various in vitro and in vivo assays to demonstrate the oncogenic role of UBE2C and the effect of modulating UBE2C expression by gene silencing and with the proteasome inhibitor bortezomib. The function of the UBE2C gene product is closely linked to cell cycle progression and the destruction of mitotic cyclins. Rape et al32,34 showed that the decision between cyclin A degradation and anaphase-promoting complex inactivation is determined by UBE2C availability. Our study demonstrated that siRNA-mediated suppression of UBE2C expression inhibited the growth rate of CRC cells with accumulation of cyclins A and B1, which was consistent with earlier reports.13,16 Interestingly, we found that down-regulation of UBE2C expression caused inhibition of cell viability by arresting cells in the G2/M phase followed by induction of apoptosis in CRC cells. UBE2C expression in CRC cell lines was found to be inversely associated with cyclin A and B1 in concordance with the mechanistic model of UBE2C function. However, in the CRC TMA cohort, UBE2C expression showed a paradoxical direct association with cyclin A/B1. Although we do not fully understand this mechanism, we hypothesize that IHC analysis is probably sensitive enough to detect UBE2C only when it accumulates to specific threshold just before the G2/M phase, where the expression of cyclin A and B1 is also high. This subset of CRC cells is a snapshot of a evolving cell cycle event and represents the fraction of tumor cell population, which if followed in vivo would result in degradation of cyclin A/B1. Similar paradoxical direct associations between UBE2C and cyclin B1 have been reported in lymphomas.33
Although no specific UBE2C inhibitors are currently available for clinical use, Lin et al10 have shown that treatment of esophageal adenocarcinoma cells with MG-262, a proteasome inhibitor, caused a significant down-regulation of UBE2C accompanied by inhibition in cell proliferation and accumulation of cyclin A and B1. We have recently shown that bortezomib, another proteasome inhibitor, suppressed the growth and reduced cell viability in a number of cancer cells both in vitro and in vivo.19–21 Our data clearly demonstrate that bortezomib treatment of CRC cells caused down-regulation of UBE2C, leading to accumulation of cyclin A and cyclin B1. Similarly, bortezomib treatment of CRC cell xenografts in mice inhibited UBE2C with bortezomib and stabilized cyclin A and B1. These findings are in agreement with an earlier study in which esophageal adenocarcinoma cells strongly expressing UbcH10 were highly sensitive to treatment with the proteasome inhibitor MG-262.10 Results of previous bortezomib clinical trials either alone or in combination (oxaliplatin, leucovorin, and 5-fluorouracil with fluorouracil/leucovorin or irinotecan) in the setting of advanced CRC are not encouraging.35–37 However, using bortezomib in combination with other biological agents through an understanding of its effects on different signaling pathways may prove more fruitful.22,38 Our current study highlights the importance of using bortezomib to target a subgroup of CRC with aberrant UBE2C activity that lead to dysregulation of tumor growth, and this subset of patients may show positive response to bortezomib treatment. It would be interesting to do a detailed comprehensive molecular characterization of the CRC tumors that responded and failed to respond to bortezomib in the earlier trials.
Altogether our results establish UBE2C as a key molecule in colorectal carcinogenesis and identify a subgroup of CRC patients with high UBE2C alterations showing a poor overall survival. We have also shown for the first time, to our knowledge, the efficacy of bortezomib in inhibiting UBE2C expression at the protein and mRNA levels and stabilization of cyclin A and B1. In addition, our animal xenograft study showed that there was a statistically significant synergistic regression of tumor volume and weight in mice treated with a combination of subtoxic doses of bortezomib and oxaliplatin. These studies may have important implications for future preclinical and clinical studies aimed at determining the usefulness of a novel strategy for treating CRC with inhibitors of proteasome pathways, either alone or in combination with other agents.
Acknowledgments
We thank Thara George, Hassan Al Dossarie for technical assistance and Zeeshan Qadri for data analysis.
Footnotes
Supported by King Abdulaziz City for Science and Technology and the National Comprehensive Plan for Science and Technology.
P.B., S.U., and M.A. contributed equally to this work.
Supplemental material for this article can be found at http://ajp.amjpathol.org or at doi:10.1016/j.ajpath.2011.01.034.
Supplemental data
Bar diagram showing validation of FISH by real-time PCR in a few representative samples. CRC samples with increased copy numbers by FISH of the UBE2C gene were selected for validation by quantitative real-time PCR. DNA content was normalized to that of long interspersed elements (LINE1), a repetitive element for which copy numbers per haploid genome are similar in both normal DNA samples and neoplastic cells. Primers were designed by Primer express 3.0 software (Applied Biosystems, Foster City, CA) and hybridized to sequences of genomic DNA for UBE2C and LINE1. Primers to genomic sequences were UBE2C forward: 5′-GAG AAG TTG AGT CGG GCA AG, UBE2C reverse: 5′-ACG ATC CTA GCG AGT CCT CA, LINE1 forward: 5′-CCG CTC AAC TAC ATG GAA ACT G -3′, and LINE1 reverse: 5′-GCG TCC CAG AGA TTC TGG TAT G.
Co1o-320 cells were treated with 50 nmol/L and 100 nmol/L bortezomib for 48 hours, respectively. Cells were collected and total RNA was isolated. After cDNA synthesis, real-time PCR was performed and relative expression levels of UBE2C were determined as described in Materials and Methods. *P = 0.02 (statistically significant).
Down-regulation of UBE2C expression by siRNA synergizes CRC cells to oxiliplatin- and bortezomib-induced apoptosis. Colo-320 cells were transfected with either scrambled siRNA or siRNA targeted against UBE2C for 48 hours, and cells were then treated with 500 nmol/L oxiliplatin or 25 nmol/L bortezomib for 48 hours. After treatment, cells were either stained with PI and cell cycle was determined by FACS analysis (A) or stained with annexin V/PI and apoptosis was assessed by flow cytometry (B).
Bortezomib down-regulated mRNA expression of UBE2C in in vivo nude mice xenografts. RNA was extracted from vehicle- and bortezomib-treated tumors. After cDNA synthesis, RT-PCR was performed for UBE2C and GAPDH expression as described in Materials and Methods. *P <0.01 (statistically significant).
References
- 1.Khamly K., Jefford M., Michael M., Zalcberg J. Beyond 5-fluorouracil: new horizons in systemic therapy for advanced colorectal cancer. Expert Opin Investig Drugs. 2005;14:607–628. doi: 10.1517/13543784.14.6.607. [DOI] [PubMed] [Google Scholar]
- 2.Hurwitz H.I., Fehrenbacher L., Hainsworth J.D., Heim W., Berlin J., Holmgren E., Hambleton J., Novotny W.F., Kabbinavar F. Bevacizumab in combination with fluorouracil and leucovorin: an active regimen for first-line metastatic colorectal cancer. J Clin Oncol. 2005;23:3502–3508. doi: 10.1200/JCO.2005.10.017. [DOI] [PubMed] [Google Scholar]
- 3.Pagano M. Cell cycle regulation by the ubiquitin pathway. FASEB J. 1997;11:1067–1075. doi: 10.1096/fasebj.11.13.9367342. [DOI] [PubMed] [Google Scholar]
- 4.Weissman A.M. Themes and variations on ubiquitylation. Nat Rev Mol Cell Biol. 2001;2:169–178. doi: 10.1038/35056563. [DOI] [PubMed] [Google Scholar]
- 5.Yamasaki L., Pagano M. Cell cycle, proteolysis and cancer. Curr Opin Cell Biol. 2004;16:623–628. doi: 10.1016/j.ceb.2004.08.005. [DOI] [PubMed] [Google Scholar]
- 6.Townsley F.M., Aristarkhov A., Beck S., Hershko A., Ruderman J.V. Dominant-negative cyclin-selective ubiquitin carrier protein E2-C/UbcH10 blocks cells in metaphase. Proc Natl Acad Sci U S A. 1997;94:2362–2367. doi: 10.1073/pnas.94.6.2362. [DOI] [PMC free article] [PubMed] [Google Scholar]
- 7.Okamoto Y., Ozaki T., Miyazaki K., Aoyama M., Miyazaki M., Nakagawara A. UbcH10 is the cancer-related E2 ubiquitin-conjugating enzyme. Cancer Res. 2003;63:4167–4173. [PubMed] [Google Scholar]
- 8.Pallante P., Berlingieri M.T., Troncone G., Kruhoffer M., Orntoft T.F., Viglietto G., Caleo A., Migliaccio I., Decaussin-Petrucci M., Santoro M., Palombini L., Fusco A. UbcH10 overexpression may represent a marker of anaplastic thyroid carcinomas. Br J Cancer. 2005;93:464–471. doi: 10.1038/sj.bjc.6602721. [DOI] [PMC free article] [PubMed] [Google Scholar]
- 9.Berlingieri M.T., Pallante P., Guida M., Nappi C., Masciullo V., Scambia G., Ferraro A., Leone V., Sboner A., Barbareschi M., Ferro A., Troncone G., Fusco A. UbcH10 expression may be a useful tool in the prognosis of ovarian carcinomas. Oncogene. 2007;26:2136–2140. doi: 10.1038/sj.onc.1210010. [DOI] [PubMed] [Google Scholar]
- 10.Lin J., Raoof D.A., Wang Z., Lin M.Y., Thomas D.G., Greenson J.K., Giordano T.J., Orringer M.B., Chang A.C., Beer D.G., Lin L. Expression and effect of inhibition of the ubiquitin-conjugating enzyme E2C on esophageal adenocarcinoma. Neoplasia. 2006;8:1062–1071. doi: 10.1593/neo.05832. [DOI] [PMC free article] [PubMed] [Google Scholar]
- 11.Berlingieri M.T., Pallante P., Sboner A., Barbareschi M., Bianco M., Ferraro A., Mansueto G., Borbone E., Guerriero E., Troncone G., Fusco A. UbcH10 is overexpressed in malignant breast carcinomas. Eur J Cancer. 2007;43:2729–2735. doi: 10.1016/j.ejca.2007.09.003. [DOI] [PubMed] [Google Scholar]
- 12.Wagner K.W., Sapinoso L.M., El-Rifai W., Frierson H.F., Butz N., Mestan J., Hofmann F., Deveraux Q.L., Hampton G.M. Overexpression, genomic amplification and therapeutic potential of inhibiting the UbcH10 ubiquitin conjugase in human carcinomas of diverse anatomic origin. Oncogene. 2004;23:6621–6629. doi: 10.1038/sj.onc.1207861. [DOI] [PubMed] [Google Scholar]
- 13.Ieta K., Ojima E., Tanaka F., Nakamura Y., Haraguchi N., Mimori K., Inoue H., Kuwano H., Mori M. Identification of overexpressed genes in hepatocellular carcinoma, with special reference to ubiquitin-conjugating enzyme E2C gene expression. Int J Cancer. 2007;121:33–38. doi: 10.1002/ijc.22605. [DOI] [PubMed] [Google Scholar]
- 14.Donato G., Iofrida G., Lavano A., Volpentesta G., Signorelli F., Pallante P.L., Berlingieri M.T., Pierantoni M.G., Palmieri D., Conforti F., Maltese L., Tucci L., Amorosi A., Fusco A. Analysis of UbcH10 expression represents a useful tool for the diagnosis and therapy of astrocytic tumors. Clin Neuropathol. 2008;27:219–223. doi: 10.5414/npp27219. [DOI] [PubMed] [Google Scholar]
- 15.Takahashi Y., Ishii Y., Nishida Y., Ikarashi M., Nagata T., Nakamura T., Yamamori S., Asai S. Detection of aberrations of ubiquitin-conjugating enzyme E2C gene (UBE2C) in advanced colon cancer with liver metastases by DNA microarray and two-color FISH. Cancer Genet Cytogenet. 2006;168:30–35. doi: 10.1016/j.cancergencyto.2005.12.011. [DOI] [PubMed] [Google Scholar]
- 16.Fujita T., Ikeda H., Taira N., Hatoh S., Naito M., Doihara H. Overexpression of UbcH10 alternates the cell cycle profile and accelerate the tumor proliferation in colon cancer. BMC Cancer. 2009;9:87. doi: 10.1186/1471-2407-9-87. [DOI] [PMC free article] [PubMed] [Google Scholar]
- 17.Nandi D., Tahiliani P., Kumar A., Chandu D. The ubiquitin-proteasome system. J Biosci. 2006;31:137–155. doi: 10.1007/BF02705243. [DOI] [PubMed] [Google Scholar]
- 18.Joazeiro C.A., Anderson K.C., Hunter T. Proteasome inhibitor drugs on the rise. Cancer Res. 2006;66:7840–7842. doi: 10.1158/0008-5472.CAN-06-2033. [DOI] [PubMed] [Google Scholar]
- 19.Uddin S., Ahmed M., Bavi P., El-Sayed R., Al-Sanea N., AbdulJabbar A., Ashari L.H., Alhomoud S., Al-Dayel F., Hussain A.R., Al-Kuraya K.S. Bortezomib (Velcade) induces p27Kip1 expression through S-phase kinase protein 2 degradation in colorectal cancer. Cancer Res. 2008;68:3379–3388. doi: 10.1158/0008-5472.CAN-07-6109. [DOI] [PubMed] [Google Scholar]
- 20.Uddin S., Ahmed M., Hussain A.R., Jehan Z., Al-Dayel F., Munkarah A., Bavi P., Al-Kuraya K.S. Bortezomib-mediated expression of p27Kip1 through S-phase kinase protein 2 degradation in epithelial ovarian cancer. Lab Invest. 2009;89:1115–1127. doi: 10.1038/labinvest.2009.75. [DOI] [PubMed] [Google Scholar]
- 21.Uddin S., Hussain A., Ahmed M., Belgaumi A., Al-Dayel F., Ajarim D., Bavi P., Al-Kuraya K.S. S-phase kinase protein 2 is an attractive therapeutic target in a subset of diffuse large B-cell lymphoma. J Pathol. 2008;216:483–494. doi: 10.1002/path.2433. [DOI] [PubMed] [Google Scholar]
- 22.Shanker A., Brooks A.D., Tristan C.A., Wine J.W., Elliott P.J., Yagita H., Takeda K., Smyth M.J., Murphy W.J., Sayers T.J. Treating metastatic solid tumors with bortezomib and a tumor necrosis factor-related apoptosis-inducing ligand receptor agonist antibody. J Natl Cancer Inst. 2008;100:649–662. doi: 10.1093/jnci/djn113. [DOI] [PMC free article] [PubMed] [Google Scholar]
- 23.Bavi P., Abubaker J., Hussain A., Sultana M., Al-Dayel F., Uddin S., Al-Kuraya K.S. Reduced or absent cyclin H expression is an independent prognostic marker for poor outcome in diffuse large B-cell lymphoma. Hum Pathol. 2008;39:885–894. doi: 10.1016/j.humpath.2007.10.014. [DOI] [PubMed] [Google Scholar]
- 24.McCarty K.S., Jr., Miller L.S., Cox E.B., Konrath J., McCarty K.S., Sr Estrogen receptor analyses: Correlation of biochemical and immunohistochemical methods using monoclonal antireceptor antibodies. Arch Pathol Lab Med. 1985;109:716–721. [PubMed] [Google Scholar]
- 25.Badve S., Turbin D., Thorat M.A., Morimiya A., Nielsen T.O., Perou C.M., Dunn S., Huntsman D.G., Nakshatri H. FOXA1 expression in breast cancer–correlation with luminal subtype A and survival. Clin Cancer Res. 2007;13:4415–4421. doi: 10.1158/1078-0432.CCR-07-0122. [DOI] [PubMed] [Google Scholar]
- 26.Camp R.L., Dolled-Filhart M., Rimm D.L. X-tile: a new bio-informatics tool for biomarker assessment and outcome-based cut-point optimization. Clin Cancer Res. 2004;10:7252–7259. doi: 10.1158/1078-0432.CCR-04-0713. [DOI] [PubMed] [Google Scholar]
- 27.Abubaker J., Bavi P., Al-Haqawi W., Sultana M., Al-Harbi S., Al-Sanea N., Abduljabbar A., Ashari L.H., Alhomoud S., Al-Dayel F., Uddin S., Al-Kuraya K.S. Prognostic significance of alterations in KRAS isoforms KRAS-4A/4B and KRAS mutations in colorectal carcinoma. J Pathol. 2009;219:435–445. doi: 10.1002/path.2625. [DOI] [PubMed] [Google Scholar]
- 28.Abubaker J., Jehan Z., Bavi P., Sultana M., Al-Harbi S., Ibrahim M., Al-Nuaim A., Ahmed M., Amin T., Al-Fehaily M., Al-Sanea O., Al-Dayel F., Uddin S., Al-Kuraya K.S. Clinicopathological analysis of papillary thyroid cancer with PIK3CA alterations in a Middle Eastern population. J Clin Endocrinol Metab. 2008;93:611–618. doi: 10.1210/jc.2007-1717. [DOI] [PubMed] [Google Scholar]
- 29.Uddin S., Hussain A.R., Ahmed M., Abubaker J., Al-Sanea N., Abduljabbar A., Ashari L.H., Alhomoud S., Al-Dayel F., Bavi P., Al-Kuraya K.S. High prevalence of fatty acid synthase expression in colorectal cancers in Middle Eastern patients and its potential role as a therapeutic target. Am J Gastroenterol. 2009;104:1790–1801. doi: 10.1038/ajg.2009.230. [DOI] [PubMed] [Google Scholar]
- 30.Jehan Z., Bavi P., Sultana M., Abubaker J., Bu R., Hussain A., Alsbeih G., Al-Sanea N., Abduljabbar A., Ashari L.H., Alhomoud S., Al-Dayel F., Uddin S., Al-Kuraya K.S. Frequent PIK3CA gene amplification and its clinical significance in colorectal cancer. J Pathol. 2009;219:337–346. doi: 10.1002/path.2601. [DOI] [PubMed] [Google Scholar]
- 31.Uddin S., Bavi P.P., Hussain A.R., Alsbeih G., Al-Sanea N., Abduljabbar A., Ashari L.H., Alhomoud S., Al-Dayel F., Ahmed M., Al-Kuraya K.S. Leptin receptor expression in Middle Eastern colorectal cancer and its potential clinical implication. Carcinogenesis. 2009;30:1832–1840. doi: 10.1093/carcin/bgp145. [DOI] [PubMed] [Google Scholar]
- 32.Rape M., Kirschner M.W. Autonomous regulation of the anaphase-promoting complex couples mitosis to S-phase entry. Nature. 2004;432:588–595. doi: 10.1038/nature03023. [DOI] [PubMed] [Google Scholar]
- 33.Troncone G., Guerriero E., Pallante P., Berlingieri M.T., Ferraro A., Del Vecchio L., Gorrese M., Mariotti E., Iaccarino A., Palmieri E.A., Zeppa P., Palombini L., Fusco A. UbcH10 expression in human lymphomas. Histopathology. 2009;54:731–740. doi: 10.1111/j.1365-2559.2009.03296.x. [DOI] [PubMed] [Google Scholar]
- 34.Rape M., Reddy S.K., Kirschner M.W. The processivity of multiubiquitination by the APC determines the order of substrate degradation. Cell. 2006;124:89–103. doi: 10.1016/j.cell.2005.10.032. [DOI] [PubMed] [Google Scholar]
- 35.Caponigro F., Lacombe D., Twelves C., Bauer J., Govaerts A.S., Marreaud S., Milano A., Anthoney A. An EORTC phase I study of bortezomib in combination with oxaliplatin, leucovorin and 5-fluorouracil in patients with advanced colorectal cancer. Eur J Cancer. 2009;45:48–55. doi: 10.1016/j.ejca.2008.08.011. [DOI] [PubMed] [Google Scholar]
- 36.Kozuch P.S., Rocha-Lima C.M., Dragovich T., Hochster H., O'Neil B.H., Atiq O.T., Pipas J.M., Ryan D.P., Lenz H.J. Bortezomib with or without irinotecan in relapsed or refractory colorectal cancer: results from a randomized phase II study. J Clin Oncol. 2008;26:2320–2326. doi: 10.1200/JCO.2007.14.0152. [DOI] [PubMed] [Google Scholar]
- 37.Mackay H., Hedley D., Major P., Townsley C., Mackenzie M., Vincent M., Degendorfer P., Tsao M.S., Nicklee T., Birle D., Wright J., Siu L., Moore M., Oza A. A phase II trial with pharmacodynamic endpoints of the proteasome inhibitor bortezomib in patients with metastatic colorectal cancer. Clin Cancer Res. 2005;11:5526–5533. doi: 10.1158/1078-0432.CCR-05-0081. [DOI] [PubMed] [Google Scholar]
- 38.Cascone T., Morelli M.P., Morgillo F., Kim W.Y., Rodolico G., Pepe S., Tortora G., Berrino L., Lee H.Y., Heymach J.V., Ciardiello F. Synergistic anti-proliferative and pro-apoptotic activity of combined therapy with bortezomib, a proteasome inhibitor, with anti-epidermal growth factor receptor (EGFR) drugs in human cancer cells. J Cell Physiol. 2008;216:698–707. doi: 10.1002/jcp.21444. [DOI] [PubMed] [Google Scholar]
Associated Data
This section collects any data citations, data availability statements, or supplementary materials included in this article.
Supplementary Materials
Bar diagram showing validation of FISH by real-time PCR in a few representative samples. CRC samples with increased copy numbers by FISH of the UBE2C gene were selected for validation by quantitative real-time PCR. DNA content was normalized to that of long interspersed elements (LINE1), a repetitive element for which copy numbers per haploid genome are similar in both normal DNA samples and neoplastic cells. Primers were designed by Primer express 3.0 software (Applied Biosystems, Foster City, CA) and hybridized to sequences of genomic DNA for UBE2C and LINE1. Primers to genomic sequences were UBE2C forward: 5′-GAG AAG TTG AGT CGG GCA AG, UBE2C reverse: 5′-ACG ATC CTA GCG AGT CCT CA, LINE1 forward: 5′-CCG CTC AAC TAC ATG GAA ACT G -3′, and LINE1 reverse: 5′-GCG TCC CAG AGA TTC TGG TAT G.
Co1o-320 cells were treated with 50 nmol/L and 100 nmol/L bortezomib for 48 hours, respectively. Cells were collected and total RNA was isolated. After cDNA synthesis, real-time PCR was performed and relative expression levels of UBE2C were determined as described in Materials and Methods. *P = 0.02 (statistically significant).
Down-regulation of UBE2C expression by siRNA synergizes CRC cells to oxiliplatin- and bortezomib-induced apoptosis. Colo-320 cells were transfected with either scrambled siRNA or siRNA targeted against UBE2C for 48 hours, and cells were then treated with 500 nmol/L oxiliplatin or 25 nmol/L bortezomib for 48 hours. After treatment, cells were either stained with PI and cell cycle was determined by FACS analysis (A) or stained with annexin V/PI and apoptosis was assessed by flow cytometry (B).
Bortezomib down-regulated mRNA expression of UBE2C in in vivo nude mice xenografts. RNA was extracted from vehicle- and bortezomib-treated tumors. After cDNA synthesis, RT-PCR was performed for UBE2C and GAPDH expression as described in Materials and Methods. *P <0.01 (statistically significant).