Abstract
The conventional investing technique is used most commonly for casting. Inspite of the popularity of this technique, it is very time consuming. To save time of the patient, dentist and dental laboratory technician, accelerated casting technique can be used. This study uses different bench set and different burnout temperatures and has been carried to investigate their effects on marginal fit and surface roughness. A total of 40 wax patterns were made simulating the artificial crown from the first master die and 20 rectangular wax patterns were made from the second master die. Twenty castings simulating the crown and 10 castings of rectangular plates were obtained by short protocol represented as Group A and C, similarly the remaining castings were obtained by standard protocol and represented as Group B and D. Marginal discrepancy of both Group A and B were determined by using Travelling microscope, whereas Perthometer was used for quantitative evaluation of average surface roughness of both Group C and D. Scanning electron microscope evaluated the surface roughness qualitatively for the specimens of both Groups C and D. The obtained values of Group A and C and Group C and D were subjected to statistical analysis. Qualitative analysis of Group C and D were done. Accelerated/short protocol gives similar results in terms of marginal fit and surface roughness as compared to the conventional/standard protocol and is definitely a time saving procedure.
Keywords: Marginal discrepancy, Surface roughness, Accelerated casting technique, Standard casting technique
Introduction
Casting is one of the extremely demanding process in dentistry. Virtually all the castings are done using adaptation of lost wax technique [1, 2].
The conventional/standard investing and casting procedures for dental restorations call for minimum 1 h bench set for investment, followed by one or two stage burnout procedure before casting. The whole process requires 2–4 h for completion. The main aim is to achieve proper expanded mold and desired compressive strength. The four mechanisms that play an important role are, setting expansion, hygroscopic expansion, wax pattern expansion and thermal expansion [3].
Achieving a casting with accurate fitting and less surface roughness has been one of the most difficult task, which are the important criteria to render the casting fit. Marginal fit has always been of great importance. The fit of the casting is the direct indicator of the accuracy of the casting. Surface roughness can be external or internal. Internal surface roughness or even a small nodule can indirectly result in marginal gap width, and even can limit uniform space for luting cement.
Achieving similar result in less time offers many advantages to the patient, dentist, and dental laboratory technician. Accelerated/short, nonstandard casting technique has been studied in an effort to achieve similar quality. The pattern is invested, cast, and delivered in a cost-effective and in a time saving manner.
So, this study uses different bench set and different burnout temperatures and has been carried out to investigate, their effects on marginal fit and surface roughness.
Material and Method
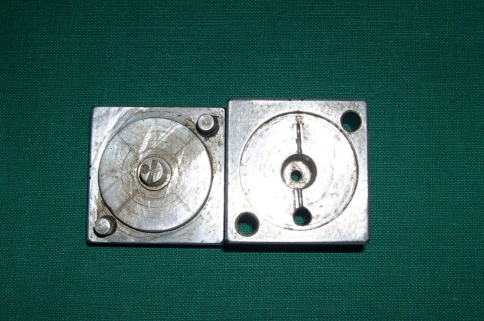
Two master dies were fabricated. First master die was fabricated with a die and a former i.e. counterpart [4, 5]. First die was divided into 3 parts (Fig. 1).The second die was made with dimensions of pattern space of length 20 mm, width 10 mm and height 2.5 mm (Fig. 2). Crown wax patterns were fabricated directly over the first master die, similarly wax patterns were fabricated in form of rectangular plates from the second die. Wax patterns were stored for 24 h in a plastic container at room temperature to allow release of internal stresses.
Fig. 1.
Master die simulating crown with former
Fig. 2.
Master die used for making rectangular wax patterns
Remargination of the crown wax patterns were done with the soft wax [6]. Each crown pattern was placed on the Travelling microscope and examined, if margins were satisfactory, then investing was carried out.
Bellavest T (Bego) investment material was used for the standard protocol, keeping liquid concentration of around 90% for optimum thermal expansion. The mold was kept for 30 min for bench set allowing its setting. The mold was kept into the furnace with gradual temperature rise at a rate of 8°C/min with holding temperature at 450°C for ½ h and then was heated to the final temperature of 950°C and then heat soaked for 30 min. The total time taken for standard protocol was 3 h [7].
Formula-I (Whip mix) investment material was used for the short protocol, liquid concentration of around 80% for optimal thermal expansion. The investing ring was kept for 15 min for bench set allowing its setting. A mold was placed in a preheated oven at the temperature of about 925°C and then was heated to the final temperature at 950°C and then heat soaked for 30 min. The total time taken for short protocol was 45 min [8]. All the castings were done with Ni–Cr base metal alloy (Wiroalloy Bego) which was molten by preheating the alloy in ceramic crucible at 950°C and then, at casting temperature of 1,340°C [9]. All the castings were cooled to the room temperature before removal from the casting ring.
All the 40 crown castings and 20 rectangular plate castings were obtained. The internal surface of crown castings were inspected with the magnifying glass and relieved of visible nodules with ¼ round carbide bur. Castings of both crowns and rectangular plates were cleaned with distilled water in an Ultrasonic Cleaner for 12 min, sprayed with an air water syringe and then dried.
Measurement of Marginal Discrepancy
Metal crowns cast following short/accelerated technique with Formula-I comprises of Group A and similarly crowns cast following standard/conventional technique with Bellavest-T comprises of Group B.
Metal rectangular plate castings following short/accelerated technique with Formula-I investment comprises of Group C and similarly rectangular plate castings following standard/conventional technique with Bellavest-T investment material comprises of Group D.
A1, A2, A3, A4 were designated as maximum discrepancy in first, second, third and fourth quadrants respectively between cervical margin of the casting and the finish line of the die of Group A.
B1, B2, B3, B4 were designated as maximum discrepancy in first, second, third and fourth quadrants respectively between cervical margin of the casting and the finish line of the die of Group B.
Each crown casting was seated on the master die under constant load of 500 g on the occlusal surface for 5 min (Hydropress). Load was removed and marginal discrepancy was measured on the Travelling microscope to the nearest of 0.01 mm at ×10 magnification on each casting (Fig. 3) at 4 predetermined sites [10]. All readings were done from a perpendicular line of view [5].
Fig. 3.
Evaluation of crown casting for marginal discrepancy under Travelling microscope
Evaluation of Surface Roughness
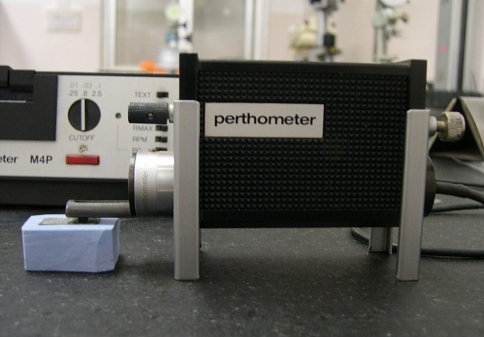
Quantitative evaluation of surface roughness was done by Perthometer (Fig. 4).
Fig. 4.
Perthometer evaluating the surface roughness of rectangular plate casting
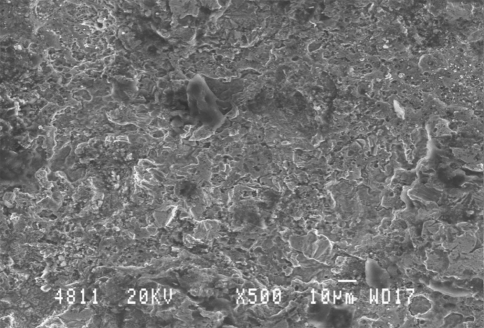
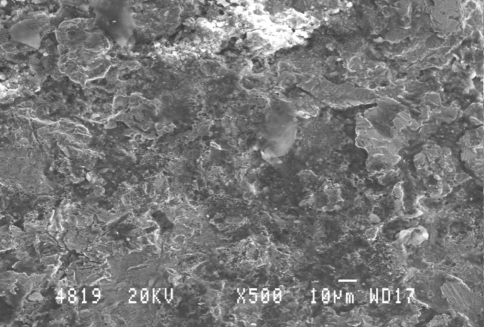
The specimen’s surface roughness was qualitatively evaluated with Scanning Electron Microscope [4, 11, 12]. The pictomicrographs were made with SEM at ×200 and ×500 magnifications (Figs. 5, 6). Measurements were obtained by selecting the 10 largest convexities or concavities [11].
Fig. 5.
Pictomicrograph showing surface roughness of Group C ×500 magnification
Fig. 6.
Pictomicrograph showing surface roughness of Group D ×500 magnification
Results
Mean and standard deviation values of marginal discrepancy (in mm) in respective quadrants of cervical margin of artificial crowns cast by short burnout protocol and standard burnout protocol were 0.044 ± 0.033 and 0.042 ± 0.032 respectively.
A Student’s t test was performed on observed values (Tables 1, 2) to compare the marginal discrepancy of all quadrants of short and standard burnout protocol of group A and group B respectively. Similarly Student’s t test was performed on observed values (Table 3) to compare the marginal discrepancy between different sites of standard and short burnout protocol. The results showed statistically non significant marginal discrepancy in and between all quadrants of standard and short burnout protocol.
Table 1.
Statistical comparison (by Student’s t test, paired) of marginal discrepancy (in mm) observed for the test specimens of Group A for all quadrants (n = 20)
| Quadrant | Mean | Std. dev. | Paired t value | P value | Significance |
|---|---|---|---|---|---|
| A1 | 0.046 | 0.036 | 0.43 | 0.6688 | NS |
| A2 | 0.041 | 0.036 | |||
| A1 | 0.046 | 0.036 | 0.46 | 0.6448 | NS |
| A3 | 0.041 | 0.038 | |||
| A1 | 0.046 | 0.036 | 0.27 | 0.7869 | NS |
| A4 | 0.049 | 0.032 | |||
| A2 | 0.041 | 0.036 | 0.04 | 0.9665 | NS |
| A3 | 0.041 | 0.038 | |||
| A2 | 0.041 | 0.036 | 0.73 | 0.4714 | NS |
| A4 | 0.049 | 0.032 | |||
| A3 | 0.041 | 0.038 | 0.76 | 0.4545 | NS |
| A4 | 0.049 | 0.032 |
Table 2.
Statistical comparison (by Student’s t test, paired) of marginal discrepancy (in mm) observed for the test specimens of Group B for all quadrants (n = 20)
| Quadrant | Mean | Std. dev. | Paired t value | P value | Significance |
|---|---|---|---|---|---|
| B1 | 0.043 | 0.027 | 0.63 | 0.5340 | NS |
| B2 | 0.038 | 0.027 | |||
| B3 | 0.039 | 0.029 | 0.50 | 0.6203 | NS |
| B1 | 0.043 | 0.027 | |||
| B4 | 0.050 | 0.038 | 0.66 | 0.5162 | NS |
| B1 | 0.043 | 0.027 | |||
| B2 | 0.038 | 0.027 | 0.11 | 0.9114 | NS |
| B3 | 0.039 | 0.029 | |||
| B2 | 0.038 | 0.027 | 1.18 | 0.2463 | NS |
| B4 | 0.050 | 0.038 | |||
| B4 | 0.050 | 0.038 | 1.06 | 0.2945 | NS |
| B3 | 0.039 | 0.029 |
Table 3.
Statistical comparison (by Student’s t test, paired) of marginal discrepancy (in mm) observed for test specimens between different sites of Group A and Group B
| Quadrant | Mean | Std. dev. | Paired t value | P value | Significance |
|---|---|---|---|---|---|
| A1 | 0.046 | 0.036 | 0.29 | 0.7730 | NS |
| B1 | 0.043 | 0.027 | |||
| A2 | 0.041 | 0.036 | 0.34 | 0.7342 | NS |
| B2 | 0.038 | 0.027 | |||
| A3 | 0.041 | 0.038 | 0.19 | 0.8528 | NS |
| B3 | 0.039 | 0.029 | |||
| A4 | 0.041 | 0.032 | 0.09 | 0.9303 | NS |
| B4 | 0.039 | 0.038 |
Mean and standard deviation of average surface roughness values of test samples cast by short (C) and standard (D) bench set and burnout protocol were 3.921 ± 0.760 and 1.980 ± 0.578 respectively.
A Student’s t test was performed on observed values (Table 4) of average surface roughness values of short (C) and standard (D) protocol and was found to be significant.
Table 4.
Statistical comparison (by Student’s t test, paired) of mean of average surface roughness (RA) values of test samples cast by short (C) and standard (D) bench set and burnout protocol
| Group | Number of specimens | Mean | Std. dev. | Paired t value | P value | Significance |
|---|---|---|---|---|---|---|
| C | 10 | 3.921 | 0.760 | 6.42 | 0.0000 | S |
| D | 10 | 1.980 | 0.578 |
Discussion
The importance of introducing the mold into the preheated oven when the investment has reached its peak temperature was emphasized by one of the authors although no scientific explanation has been offered, when the investing reaches its maximum exothermic reaction temperature, most of the chemical reaction, most of the setting expansion is considered to have completed and the investment has sufficient strength to withstand the thermal shock as quoted by Konstantoulakis et al. [4]. According to Anusavice [13], Rosenstiel [14] rapid heating results in fins and spines on the casting or a characteristic surface roughness may occur because of the flaking of the investment material when the water or steam pours into the mold. Further, steam or water may carry some of the salts used as a modifier into the mold, which are left as deposits in the walls after the water evaporation. Incomplete elimination of wax residues may occur if the heating is too short which can further affect the surface of the casting. Uneven expansion of the mold because of rapid heating can lead to marginal discrepancy of the casting [13, 14].
In the present study, nickel chrome alloy was used as a casting material instead of high noble alloys. The marginal discrepancy of crowns made by base metal alloy was found to be in accordance with the studies mentioned previously, by both conventional (standard protocol) and accelerated (short protocol) casting technique. The reason for high marginal discrepancy for base metal alloys may be higher fusion temperature. The magnitude of the dimensional change directly correlated with fusion temperature is the thermal contraction associated with the cooling of the solidified alloys. The shrinkage of alloys can occur because of, the differences in alloy compositions and plastic deformation that occurs with solidification and cooling of an alloy. The study indicates no variation in marginal discrepancy all over the periphery, whether casting was obtained by short or standard protocol, indicating there may not be uneven thermal, as well as setting expansion in investing materials used in the study.
David Duncan [6] in his study used 4 different base metal alloys and a precious alloy to study the marginal gap. The maximum mean marginal discrepancy was measured at 4 sites namely buccal, lingual, mesial and distal. In all specimens tested for base metal alloys no statistically significant difference was found between the various sites. Statistical comparison by (Student’s t test, paired) of marginal discrepancy (in mm) observed at similar quadrant of test samples in each group was found to be non significant.
Konstantoulakis et al. [4] in their study evaluated the marginal fit of complete crowns made with conventional (standard protocol) and accelerated (short protocol) casting technique by using high noble alloys. They reported very slight difference in the marginal fit between both the techniques. Four phosphate-bonded investments were used.
In the present study, no statistical difference was found for the maximum mean marginal discrepancy of the two investment materials, Bellavest T and Formula 1.
There is no explanation other than difference in the composition of investment material, which is a trade secret (not disclosed by manufacturer). The higher content of quartz versus cristobalite usually makes the investment more resistant to fracture when heated rapidly. Quartz expands at higher temperature and its rate of expansion and total expansion are lower, thus resulting in less chances of investment mold damage. Other probable reason may be the addition of metal powder to refractory powder. The metal powder increases the thermal conductivity of the refractory material, thereby improving heat transfer within the mold. With better heat transfer, there is no longer a large temperature gradient through the mold. As a result, the stresses that were caused by uneven heating of the mold are reduced, thus lowering the risk of explosive cracking. Third reason can be that accelerated schedules may take advantage of characteristic exothermal setting reaction of phosphate-bonded investment. Heat enhanced setting expansion continues uninterrupted as the mold is transferred into a preheated furnace environment for thermal expansion.
The statistical comparison of average surface roughness in (μm) between group C and D. The result suggested the existence of statistically significant.
In the study by Konstantoulakis et al. [4] in third part of the study evaluated surface roughness of castings made by conventional and accelerated technique. Three areas of each casting were analyzed by surface analyzer. No statistical difference was evaluated between conventional (standard protocol) and accelerated (short protocol).
Ronald Blackman [15] also evaluated surface roughness with rapidly prepared phosphate bonded investment. To the contrary he found crowns made with conventional schedule to have greater surface roughness as compared to accelerated schedule. The present study shows mean of 3.921 and 1.980 μm for accelerated (short protocol) and conventional (standard protocol) respectively and these surface roughness values are in accordance with the studies mentioned above. Qualitative surface topography was evaluated with photomicrographs using Scanning Electronic Microscope (SEM) for Group C (short protocol) and Group D (standard protocol) at ×200 and ×500 magnification. Group C and Group D exhibited similar photomicrographs representing of a broken surface with almost similar number of concavities and convexities at both the magnification. Interestingly the fine grained investment used in the study, namely Formula 1 did not produce casting surfaces significantly smoother than the coarse grained Bellavest T investment.
Conclusion
From the present study it could be concluded that:
Accelerated/short protocol casting technique exhibited (0.044 ± 0.033 mm) of mean maximum marginal discrepancy for Group A which was statistically non significant compared with conventional/standard casting technique which exhibited mean of (0.042 ± 0.032 mm) i.e. no superiority of one technique could be established over the other.
Accelerated technique is found to be definitely time saving procedure for the dentist and lab technician because it took 45 min for the burnout procedure, as compared to 3 h for burnout by conventional technique.
No variation in the maximum marginal discrepancy was observed in all the four quadrants for both conventional and accelerated techniques.
Significant results were obtained for surface roughness for Group C and Group D with the mean of 3.921 and 1.98 μm respectively. However these results were found within the normal limits.
References
- 1.Craig RG, Powers JM. Restorative dental materials. 11. St. Louis, USA: Mosby Inc.; 2002. [Google Scholar]
- 2.History of investment. www.google.com
- 3.Shillingburg HT. Fundamentals of fixed prosthodontics. 3. Chicago, IL: Quintessence Publication Co.; 1997. [Google Scholar]
- 4.Konstantoulakis E, Nakajima H, Woody RD, Miller AW. Marginal fit and surface roughness of crowns made with an accelerated casting technique. J Prosthet Dent. 1998;80:337–345. doi: 10.1016/S0022-3913(98)70135-0. [DOI] [PubMed] [Google Scholar]
- 5.Schilling ER, Miller BH, Woody RD, Miller AW, Nunn ME. Marginal gap of crowns made with a phosphate-bonded investment and accelerated casting method. J Prosthet Dent. 1999;81:129–134. doi: 10.1016/S0022-3913(99)70239-8. [DOI] [PubMed] [Google Scholar]
- 6.Duncan JD. The casting accuracy of nickel-chromium alloys for fixed prostheses. J Prosthet Dent. 1982;47(1):63–68. doi: 10.1016/0022-3913(82)90244-X. [DOI] [PubMed] [Google Scholar]
- 7.Product related information. Bellavest T. BEGO, Herbst GmbH, Germany. www.bego.com
- 8.Product related information, Formula-1. Whip Mix Corporation, USA. www.whipmix.com
- 9.Wiroalloy—Manufacture manual
- 10.Lacy AM, Fukui H, Jendersen MD. Three factors affecting investment setting expansion and casting size. J Prosthet Dent. 1983;49(1):52–58. doi: 10.1016/0022-3913(83)90238-X. [DOI] [PubMed] [Google Scholar]
- 11.Ogura H, Raptis CN, Asgar K. Inner surface roughness of complete cast crowns made by centrifugal casting machines. J Prosthet Dent. 1981;45(5):529–535. doi: 10.1016/0022-3913(81)90041-X. [DOI] [PubMed] [Google Scholar]
- 12.Cooney JP, Doyle TM, Caputo AA. Surface smoothness and marginal fit with phosphate-bonded investments. J Prosthet Dent. 1979;41(4):411–417. doi: 10.1016/0022-3913(79)90038-6. [DOI] [PubMed] [Google Scholar]
- 13.Anusavice KJ. Skinner’s science of dental materials. 11. Philadelphia, PA: WB Saunders; 2003. [Google Scholar]
- 14.Rosenstiel S, Land MF, Fujimoto J. Contemporary fixed prosthodontics. 3. St. Louis, USA: Mosby Inc.; 2001. [Google Scholar]
- 15.Blackman RB. Evaluation of the dimensional changes and surface roughness of gold crowns cast with rapidly prepared phosphate bonded investment: a pilot study. J Prosthet Dent. 2000;83:187–193. doi: 10.1016/S0022-3913(00)80011-6. [DOI] [PubMed] [Google Scholar]


