Abstract
Total hepatic Mg2+ content decreases by >25% in animals maintained for two weeks on Mg2+ deficient diet, and results in a >25% increase in glucose 6-phosphatase (G6Pase) activity in isolated liver microsomes in the absence of significant changed in enzyme expression. Incubation of Mg2+-deficient microsomes in the presence of 1mM external Mg2+ returned G6Pase activity to levels measured in microsomes from animals on normal Mg2+ diet. EDTA addition dynamically reversed the Mg2+ effect. The effect of Mg2+ or EDTA persisted in taurocholic acid permeabilized microsomes. An increase in G6Pase activity was also observed in liver microsomes from rats starved overnight, which presented a ~15% decrease in hepatic Mg2+ content. In this model, G6Pase activity increased to a lesser extent than in Mg2+-deficient microsomes, but it could still be dynamically modulated by addition of Mg2+ or EDTA. Our results indicate that 1) hepatic Mg2+ content rapidly decreases following starvation or exposure to deficient diet, and 2) the loss of Mg2+ stimulates G6P transport and hydrolysis as a possible compensatory mechanism to enhance intrahepatic glucose availability. The Mg2+ effect appears to take place at the level of the substrate binding site of the G6Pase enzymatic complex or the surrounding phospholipid environment.
Keywords: Mg2+; G6P, G6Pase; pyrophosphate; endoplasmic reticulum; microsomes; liver; EDTA; translocon; starvation
INTRODUCTION
Within mammalian cells, magnesium (Mg2+) is the second most abundant cation after potassium [1]. Total Mg2+ concentrations ranging between 16 to 18mM have been measured by EPXMA1 within nucleus, mitochondria and endoplasmic or sarcoplasmic reticulum [1]. In the cytoplasm, the majority of Mg2+ is in the form a complex with ATP or other phosphonucleotides (4-5mM) [2], with approximately 0.7mM as cytosolic free [Mg2+]i [1,3]. At the cellular level, approximately 180 enzymes are reported to be regulated directly or indirectly by Mg2+ [4]. This list includes adenylyl cyclase [4,5] and the majority of the enzymes involved in glycolysis and glucose homeostasis [6], among which glucose 6-phosphatase [7]. The presence of a physiological link between glucose utilization and Mg2+ homeostasis is supported by several pieces of evidence. At the physiological level, hormones like catecholamine or glucagon, which mobilize hepatic glucose into the circulation, also elicit an extrusion of Mg2+ from liver cells concomitant with glucose output [8,9]. This concomitance is further emphasized by overnight starvation of rats, which results in the depletion of hepatic glycogen and 10% to 15% decrease in hepatic Mg2+ content [9]. At the pathological level, induction of type-1 diabetes results in a time-dependent decline in hepatic Mg2+ content that parallels the inability of liver cells to properly accumulate and utilize glucose [10]. Unfortunately, technical limitations have prevented us and other laboratories from effectively relating changes in total or free Mg2+ content within the hepatocyte with concomitant variations in Mg2+ level within specific cellular compartments and changes in the activity of specific enzymes therein located.
Glucose-6-phosphatase (G6Pase, EC 3.1.3.9) enzymatic complex is predominantly expressed within the endoplasmic reticulum (ER) of liver [11], kidney [12] and pancreatic beta-cells [13]. By catalyzing the hydrolysis of glucose 6-phosphate (G6P) to glucose and phosphate (Pi) this enzyme plays a key role in regulating glucose homeostasis [14]. At the structural level, G6Pase presents nine transmembrane helices embedded in the ER membrane [15,16] and an endoluminal hydrolytic site [17]. This conformation implies the presence of a specific transport mechanism for G6P to entering the ER [15] and being hydrolyzed. Two models have been proposed for G6P transport. In the substrate-transport model, G6P enters the ER lumen via a specific transport mechanism (T1) that is distinct from the hydrolase, and represents the rate-limiting factor for the G6Pase system [14]. In the conformational flexibility substrate-transport model, instead, G6P binding occurs at a hydrophilic region of G6Pase cytoplasmic side [17]. The conformational change if this region upon G6P binding will promote substrate delivery to the intra-luminal catalytic site. According to this model, the substrate binding site and the hydrolytic site are two parts of the same G6Pase protein [17]. In both models, the release of G6P hydrolysis by-products glucose and inorganic phosphate (Pi) into the cytoplasm occurs via an additional transport mechanism for glucose [13,14,17,18] and via the glucose 6-phosphate transporter (G6PT) operating as a phosphate-linked antiporter [19]. The G6Pase system can also hydrolyze pyrophosphate (PPi) [14]. The delivery of PPi into the ER lumen occurs via a transport mechanism distinct from that involved in G6P delivery [14].
We have previously reported that an increase in cytoplasmic Mg2+ content within the hepatocyte decreases G6P hydrolysis rate [7] by acting on the G6P transport mechanism. In the present study, we report that G6Pase hydrolysis rate is increased by 30% to 40% in liver microsomes from animals maintained on Mg2+ deficient diet for 2 weeks, which present a ~24% decrease in total hepatic Mg2+ content. This change in G6P hydrolysis occurs in the absence of changes in protein expression. The G6Pase hydrolysis rate, however, can be dynamically up-regulated and down-regulated by the addition of 1mM Mg2+ and EDTA, respectively, to the extra-microsomal milieu. Qualitatively similar results were observe in liver microsomes isolated from rats starved overnight, a condition what results in 10% to 15% decrease in hepatic Mg2+ content [9]
MATERIALS AND METHODS
Materials
All chemicals were of the purest analytical grade (Sigma, St. Louis, MO). Antibodies for G6P catalytic subunit were from Santa Cruz (Santa Cruz, CA). ECL detection system was from Amersham. (GE Healthcare, Piscataway, NJ)
Mg2+ deficient Diet
Male Sprague–Dawley rats (230–250 g body weight) were maintained for 2 weeks on ad-hoc prepared Mg2+-deficient diet (Dyets, Bethlehem, PA) containing ~380 mg Mg2+ per kg of pellet food. Pared-age and weight animals were maintained for a similar period of time on a ‘normal’ Mg2+ diet containing ~507 mg of Mg2+ per kg of pellet food. All other minerals in the diet were at the same concentration. After two weeks, control and Mg2+ deficient animals were euthanized by i.p. administration of saturated sodium pentobarbital solution (60 mg/bw). Upon attainment of a deep anesthesia, the abdomen was opened and the liver excised for microsomal vesicle isolation. This and the subsequent protocol were in agreement with the NIH directives for the use and maintenance of experimental animals and was approved by the Institutional Animal Care and Utilization Committee (IACUC) at Case Western Reserve University.
Overnight Starved Animals
Male Sprague–Dawley rats (230–250 g body weight) were starved overnight by removing pellet food from their cage [9]. The following morning (~18 hour starvation) the animals were euthanized by administration of sodium pentobarbital solution and the livers excised as reported above.
Liver Microsomes Purification
The liver was rapidly rinsed in homogenization buffer, blotted on absorbing paper, and weighted. Microsomes were isolated according to the procedure of Henne and Solig [20], modified as follows. Livers were homogenized (10% w/v) in 250mM sucrose, 20mM K-Hepes (pH 7.2) in a Thomas C potter by 4 passes with a tight–fitting Teflon pestel. Homogenate was sequentially centrifuged in a JA-20 Beckman rotor at 2,500 g for 10 min to remove nuclei and cellular debris, and at 10,000 g for 10 min to remove mitochondria. The post-mitochondria supernatant was sedimented at 80,000 g for 45 min in a Ti 90 Beckman rotor. The glycogen pellet was discarded. The microsomal pellet was washed once with 100mM KCl, 5mM NaCl, 1mM KH2PO4, 10mM MOPS (pH 7.2) (incubation medium) and centrifuged at 80,000 g for 45 min. The final pellet was resuspended in the described incubation medium at a concentration of ~15mg/ml, and stored in liquid nitrogen until used.
In a separate set of experiments, microsomes from livers of Mg2+ deficient animals were resuspended and washed in the medium described above in the presence of 1mM Mg2+ before being assessed for G6Pase enzymatic activity.
G6Pase Activity
Intact microsomes or taurocholate-permeabilized microsomes were incubated at the final concentration of 400μg/ml in the cytosol-like incubation medium described above in the absence or in the presence of 1mM Mg2+ (as MgCl2), at 37°C. Hydrolytic activity was initiated by addition of varying concentrations of G6P, or PPi, and carried out for 30 min. All the substrates were dissolved in the cytosol-like buffer devoid of magnesium. Starting from time = 0 min, 1 ml aliquots of the incubation mixture were removed at 10 min intervals, and the G6Pase hydrolytic activity stopped by rapid addition of 5% TCA (final concentration). The acid mixture was sedimented at 1,500 rpm for 10 min in a refrigerated Beckman B6J centrifuge. The supernatant was removed and the amount of Pi present was measured spectrophotometrically according to the Fiske and SubbaRow assay [21] at 700nm in an Agilent 8453 spectrophotometer equipped with a computerized data acquisition program. The basal level of Pi detected at time = 0 min was subtracted from all he subsequent points of hydrolysis to obtain the net amount of G6P hydrolyzed.
For the experiments involving EDTA to chelate extra-reticular added Mg2+ to 0mM, a computational program [22] was used to determine the correct amount of chelating agent (2mM) to be added to the incubation system.
Mg2+ Determination
Immediately after isolation, aliquots of microsomes (500μg protein) were digested overnight in 10% HNO3 (final concentration). The following day, the denatured protein was sedimented at 14,000 rpm for 5 min in microfuge tubes, and the Mg2+ content of the acid extract was assessed by atomic absorbance spectrophotometry (AAS) in a Perkin-Elmer 3100 calibrated with appropriate standards. Contaminant Mg2+ present in the cytosol-like incubation buffer was also measured by AAS (ranging between 2 to 5μM) and subtracted accordingly.
Passive Mg2+ loading and Efflux Kinetics
MDM microsomes at the final concentration of 15 mg protein/ml were passively loaded at room temperature (RT) for 40 min in the presence of 2mM or 20mM MgCl2, as reported by other for passive calcium loading [23,24]. Loaded microsomes were than diluted 15-fold by transfer to Mg2+-free incubation medium, and the kinetic of efflux was measured inth absence or in the presence of 50μM 2-APB [23,24], as an inhibitor of the translocon pore [23]. At the time reported in the figure, 1mL aliquots of the incubation system were rapidly withdrawn and sedimented at 14,000 rpm for 5 min at 4°C in a refrigerated Eppendorf microcentrifuge. The supernatant was removed and the microsomal pellet digested overnight in 10% HNO3. The total amount of Mg2+ retained within the microsomes was measured by AAS upon sedimentation of the denatured protein in microfuge tubes (14,000 rpm × 5 min at 4°C).
Glucose 6-Phosphatase (G6Pase) Expression
The expression of glucose 6 phosphatase was assessed by Western Blot analysis. Briefly, equal amounts of microsomal proteins (20mg/lane) were loaded onto poly-acrylamide gradient gel, separated by SDS-PAGE, and transferred onto PVDF immobilization membrane (Schleicher & Schuell Inc. Commassie Blue and Rouge Ponceau S staining were used to confirm equal protein loading and transfer, respectively. The membranes were extensively washed with PBS, and the binding of primary antibodies against the catalytic subunit of G6Pase (Santa Cruz, Santa Cruz, CA) was visualized using peroxidase conjugated secondary antibodies and ECL western blotting detection reagents (Amersham). Protein expression was evaluated by densitometry using Scion Image program (NIH), as previously reported [25].
Protein Content
Protein content was measured according to the procedure of Lowry [26], using BSA as standard.
Statistical analysis
The data are reported as mean±SEM. Data were first analyzed by one-way ANOVA. Multiple means were then compared by Tukey's multiple comparison test performed with a q value established for statistical significance of P<0.05.
RESULTS
Alimentation of rats with Mg2+ deficient diet for 2 weeks did not affect body and liver weight of the animals as compared to rats maintained on normal Mg2+ diet (Table 1). Hepatic protein content was marginally higher (13%) in animals on normal Mg2+ diet as compared to Mg2+ deficient animals (p >0.05). Total hepatic Mg2+ content, however, was markedly decreased (minus 24%) in Mg2+ deficient animals (58.86±2.9 nmol Mg2+/mg hepatic protein, n= 6) as compared to animals on normal Mg2+ diet (77.0±3.4 nmol Mg2+/mg hepatic protein, n= 6, p<0.002). This difference persisted and was actually amplified (minus 50%) in liver microsomes purified from the two experimental groups (2.16±0.02 vs. 1.09±0.01 nmol Mg2+/mg protein, respectively, n=6p<0.001, Table 1). No appreciable differences in microsome yield and microsome-associated RNA content were observed (Table 1)
Table 1.
Body weight, and liver weight, protein content, Mg2+ content of whole liver and purified microsomal fraction of rats on normal Mg2+ or Mg2+ deficient diet for 2 weeks.
| Normal Mg2+ Diet | Mg2+-Deficient Diet | |
|---|---|---|
| Body Weight (g) | 281.2±5.8 | 278.8±6.5 |
| Liver Weight (g) | 11.4±0.8 | 10.8±1.1 |
| Hepatic protein (mg/g liver) | 107.5±4.0 | 95.2±5.1 |
| Hepatic Mg2+ (nmol/mg prot) | 77.0±3.4 | 58.9±2.9* |
| Microsomes yield (mg prot/g Eq L) | 14.8±0.2 | 15.6±0.2 |
| Microsomal RNA (mg/gEq L) | 283.5±2.3 | 284.6±1.7 |
| Microsomal Mg2+ (nmol/mg prot) | 2.16±0.02 | 1.09±0.01* |
Data are means +S.E. of 6 different preparations for each experimental group.
Statistically significant vs. corresponding values for Normal Mg2+ Diet (p<0.05).
Addition of G6P to liver microsomes results in a time- and dose-dependent hydrolysis of G6P and release of glucose and inorganic phosphate (Pi) into the incubation system [25]. Liver microsomes from animals fed Mg2+-deficient diet (MDM = Mg2+-deficient microsomes) exhibited a consistently higher (25% to 40%) G6P hydrolysis than microsomes from animals fed normal Mg2+ diet (NMM = normal Mg2+ microsomes) (Fig. 1A). This effect was observed over a range of G6P concentrations varying from 1mM to 10mM (Fig. 1A) and irrespective of the amount of microsomal protein used in the assay (Fig. 1B). Maximal hydrolysis was observed upon addition of 10mM G6P, not increasing significantly at higher G6P concentrations (20mM, not shown). Net hydrolysis at t=30min for all the concentrations of G6P tested is reported in Fig. 1C.
Figure 1. Time course and net G6P hydrolysis in the presence of varying G6P concentrations.
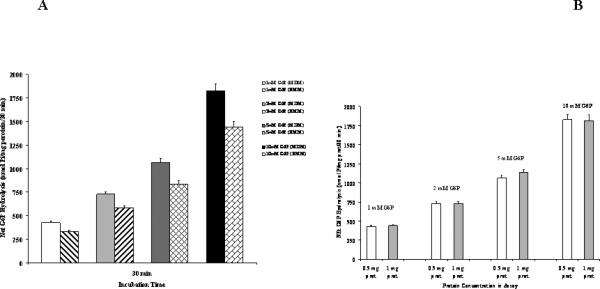
Liver microsomes were isolated from rats maintained for 2 weeks on normal (NMM) or Mg2+ deficient diet (MDM) as reported under Materials and Methods. Net hydrolysis rate (Fig. 1A) of glucose 6-phosphatase is reported as nmol Pi/mg protein for both microsomal preparations. Net hydrolysis in the presence of 1mM, 5mM, and 10mM G6P at time 30 min is reported in Fig 1A. Net G6P hydrolysis in MDM in the presence of different protein concentrations in the assay is reported in Fig. 1B. Data are means±S.E. of 6 different preparations for each condition, each tested in duplicate. *Statistically significant vs. corresponding value in NMM.
Western Blot analysis of G6Pase expression detected the presence of comparable amounts of G6Pasec in MDM and NMM (Fig. 2) excluding that the increase in G6P hydrolysis depended on an enhanced expression of G6Pase catalytic component.
Figure 2. Glucose 6-phosphatase expression in NM and MD microsomes.
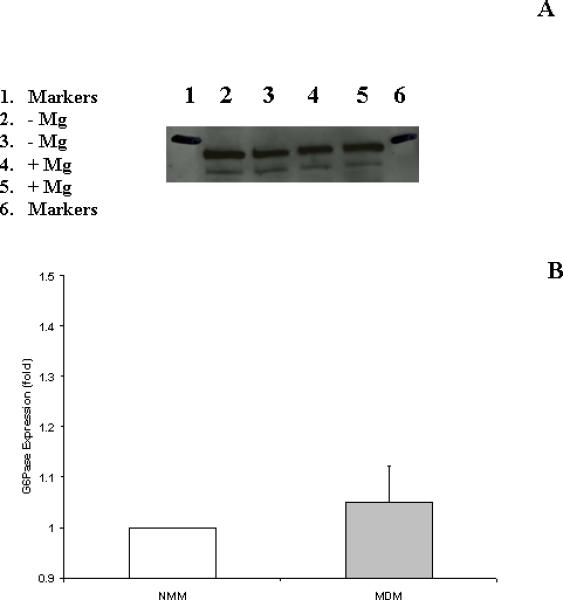
Glucose 6-phosphatase expression was assessed in NMM and MDM microsomes as reported under Materials and Methods. A typical Western blot analysis depicting 2 different preparations for each experimental condition is reported in Fig. 2A. Densitometry of 6 different preparations (means±SE), each tested in duplicate is reported in Fig. 2B. For each preparation, MDM expression was normalized using the corresponding NMM expression as 1 (or 100%).
We have previously reported that G6Pase activity in isolated hepatocytes is modulated by changes in extra-reticular (cytoplasmic) Mg2+ content [7]. Addition of 1mM Mg2+ to the extra-microsomal milieu returned G6P hydrolysis rate of MDM to values comparable to those observed in NMM (Fig. 3A). Addition of Mg2+ concentrations higher than 1mM did not further inhibit G6P hydrolysis rate (not shown). The effect of Mg2+ on G6Pase hydrolysis rate could be dynamically reverted by the addition of 1.5mM EDTA (Fig. 3A), which decreased external Mg2+ concentration to virtually 0mM [7]. When similar experiments were performed on NMM, the addition of external Mg2+ did not significantly reduced G6Pase activity in these microsomes, and the addition of EDTA slightly (10% to 14%) increased G6P hydrolysis (Fig. 3B).
Figure 3. G6P hydrolysis in the presence of extravesicular Mg2+ or Mg2+ and EDTA in MDM (Fig. 3A) and NMM (Fig. 3B).
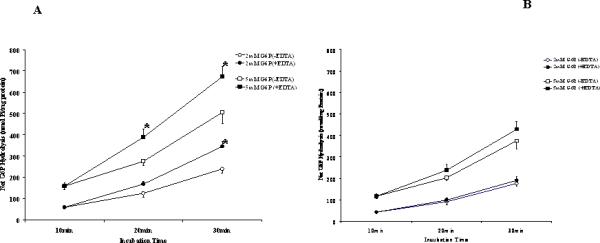
NMM and MDM were incubated at the concentration of 0.3 mg protein/ml in the presence of 1mM Mg2+. After 15 min incubation, the samples were split into two, one of which received a concentration of EDTA sufficient to chelate all external Mg2+ [21], and the incubation continued up to t = 30 min in the absence and in the presence of EDTA. Data are means±S.E. of 6 different preparations. *Statistically significant vs. the corresponding sample in the absence of EDTA.
In a separate set of experiments MDM were passively loaded with 1mM Mg2+ after isolation by incubation at room temperature for 40min, as reported by others for calcium [23,24]. This Mg2+ concentration was selected as it closely matched the difference in Mg2+ content measured in purified NMM vs. MDM microsomes (Table 1). Assessment of G6P hydrolysis rate in Mg2+ loaded MDM resulted in values qualitatively similar to those measured in purified NMM (327.81±19.87 and 852.02±46.29 nmol Pi/mg protein/30 min (n=4) in the presence of 1mM and 5mM G6P, respectively as compared to 331.13±16.56 and 840.34±42.82 nmol Pi/mg protein/30 min, respectively, in NMM as per Fig. 1)
No information is presently available about the mechanisms by which endoplasmic reticulum accumulates, retains, and releases Mg2+ under various experimental conditions. The EDTA data suggest that the effect of Mg2+ on G6P hydrolysis would take place at the substrate binding site of G6Pase. Yet, it cannot be excluded that EDTA acts as a sink for Mg2+ that has entered the microsome (ER) lumen and is in equilibrium with the external Mg2+ being chelated. To address this possibility, MDM permeabilized by exposure to 0.1% taurocholic acid for 15 min were incubated in the presence of 1mM external Mg2+. After 10min, half of the experimental sample was transferred to a new tube and Mg2+ was chelated by addition of 2mM EDTA. The result reported in Fig. 4A indicate that G6Pase activity, which was slightly decreased in the presence of Mg2+, increased by ~15% upon addition of EDTA. A similar trend was observed in taurocholic acid-treated NMM (Fig. 4B). In these microsomes, however, the amplitude of the changes induced by Mg2+ or EDTA addition was considerably smaller than that observed in MDM.
Figure 4. G6P hydrolysis in the presence of extravesicular Mg2+ or Mg2+ and EDTA in NMM (Fig. 4A) and MDM (Fig. 4B) permeabilized with taurocholic acid.
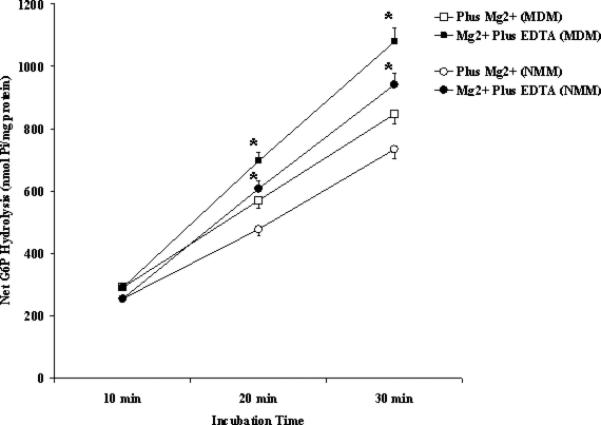
NMM and MDM were pretreated in ice for 15 min with 1% taurocholic acid. Microsomes were then incubated at the concentration of 0.3 mg protein/ml in the presence of 1mM Mg2+ or 1mM Mg2+ plus a concentration of EDTA sufficient to chelate all external Mg2+ [21] as described in the legend to Fig. 3. The incubation was carried out up to t = 30 min as indicated before. Data are means±S.E. of 6 different preparations. *Statistically significant vs. the corresponding sample in the absence of EDTA.
The possibility that Mg2+ could move across the microsomal membrane via the translocon [23] was considered. This pore is utilized by the rough ER to extrude neo-synthesized protein into the cytoplasm [23]. Experimental evidence suggests that Ca2+ can utilize this pore to leak out of the ER following inhibition of SERCA pumps by thapsigargin [23,24]. Microsomes from Mg2+ deficient animals were incubated for 40 min at room temperature in the presence of 20mM MgCl2 (i.e. a concentration comparable to that measured to be present within the ER of intact hepatocytes by EPXMA [1]) as reported by Benedetti's group [24]. The Mg2+-loaded MDD were then diluted 15-fold by transfer to Mg2+-free incubation medium, in the absence or in the presence of 50μM 2-APB, a widely used translocon inhibitor [24]. Comparison of rapid Mg2+ efflux kinetics indicates no significant differences between 2-APB treated and un-treated MDD loaded with 20mM Mg2+ (Fig. 5A). A difference in Mg2+ efflux kinetics, however, could be observed in MDM loaded with 2mM Mg2+ (Fig. 5B).
Figure 5. Mg2+ release from NMM and MDM microsomes.
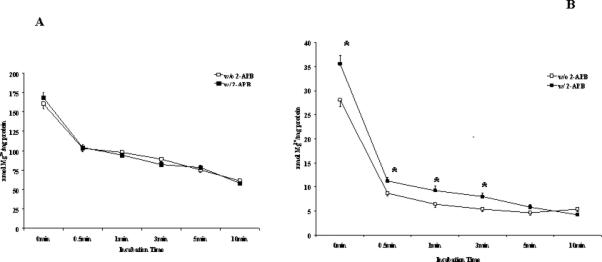
NMM and MDM microsomes were passively loaded with 20mM MgCl2 (Fig. 5A) or 2mM (Fig. 5B) for 40 min at room temperature at the final concentration of 15 mg protein ml as indicated under Materials and Methods. Microsomes were then diluted 50 fold in the incubation medium, and passive Mg2+ release from the microsomes was assessed by AAS in the presence or in the absence of 50μM 2-APB as a translocon inhibitor [23]. Data are means±S.E. of 4 experiments for each condition, each performed in duplicate. Fig. 5B: *Statistically significant vs. corresponding values in the absence of 2-APB.
As previously reported in intact hepatocytes [7], the effect of Mg2+ on G6P hydrolysis was specific, as it could not be mimicked by the addition of equivalent concentrations of other divalent cations (e.g. Ca2+, or Mn2+, not shown). Moreover, the effect of extra-microsomal Mg2+ addition was specific for G6P transport. When 1mM PPi was used as hydrolytic substrate instead of G6P, the amount of Pi generated in MDM and NMM was essentially similar irrespective of the presence or absence of 1mM Mg2+ in the incubation medium (Fig. 6).
Figure 6. PPi hydrolysis in NMM and MDM.
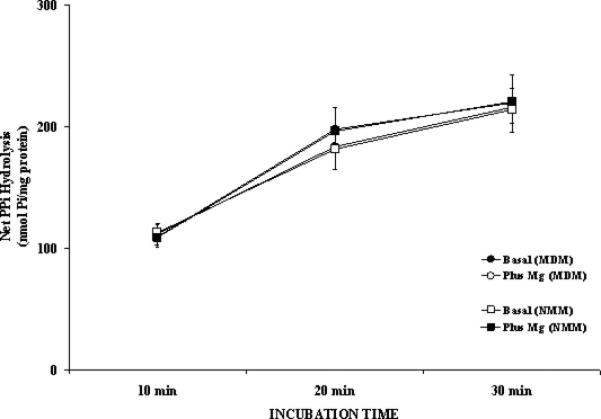
Time course of PPi hydrolysis in the presence of 1mM PPi and 1mM Mg2+ added to the incubation system is reported for NMM and MDM. Data, expressed as μmol Pi/mg protein, are means±S.E. of 4 experiments for each condition, each performed in duplicate.
To further validate the effect of a decrease in hepatic Mg2+ content on G6P transport and hydrolysis, microsomes were isolated from overnight starved rats. We have previously reported that the liver of these animals is essentially depleted of glycogen and presents a >12% decrease in total Mg2+ content [9]. The results reported in Fig. 7 show that G6P hydrolysis rate in these MS was intermediate between the rates measured in NMM and MDM. Also in this model the addition of extra-reticular Mg2+ decreased, and the addition of EDTA increased, G6P hydrolysis rate at all the concentrations tested (Fig, 7).
Figure 7. G6P hydrolysis in microsomes isolated from livers of overnight starved animals.
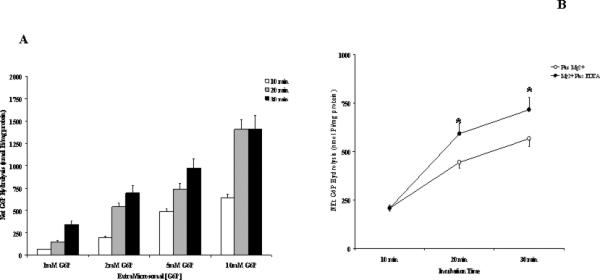
Total liver microsomes were isolated from livers of rats starved overnight as described under Materials and Methods. Hydrolysis rate expressed as nmol Pi/mg protein in the presence of various G6P concentrations is reported in Fig. 7A. The effect of 1mM Mg2+ plus/minus 2mM EDTA addition to the extramicrosomal milieu on the microsome hydrolysis rate is reported in Fig. 7B. Data are means±S.E. of 4 experiments for each condition, each performed in duplicate. *Statistically significant vs. corresponding values in the absence of EDTA.
DISCUSSION
Within the hepatocyte Mg2+ is abundantly concentrated in the cytoplasm and endoplasmic reticulum (ER) [1]. In the cytoplasm, Mg2+ is predominantly present in the form of a complex with ATP and other phosphonucleotides [2], leaving free [Mg2+]i at approximately 0.7mM [3]. In the ER, total Mg2+ concentrations in the order of 16 to 20mM have been measured [1]. The presence of such a high concentration has raised the question about the physiological role Mg2+ may play within the lumen of the ER in addition to its well established involvement in regulating protein synthesis [27], or Ca2+ released from the endoplasmic [28] or sarcoplasmic reticulum [29] via IP3 and ryanodine receptor, respectively.
Glucose 6-phosphatase is one of the main enzymes operating within the endoplasmic reticulum of the hepatocyte. As indicated in the Introduction, two slightly different operating models have been proposed [14,17] based upon the nature of G6P transport mechanism. Both models, however, concede that G6P does not have free access to the endoluminal hydrolytic site of G6Pase but has to be transported across the ER membrane. Following G6P hydrolysis, glucose and Pi are released into the cytoplasm via a glucose-transport mechanism [17] and the operation of the G6PT as a phosphate-linked antiporter [19]. Classical studies by Nordlie and his group indicate that G6P hydrolysis is regulated by the rate of substrate delivery to the hydrolytic site [14,15]. Recently, we have reported that dynamic changes in cytosolic Mg2+ concentration in a range consistent with variations observed following catecholamine or insulin stimulation up- or down-regulate, respectively, G6Pase activity in liver cells [7].
The present study was undertaken to test the hypothesis that a persistent decrease in hepatic cytosolic or ER Mg2+ concentration would result in a sustained G6Pase activity up-regulation.
The results reported here indicate that G6Pase enzymatic activity is indeed increased by 30% to 40% in the hepatic ER of animals maintained on Mg2+ deficient diet for 2 weeks. The increase in activity does not depend on an increase in protein expression, and it can be acutely modulated by changes in the amount of Mg2+ or EDTA added to the extravesicular medium, or in the amount of Mg2+ added to MDM after purification. Glucose 6-phosphatase operates within the rough and smooth compartments of the ER [11], with a more pronounced activity in the second [11]. Because the amount of RNA associated with MDM and NMM are equivalent, the prevalent purification of a microsomal subpopulation with enhanced hydrolytic activity (i.e. SER versus RER) from livers of Mg2+-deficient animals can reasonably be excluded. The modulatory role of Mg2+ is corroborated by the data obtained in microsomes from overnight starved animals, which present a decrease in hepatic Mg2+ level and an increase in G6P hydrolysis with values roughly intermediate versus those obtained in NMM and MDM. Taken together, these results suggest that the increase in G6Pase hydrolysis rate depends on the level of cellular Mg2+, which is significantly decreased (>24%) following 2 weeks of exposure to Mg2+ deficient diet, rather than on changes in enzyme expression. While two weeks of Mg2+-deficient diet is generally consider as sufficient to affect various enzymatic and metabolic parameters in the exposed animals, it cannot be completely excluded that prolonged exposure to the diet may induce better detectable modifications in G6Pase expression. Our results support at least in part our previous observation in permeabilized hepatocytes [7] that cytoplasmic Mg2+ level act as the regulatory moiety. However, as the amount of Mg2+ associated with MDD is approximately 50% lower than the amount associated with NMM, it is conceivable that this difference reflects different amounts of Mg2+ ions loosely associated with the G6P binding site and possibly the hydrolytic site of G6Pase. It has to be noted, in fact, that EDTA addition enhances by~10% to 15% G6P hydrolytic activity also in taurocholate-treated NMM. This result is at variance of what previously reported in permeabilized hepatocytes, in which taurocholate treatment did not affect G6P hydrolysis rate [7]. One possible explanation is that in the hepatocyte model the permeabilization by taurocholate was ineffective at removing endoluminal proteins that exerted a buffering effect on intra-reticular Mg2+ content. These intraluminal proteins would instead be removed – at least partially – during the microsome preparation, providing a ‘cleaner’ model that evidences the chelating effect of EDTA on Mg2+ associated with both NMM and MDM.
Kinetic of Efflux
Assessment of passive Mg2+ efflux rate from MDM loaded with 20mM MgCl2 in the absence or in the presence of 2-APB as an inhibitor of the translocon pore does not show appreciable differences. Statistically significant differences, however, can be appreciated in MDM preloaded with 2mM MgCl2. This observation might suggest that the translocon possesses limited capability in terms of Mg2+ permeation. However, as this pore can be more effectively permeated by anions [30], it cannot be excluded that the Cl- moiety and not the Mg2+ moiety represents the limiting step under our experimental conditions for the observed difference. It has to be noted that the concentration of 20mM Mg2+ was selected based on EPXMA measurements suggesting the presence of such a large total Mg2+ concentration within the hepatic endoplasmic reticulum [reviewed in 1]. Technical limitations [reviewed in refs. 1 and 4], however, prevent us from effectively determining intrareticular free Mg2+ concentration by conventional fluorimetry as the dyes retain higher affinity for Ca2+ as compared to Mg2+ [1]. Hence, the possibility that the lowest concentration of Mg2+ used here (2mM) closely approximates the free Mg2+ level within the ER and the permeation rate of the translocon cannot be dismissed altogether. Further experiments are necessary to address this possibility, as well as the influence of intra-reticular cations and anions on Mg2+ efflux from microsomal vesicles.
Conclusions
The presence of glucose to G6P to glucose futile cycle within the hepatocyte has been reported [31], and interpreted as part of the mechanisms activated by the liver cells to maintain glucose and Ca2+ homeostasis [32]. The data reported here raise the possibility that a decline in cytosolic Mg2+ associated with the decrease in cellular energetic substrate (glycogen and/or glucose) promotes an increased hydrolysis of G6P as part of a compensatory mechanism to utilize glucose still available within the hepatocyte for energetic purposes. In this context, the modulatory effect of Mg2+ on G6P transport and hydrolysis appears to be an integral component of the hepatocyte response to conditions in which intracellular glycogen or glucose is not available (starved animals, [9]) or is being mobilized by pro-glycemic hormones (catecholamine and glucagon, [8]), and can be of relevance under pathological conditions (e.g. diabetes), in which a decline in cellular Mg2+ content [10] and an increased expression and activity of G6Pase [33] have been reported.
Acknowledgments
This study was supported by NIAAA-AA11593.
Footnotes
Publisher's Disclaimer: This is a PDF file of an unedited manuscript that has been accepted for publication. As a service to our customers we are providing this early version of the manuscript. The manuscript will undergo copyediting, typesetting, and review of the resulting proof before it is published in its final citable form. Please note that during the production process errors may be discovered which could affect the content, and all legal disclaimers that apply to the journal pertain.
1Abbreviations
G6P = Glucose 6-phosphate; G6Pase = glucose 6-phosphatase; G6PT = glucose 6-phosphate transporter; G6Pasec= glucose 6-phosphatase catalytic subunit; PPi = pyrophosphate; Pi = inorganic phosphate; EDTA = ethylenediamine tetraacetic acid; 2-APB = 2-aminoethoxydiphenyl-borate; AAS = atomic absorbance spectrophotometry; NMM = normal Mg2+ microsomes; MDM = Mg2+-deficient microsomes.
REFERENCES
- 1.Romani A, Scarpa A. Front. Biosci. 2000;5:d720–d734. doi: 10.2741/romani. [DOI] [PubMed] [Google Scholar]
- 2.Scarpa A, Brinley FJ. Fed. Proc. 1981;40:2646–2652. [PubMed] [Google Scholar]
- 3.Corkey BE, Duszynski J, Rich TL, Matschinsky B, Williamson JR. J. Biol. Chem. 1986;261:2567–2574. [PubMed] [Google Scholar]
- 4.Romani A, Scarpa A. Arch. Biochem. Biophys. 1992;298:1–12. doi: 10.1016/0003-9861(92)90086-c. [DOI] [PubMed] [Google Scholar]
- 5.Maguire ME. Trends Pharmacol. Sci. 1984;5:73–77. [Google Scholar]
- 6.Garfinkel L, Garfinkel D. Magnesium. 1985;4:60–72. [PubMed] [Google Scholar]
- 7.Doleh L, Romani A. Arch. Biochem. Biophys. 2007;467:283–290. doi: 10.1016/j.abb.2007.09.001. [DOI] [PMC free article] [PubMed] [Google Scholar]
- 8.Fagan TE, Romani A. Am. J. Phyisol. 2000;279:G943–G950. doi: 10.1152/ajpgi.2000.279.5.G943. [DOI] [PubMed] [Google Scholar]
- 9.Torres LM, Youngner J, Romani A. Am. J. Physiol. 2005;288:G195–G206. doi: 10.1152/ajpgi.00488.2003. [DOI] [PubMed] [Google Scholar]
- 10.Fagan TE, Cefaratti C, Romani A. Am. J. Physiol. 2004;286:E184–E193. doi: 10.1152/ajpendo.00200.2003. [DOI] [PubMed] [Google Scholar]
- 11.Romani A, Fulceri R, Benedetti A. Arch. Biochem. Biophys. 1988;266:1–9. doi: 10.1016/0003-9861(88)90231-7. [DOI] [PubMed] [Google Scholar]
- 12.Fulceri R, Romani A, Pompella A, Benedetti A. Biochim. Biophys. Acta. 1990;1022:129–133. doi: 10.1016/0005-2736(90)90409-h. [DOI] [PubMed] [Google Scholar]
- 13.Senesi S, Marcolongo P, Kardon T, Bucci G, Sukhodub A, Burchell A, Benedetti A, Fulceri R. Biochem. J. 2005;389:57–62. doi: 10.1042/BJ20050213. [DOI] [PMC free article] [PubMed] [Google Scholar]
- 14.Foster JD, Nordlie RC. Exp. Biol. Med. 2002;227:601–608. doi: 10.1177/153537020222700807. [DOI] [PubMed] [Google Scholar]
- 15.Banhegy G, Marcolongo P, Fulceri R, Hinds C, Burchell A, Benedetti A. J. Biol. Chem. 1997;272:13584–13590. doi: 10.1074/jbc.272.21.13584. [DOI] [PubMed] [Google Scholar]
- 16.Pan C-J, Lei K-J, Annabi B, Hemrika W, Chou JY. J. Biol. Chem. 1998;273:6144–6148. doi: 10.1074/jbc.273.11.6144. [DOI] [PubMed] [Google Scholar]
- 17.Gerin I, Schaftingen EV. FEBS Lett. 2002;517:257–260. doi: 10.1016/s0014-5793(02)02640-6. [DOI] [PubMed] [Google Scholar]
- 18.Berteloot A, Vidal H, van de Werve G. J. Biol. Chem. 1991;266:5497–5507. [PubMed] [Google Scholar]
- 19.Chen S-Y-, Pan C-J, Nandigama K, Mansfield BC, Ambudkar SV, Chou JY. FASEB J. 2008;22:2206–2213. doi: 10.1096/fj.07-104851. [DOI] [PubMed] [Google Scholar]
- 20.Henne V, Soling H-D. FEBS Lett. 1986;202:267–273. doi: 10.1016/0014-5793(86)80699-8. [DOI] [PubMed] [Google Scholar]
- 21.Seddon D, Fynn GH. Anal. Biochem. 1973;56:566–570. doi: 10.1016/0003-2697(73)90221-2. [DOI] [PubMed] [Google Scholar]
- 22.Fabiato A. Meth. Enzymol. 1988;157:378–417. doi: 10.1016/0076-6879(88)57093-3. [DOI] [PubMed] [Google Scholar]
- 23.Csala M, Marcolongo P, Lizák B, Senesi S, Margittai E, Fulceri R, Magyar JE, Benedetti A, Bánhegyi G. Biochim Biophys Acta. 2007;1768:1325–1341. doi: 10.1016/j.bbamem.2007.03.009. [DOI] [PubMed] [Google Scholar]
- 24.Giunti R, Gamberucci A, Fulceri R, Bánhegyi G, Benedetti A. Arch. Biochem. Biophys. 2007;462:115–121. doi: 10.1016/j.abb.2007.03.039. [DOI] [PubMed] [Google Scholar]
- 25.Torres LM, Konopnika B, Berti-Mattera LN, Liedtke C, Romani A. Alcohol. Clin. Exp. Res. 2010;34:1659–1669. doi: 10.1111/j.1530-0277.2010.01252.x. [DOI] [PMC free article] [PubMed] [Google Scholar]
- 26.Lowry OH, Rosenbrough NJ, Farr AL, Randall RJ. J. Biol. Chem. 1951;193:265–275. [PubMed] [Google Scholar]
- 27.Terasaki M, Rubin H. Proc. Natl. Acad. Sci. USA. 1985;82:7324–7326. doi: 10.1073/pnas.82.21.7324. [DOI] [PMC free article] [PubMed] [Google Scholar]
- 28.Volpe P, Alderson-Lang BH, Nickols GA. Am. J. Physiol. 1990;258:C1077–C1085. doi: 10.1152/ajpcell.1990.258.6.C1077. [DOI] [PubMed] [Google Scholar]
- 29.Zahradnikova A, Dura M, Gyorke I, Escobar AL, Zahradnik I, Gyorke S. Am J. Physiol. 2003;285:C1059–C1070. doi: 10.1152/ajpcell.00118.2003. [DOI] [PubMed] [Google Scholar]
- 30.Lizak B, Czegle I, csala M, Benedetti A, Mandl J, Banhegyi G. Am j Physiol. 2006;291:511–517. doi: 10.1152/ajpcell.00274.2005. [DOI] [PubMed] [Google Scholar]
- 31.Jungermann K, Heilbronn R, Katz N, Sasse D. Eur. J. Biochem. 1982;123:429–436. doi: 10.1111/j.1432-1033.1982.tb19786.x. [DOI] [PubMed] [Google Scholar]
- 32.Benedetti A, Fulceri R, Ferro M, Comporti M. Trends Biochem. Sci. 1986;11:284–285. [Google Scholar]
- 33.Grempler R, Günther S, Steffensen KR, Nilsson M, Barthel A, Schmoll D, Walter R. Biochem. Biophys. Res. Commun. 2005;338:981–986. doi: 10.1016/j.bbrc.2005.10.030. [DOI] [PubMed] [Google Scholar]


