

Abstract
A traditional technique for structure-based drug design (SBDD) is mapping protein surfaces with probe molecules to identify “hot spots” where key functional groups can best complement the receptor. Common methods, such as minimizing probes or calculating grids, use a fixed protein structure in the gas phase, ignoring both protein flexibility and proper competition between the probes and water. As a result, the potential surface is quite rugged and many spurious, local minima are identified. Here, we compare rigid and fully flexible protein in mixed-solvent molecular dynamics (MixMD), which allows for flexibility and full solvent effects. We were surprised to find that that the many local minima are still found when a protein's conformational sampling is restricted; the dynamic averaging of probes and competition with water does not smooth the potential surface as one might expect. Only when a protein is allowed to be fully flexible in the simulation are the proper minima located and the spurious ones eliminated. Our results indicate that inclusion of full protein flexibility is critical to accurate hot-spot mapping for SBDD.
Protein flexibility is an important component of protein-ligand binding, but it is often neglected in structure-based drug design (SBDD). Many traditional techniques for SBDD rely upon solvent mapping performed through grids or probe minimization. Most computational solvent-mapping techniques1–4 do not account for the impact of protein flexibility on ligand binding, which prevents accurate mapping of hot spots. Also, they typically do not allow for active competition between solvent probes and water, ignoring proper solvation effects. In this communication, we demonstrate that the conformational diversity inherent to proteins strongly affects the outcome of hot-spot mapping.
An experimental method that explores protein surfaces using water and organic solvent as probes is the multiple solvent crystal structure (MSCS)5 technique. Potential protein unfolding is typically prevented through cross-linking. The results of this procedure, performed with various solvents, can be superimposed to design custom ligands by linking fragments. We have developed a protocol for using MixMD to map hot spots in a way similar to MSCS. Our multiple protein structure (MPS) method6–8 for creating binding-site pharmacophore models based on conformational ensembles has demonstrated success in mapping protein systems for drug design.9,10 MixMD expands the MPS concept to simultaneously allow protein flexibility and competition between probes and water.
Several similar efforts have incorporated MSCS concepts into a computational method, but each has notable limitations. FTMap11 is modeled after MSCS, but while it can be used with ensembles like MPS12, neither ligand nor on-the-fly protein flexibility is used during probe mapping. A recent study from Seco et al. utilized MD with mixed water and isopropanol to detect binding sites and predict potential druggability.13 However, the method was unable to reproduce many known binding sites. SILCS is a mapping method that incorporates a ternary solvent system (benzene, isopropanol, and water) with MD to map sites.14 However, the method was validated on only one protein that did not have MSCS data available for a proper evaluation. Therefore, these methods are in their infancy and require significant development to provide a robust tool for SBDD. This study presents initial findings based on our MixMD protocol that should have significant impact for others developing similar techniques.
Hen egg-white lysozyme (HEWL) is a canonical model system that allows for appropriate testing and validation of MixMD to identify hot spots. A MSCS of HEWL was produced using acetonitrile (CCN) as the organic solvent.15 The high quality electron density available for this structure allows for an accurate assessment of MixMD data. Below, we demonstrate how occupancy grids for both the probe and water can be directly compared to electron density.
MixMD simulations
The starting structure of HEWL in CCN and water (2LYO)15 was obtained from the PDB16. We performed all-atom MD simulations of the HEWL protein in the presence of multiple solvents using standard procedures for sander in AMBER1017 at 300K (see supporting information, SI, for detailed methods). Pre-equilibrated solvent boxes with an even distribution of 50% weight/weight CCN and water were used. Simulation setup was completed in tLeAP using the ff99SB force field18, TIP3P water19, neutralizing ions, a 10-Å vdw cutoff, and CCN parameters from Grabuleda et al20. A time step of 2 fs was implemented, temperature was controlled through an Anderson thermostat21, and SHAKE was applied. Three different protocols for protein flexibility were evaluated for proper sampling and convergence: all-atom restrained, backbone restrained, and fully flexible HEWL. Five independent simulations with 10 ns of production time each were performed for every system, initiated from the same solvent configuration. Though it might enhance sampling to have alternate starting locations for solvent in each simulation, it would make it more difficult for us to properly evaluate convergence in the simulations.
Prediction of hot spots
The positions of the solvent from the sander trajectories were converted into occupancy grids using ptraj. In this way, we were able to directly compare our solvent “density” results to electron density data obtained in the crystallography study. This allowed for an equivalent comparison of solvent positions during simulation with solvent occupancy from crystal studies, which is a more even assessment than simply using the solvent coordinates given. (In the figures below, crystallographic coordinates for CCN and water are often used in place of electron density to avoid the confusion of overlaying many grids.) Technically, the most equivalent data to crystallographic density would be an occupancy grid based on all atoms of the simulation (protein, water, CCN, and counter ions), but we have made the simplification of examining only solvent-occupancy grids.
Our initial simulation used mobile solvent and a fixed protein, we aimed to establish a minimum sampling time required for the solvent to reproduce the MSCS results. We assumed that the mapping would identify the position for CCN and that longer sampling times would be required as more flexibility was allowed for the protein. Instead, we were surprised to find that our simulation of the rigid protein converged to multiple, trivial minima (Figure 1). Though the CCN hot spot in the crystal structure was mapped with weak occupancy, it was equal to and less than many incorrect sites. When we added side-chain flexibility (backbone still fixed), a variety of incorrect sites were again located, but the correct location was not! Only when full protein flexibility was allowed was the correct location for the CCN hot spot found and the trivial minima eliminated.
Figure 1.
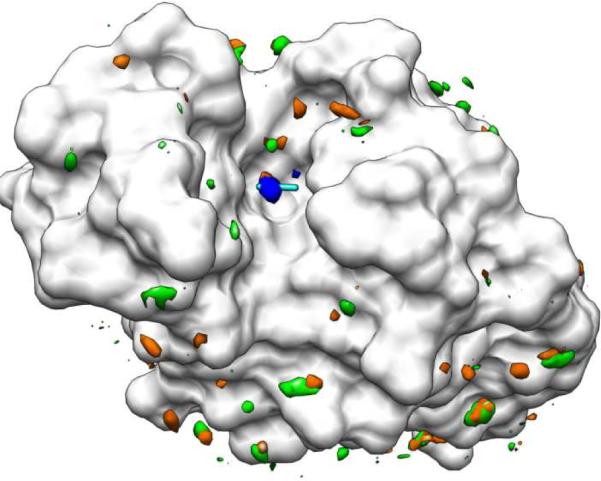
Results from unrestrained vs. restrained protein simulations using CCN and water to solvate HEWL (white). The single hotspot identified by MSCS is shown in stick; CCN (cyan). The probe density from the fully restrained simulation is shown in orange, from backbone-restrained in green, and from fully flexible in blue. Many incorrect local minima are seen in green and orange, but only the correct position dominates the simulation of the fully flexible protein in blue.
It appears that the numerous local minima obtained when performing gas-phase minimizations of probe molecules are not an artifact of the vacuum; they are an artifact of using a rigid protein conformation. A rugged landscape is observed, even in the presence of mobile solvent and side chains. The abundant local minima cannot be distinguished from the binding site, and probe mapping cannot successfully differentiate between irrelevant and druggable hot spots. With full receptor flexibility included, MixMD appropriately reproduces the one hot-spot binding site seen in the crystallographic data for CCN. The agreement between simulation data and experimental electron density validates MixMD as an accurate mapping tool (Figure 2).
Figure 2.

MixMD data for the fully flexible simulation agrees well with densities from MSCS experiments using CCN and water. All snapshots were superimposed on the crystal structure of HEWL (white surface). MixMD density for water is shown in red mesh, and crystallographic waters are colored black for B-factors below 33 Å and yellow above 33 Å. The MSCS coordinates for CCN are shown in stick form (cyan with its electron density in mesh, 2Fo-Fc shown at 1.5σ); the highest occupancy for CCN in the fully flexible simulation matches perfectly and is shown in solid blue surface. Unsatisfied electron density in the crystal structure (positive Fo-Fc shown at 3σ) is shown in solid purple. (A) Water maps within the protein highlight interior waters conserved in the crystal structure and reproduced in our simulation. The large astrices (*) denote two highly occupied regions of the interior water map that correspond to unfulfilled density in the crystal structure. (B) Maps of the protein surface show good correspondence between crystallographic and MixMD densities for both CCN and well resolved waters. For the 16 crystallographic waters with B-factors below 33 Å (black spheres) five occur at symmetry-packing interfaces. MixMD misses four of the five which is expected because the contacts are not present in our simulation. The other 11 best resolved waters are well reproduced.
In addition to the CCN hot spot, MixMD reproduced the locations of low-B-factor water (<33 Å). The only locations that were not reproduced were on surfaces of the protein that were involved in crystallographic contacts (Figure 2B). A few locations were seen where significant water occupancy in the interior of the protein did not correlate with water coordinates in the crystal structure, but those locations were in excellent agreement with unfulfilled density in the crystal structure (Figure 2A). The location of positive density on the Fo-Fc map may in fact correspond to water positions. While not all unfulfilled density will correspond to solvent molecules, the locations identified by MixMD water maps may indicate positions where water should have been placed.
Convergence of sampling
Though the 10-ns sampling time used in the simulations is relatively short by current standards, it is important to stress that long trajectories are inappropriate in mixed solvent. Modest timescales are needed: long enough to allow solvent equilibration and convergence but short enough to avoid possible unfolding of the protein. Furthermore, an accurate MD technique built on short timescales makes this method more accessible for practical application in a pharmaceutical setting.
We calculated the maximal occupancy location of each probe type during each individual simulation using the ptraj grid utility. These positions for CCN over the last 2 ns of production were compared between independent simulations of the same initial system (see SI Figure 1). Excellent convergence is seen across the five independent MixMD of the fully flexible HEWL. However, the individual simulations of the rigid and backbone-fixed simulations did not agree on a common location for the CCN hot spot, reflecting a propensity for solvent molecules to become trapped within local minima along the protein surface. For the fully flexible simulation, these points were all within <1 Å, which is within the limits of accuracy when using a 0.5 Å grid. Not only did the locations agree with one another, they were in excellent agreement with the position for CCN in the crystal structure. In contrast, there was no agreement between the five independent MixMD simulations of the rigid and backbone-fixed HEWL (see SI Figure 1). Those simulations also failed to identify the correct location for the CCN hot spot, except for one trajectory of the rigid HEWL.
To further compare sampling, we calculated the ratio of the number of solvent probes to water molecules at the edges of the box. Far from the protein, there should be no bias between the solvents, and the ratio of their occupancies should approach Np/Nw (ratio of the number of CCN probes to the number of water in the simulation).22 All systems demonstrated good convergence according to this metric with the fully flexible system being the least biased (see SI Tables 1–2). The fact that CCN and water exchange freely at the box edge indicates that the mixed solvent system inherently samples evenly, but the pronounced differences at the protein surface indicate that solvent molecules become trapped and poorly sample the rugged potential surface of a rigid or semi-rigid protein.
Initial preparation of the mixed solvent environment
The results above were obtained with a pre-equilibrated 50% w/w solution, but we have also examined other choices for the mixed solvent environment. Two protocols for initiating the mixed solvent box were compared. The first used the pre-equilibrated 50% w/w mixed solution, providing an even distribution of both solvents (data shown above). The second method aimed to reproduce the MSCS experiment where the CCN has to compete water off of the surface of the protein. The waters were placed in a shell around the protein, and the CCN were placed outside the water shell, resulting in a layered solvent environment.
Densities of CCN were in good agreement between the two solvent protocols (see SI Figure 2). Maximal occupancy positions were used to compare coordinates of the experimental probes to simulation probes. For simulations of fully flexible HEWL, we found that the layered solvent produced a maximally occupied location 0.8 Å from the crystallographic C2 atom of CCN. The pre-equilibrated, evenly mixed solvent produced a maximally occupied location 0.9 Å from the crystallographic C2 atom of CCN. These maximally occupied locations were 0.5 Å away from each other. Again, this is within the limits of error of our grids for calculating the occupancy maps. It appears that either protocol may be appropriate for 50% w/w CCN and water, but the layered solvent showed a slight disagreement in the convergence of the five independent simulations (see SI Figure 3).
We have also examined 90% and 10% w/w mixed solutions of water and CCN to determine whether maps are more accurate when more or fewer probes are present. Both 90% and 10% mixtures identified the correct hot spot for CCN (see SI Figure 4). However, we found that the 50% mixtures gave better water maps and more complete sampling than either 90% or 10% mixtures of CCN and water (see SI Figure 5).
Conclusion
Our results demonstrate the need to include protein flexibility to achieve valid hot-spot mapping. MixMD simulations have been successfully performed to determine the correct mapping procedure for locating truly relevant binding minima. MixMD was capable of locating hot spots for the CCN solvent probe, and it identified crystallographic waters with the lowest B-factors, crystal contact waters, and locations where water could have been modeled into the structure (unsatisfied density in the Fo-Fc map). The information contained within individual MixMD trajectories can be combined into a consensus model retaining only the consistently important mapped sites. We have shown that only through the incorporation of protein flexibility and appropriate solvent competition can viable mapping results be obtained.
Supplementary Material
Acknowledgements
We thank Jeanne Stuckey and Thomas Goddard for their advice and assistance in interpreting electron density data. This work has been supported by the National Institutes of Health (GM65372). KWL thanks Rackham Graduate School, the Pharmacological Sciences Training Program (GM07767), and the American Foundation for Pharmaceutical Education for funding. Molecular graphics images were produced using the UCSF Chimera package from the Resource for Biocomputing, Visualization, and Informatics at the University of California, San Francisco.
Footnotes
Supporting Information Available: Supplementary analysis, including detailed methods, additional data, and probe parameters. This material is available free of charge through http://pubs.acs.org
References
- (1).Stultz CM, Karplus M. Proteins. 1999;37:512–529. [PubMed] [Google Scholar]
- (2).Dennis S, Kortvelyesi T, Vajda S. Proc. Natl. Acad. Sci. U.S.A. 2002;99:4290–4295. doi: 10.1073/pnas.062398499. [DOI] [PMC free article] [PubMed] [Google Scholar]
- (3).Goodford PJ. J. Med. Chem. 1985;28:849–857. doi: 10.1021/jm00145a002. [DOI] [PubMed] [Google Scholar]
- (4).Guarnieri F, Mezei M. J. Am. Chem. Soc. 1996;118:8493–8494. [Google Scholar]
- (5).Mattos C, Ringe D. Nat. biotech. 1996;14:595–599. doi: 10.1038/nbt0596-595. [DOI] [PubMed] [Google Scholar]
- (6).Meagher KL, Carlson HA. J. Am. Chem. Soc. 2004;126:13276–13281. doi: 10.1021/ja0469378. [DOI] [PubMed] [Google Scholar]
- (7).Bowman AL, Lerner MG, Carlson HA. J. Am. Chem. Soc. 2007;129:3634–3640. doi: 10.1021/ja068256d. [DOI] [PubMed] [Google Scholar]
- (8).Meagher KL, Lerner MG, Carlson HA. J. Med. Chem. 2006;49:3478–3484. doi: 10.1021/jm050755m. [DOI] [PubMed] [Google Scholar]
- (9).Damm KL, Ung PM, Quintero JJ, Gestwicki JE, Carlson HA. Biopolymers. 2008;89:643–652. doi: 10.1002/bip.20993. [DOI] [PMC free article] [PubMed] [Google Scholar]
- (10).Bowman AL, Nikolovska-Coleska Z, Zhong H, Wang S, Carlson HA. J. Am. Chem. Soc. 2007;129:12809–12814. doi: 10.1021/ja073687x. [DOI] [PubMed] [Google Scholar]
- (11).Brenke R, Kozakov D, Chuang GY, Beglov D, Hall D, Landon MR, Mattos C, Vajda S. Bioinformatics. 2009;25:621–627. doi: 10.1093/bioinformatics/btp036. [DOI] [PMC free article] [PubMed] [Google Scholar]
- (12).Landon MR, Amaro RE, Baron R, Ngan CH, Ozonoff D, McCammon JA, Vajda S. Chem. Biol. Drug Des. 2008;71:106–16. doi: 10.1111/j.1747-0285.2007.00614.x. [DOI] [PMC free article] [PubMed] [Google Scholar]
- (13).Seco J, Luque FJ, Barril X. J. Med. Chem. 2009;52:2363–2371. doi: 10.1021/jm801385d. [DOI] [PubMed] [Google Scholar]
- (14).Guvench O, MacKerell AD., Jr. PLoS Comput. Biol. 2009;5:e1000435. doi: 10.1371/journal.pcbi.1000435. [DOI] [PMC free article] [PubMed] [Google Scholar]
- (15).Wang Z, Zhu G, Huang Q, Qian M, Shao M, Jia Y, Tang Y. Biochim. Biophys. Acta. 1998;1384:335–344. doi: 10.1016/s0167-4838(98)00027-2. [DOI] [PubMed] [Google Scholar]
- (16).Berman HM, Westbrook J, Feng Z, Gilliland G, Bhat TN, Weissig H, Shindyalov IN, Bourne PE. Nucleic Acids Res. 2000;28:235–242. doi: 10.1093/nar/28.1.235. [DOI] [PMC free article] [PubMed] [Google Scholar]
- (17).Case DA, Darden TA, Cheatham I,TE, Simmerling CL, Wang J, Duke RE, Luo R, Crowley M, Walker RC, Zhang W, Merz KM, Wang B, Hayik S, Roitberg A, Seabra G, Kolossváry I, Wong KF, Paesani F, Vanicek J, Wu X, Brozell SR, Steinbrecher T, Gohlke H, Yang L, Tan C, Mongan J, Hornak V, Cui G, Mathews DH, Seetin MG, Sagui C, Babin V, Kollman PA. University of California; San Francisco: 2008. [Google Scholar]
- (18).Hornak V, Abel R, Okur A, Strockbine B, Roitberg A, Simmerling C. Proteins:Struct. Funct. Genet. 2006;65:712–25. doi: 10.1002/prot.21123. [DOI] [PMC free article] [PubMed] [Google Scholar]
- (19).Jorgensen WL, Chandrasekhar J, Madura JD, Impey RW, Klein ML. J. Chem. Phys. 1983;79:926–935. [Google Scholar]
- (20).Grabuleda X, Jaime C, Kollman PA. J. Comp. Chem. 2000;21:901–908. [Google Scholar]
- (21).Andrea TA, Swope WC, Andersen HC. J. Chem. Phys. 1983;79:4576–4584. [Google Scholar]
- (22).Aburi M, Smith PE. J. Chem. Phys. 2004;108:7382–7388. [Google Scholar]
Associated Data
This section collects any data citations, data availability statements, or supplementary materials included in this article.