Abstract
Increased polyamine production is observed in a variety of chronic neuroinflammatory disorders, but in vitro and in vivo studies yield conflicting data on the immunomodulatory consequences of their production. Ornithine decarboxylase (ODC) is the rate-limiting enzyme in endogenous polyamine production. To identify the role of polyamine production in CNS-intrinsic inflammatory responses, we defined CNS sites of ODC expression and the consequences of inhibiting ODC in response to intracerebral injection of LPS+/− IFNγ. In situ hybridization analysis revealed that both neurons and non-neuronal cells rapidly respond to LPS+/− IFNγ by increasing ODC expression. Inhibiting ODC by co-injecting DFMO decreased LPS-induced CCL2 expression and macrophage influx into the CNS, without altering LPS-induced microglial or macrophage activation. Conversely, intracerebral injection of polyamines was sufficient to trigger macrophage influx into the CNS of wild-type but not CCL2KO mice, demonstrating the dependence of macrophage influx on CNS expression of CCL2. Consistent with these data, addition of putrescine and spermine to mixed glial cultures dramatically increased CCL2 expression and to a much lesser extent, TNF expression. Addition of all three polyamines to mixed glial cultures also decreased the numbers and percentages of oligodendrocytes present. However, in vivo, inhibiting the basal levels of polyamine production was sufficient to induce expression of apolipoprotein D, a marker of oxidative stress, within white matter tracts. Considered together, our data indicate that: (1) CNS-resident cells including neurons play active roles in recruiting pro-inflammatory TREM1+ macrophages into the CNS via polyamine-dependent induction of CCL2 expression and (2) modulating polyamine production in vivo may be a difficult strategy to limit inflammation and promote repair due to the dual homeostatic and pro-inflammatory roles played by polyamines.
Keywords: neuroinflammation, chemokine, immune cell trafficking, autoimmunity, neurodegeneration
INTRODUCTION
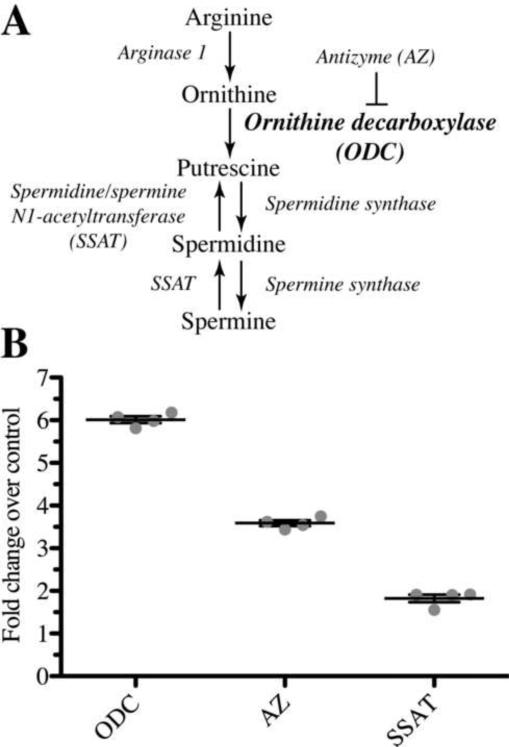
Putrescine, spermidine and spermine belong to a class of small polycationic molecules termed polyamines (Bistulfi et al. 2009, Moinard et al. 2005, Pegg, 2009, Zhang et al. 2000). In healthy mature brain tissue, polyamine levels are relatively low (nanomolar levels). However, polyamine levels can reach micromolar and even millimolar levels during active inflammatory responses as well as during periods with active cell proliferation such as during CNS development (Bistulfi et al. 2009, Moinard et al. 2005, Pegg, 2009, Slotkin and Bartolome 1986, Thomas and Thomas 2001, Zhang et al. 2000). Ornithine decarboxylase (ODC) is the rate-limiting enzyme in the synthesis of all three polyamines in vivo, catalyzing the conversion of ornithine to putrescine (figure 1a) (Bistulfi et al. 2009, Moinard et al. 2005, Pegg, 2009). Increased CNS levels of ODC and polyamines are detected in several animal models of neurodegenerative disorders including amyotrophic lateral sclerosis, ischemia and Alzheimer's disease as well as in brain tissue from individuals with Alzheimer's disease (Clarkson et al. 2004, Kim et al. 2009, Morrison et al. 1995, Morrison et al. 1998, Virgili et al. 2006). Functionally, polyamines are best characterized for their effects promoting cell proliferation during development and cancer, but they also regulate a broad array of cellular functions in both neurons and inflammatory cells (Zhang et al. 2000).
Figure 1. Expression of key enzymes in polyamine biosynthesis is upregulated in primary microglia treated 24 hours with LPS/IFNγ.
A: Selected substrates and enzymes in the polyamine biosynthesis pathway. B: qRT-PCR quantification of enzyme expression over unstimulated control (ODC: ornithine decarboxylase, AZ: antizyme, SSAT: spermine/spermidine N1-acetyl transferase). Expression was calculated based on ddCTs normalized to the housekeeping gene, HPRT. Microglial expression of all mRNAs analyzed was increased in LPS/IFNγ stimulated cells as compared to unstimulated controls (P < 0.0002, two-tailed Student's t-test).
Conflicting in vitro and in vivo data have hindered identifying whether elevated polyamine levels have net neurotoxic versus neuroprotective consequences within the CNS. For example, polyamines are postulated to promote neurodegeneration based on their ability to bind and modulate the functions of inward rectifying K+ channels as well as nicotinic acetycholine and glutamate neurotransmitter receptors (Doyle et al. 1996, Mony et al. 2009, Rao et al. 1991, Shin et al. 2005, Slotkin et al. 2003, Williams 1997). Conversely, polyamines are postulated to be essential for neural repair and regeneration. For example, polyamines promote neurite outgrowth and neurite fasciculation in vitro, and stabilize synapse formation in vivo (Cai et al. 2002, Deng et al. 2009, Georgiev et al. 2008, Khaing et al. 2006, Schreiber et al. 2004). In addition, regeneration of dorsal root ganglion axons is dependent on spermidine synthesis both in vitro and in vivo (Cai et al. 2002, Deng et al. 2009, Gao et al. 2004, Spencer et al. 1994).
Similarly, conflicting data also suggest that polyamines may have dual roles promoting anti- and pro-inflammatory responses within the CNS. Anti-inflammatory actions of polyamines are demonstrated by several in vitro studies. For example, increasing intracellular polyamine levels by blocking polyamine export out of activated macrophages decreases their expression of pro-inflammatory cytokines (Tjandrawinata et al. 1994, Szabo et al. 1994). Treating cultured LPS-activated monocytes and macrophages with spermine both inhibits production of pro-inflammatory cytokines while at the same time increasing expression of anti-inflammatory cytokine, IL-10 (Hasko et al. 2000, Bussiere et al. 2005). Conversely, the pro-inflammatory actions of polyamines are demonstrated by an in vivo model of secondary CNS inflammation. In this model, intraperitoneal (IP) injection of LPS triggers increases in ODC expression throughout the murine CNS that precedes increases in expression of the pro-inflammatory molecules, TLR-2 and TNF (Soulet and Rivest 2003). To prove that the LPS-triggered increases in TNF and TLR2 expression were polyamine dependent, mice were treated with α-di-fluoro-methyl-ornithine (DFMO), an irreversible and specific inhibitor of ODC. DFMO treatment decreased LPS-induced TNF and TLR2 expression. Furthermore, intracerebral injection of spermine prior to IP injections of LPS increased the numbers of cells in the CNS expressing both TNF and TLR2 (Soulet and Rivest 2003).
These data clearly identify pro-inflammatory consequences of polyamine production using an in vivo model of secondary neuroinflammation (Soulet and Rivest 2003). However, two different populations of myeloid cells serve to support CNS function: a largely self-renewing population of CNS resident microglia and a short-lived blood-derived population of macrophages that transiently infiltrate the CNS (Carson et al. 2007, Carson et al. 2009, Ginhoux et al. 2010, Graeber et al. 2010). Even when found in the same CNS microenvironment, microglia and infiltrating monocytes/macrophages have distinct molecular profiles and effector functions (Carson et al. 1998, Carson et al. 2007, Ginhoux et al. 2010, Schmid et al. 2009, Simard et al. 2006).
Ill-defined in the studies by Soulet and Rivest were the relative regulatory roles of polyamines on inflammatory responses of CNS-resident microglia versus CNS-infiltrating monocytes/macrophages. Furthermore, from the in vitro studies on cultured monocytes and macrophages, it is unclear if the anti-inflammatory actions of polyamines also apply to microglia and/or to monocytes and macrophages when found within the CNS microenvironment. In the studies presented here, we test whether polyamines
-
a)
promote or inhibit pro-inflammatory responses initiated from within the CNS microenvironment, and
-
b)
regulate differentially the responses of CNS-resident microglia versus CNS-infiltrating macrophages.
In brief, we find that intracerebral injection of LPS +/− IFNγ results in increased ODC expression by CNS neurons and glia. Co-injection of the ODC inhibitor, DFMO with LPS did not alter either microglial or macrophage activation, but did decrease LPS-induced CNS expression of CCL2 and macrophage influx into the CNS. Furthermore, co-injection of all three polyamines without LPS was by itself sufficient to recruit macrophages into the CNS of wild-type but not CCL2KO mice. In sum, our data identify polyamines as one of the CNS-intrinsic mechanisms regulating CCL2-dependent recruitment of macrophages into the CNS following pathogenic insult.
MATERIALS AND METHODS
Preparation of mixed glial cultures
Mixed glial cultures were prepared as previously described (Carson et al. 1998, 1999, Schmid et al. 2009). Briefly, brains from post-natal day 1–3 C57Bl/6 mice were stripped of meninges, and the cortices mechanically dissociated, seeded into T-75 flasks or 8 well chamber slides and maintained in DMEM, supplemented with 10% FBS and insulin (5μg/ml). Catabolic enzymes present in FBS rapidly convert putrescine, spermine and spermidine to acrolein, a highly cytotoxic compound (Lee and Sayre 1998). Therefore, to analyze the effects of polyamines, mixed glial cell cultures were maintained in serum-free media for 48 hours prior to polyamine addition. Immunohistochemical analysis of cells maintained in 8 well chamber slides was performed as previously described (Raible and McMorris 1993, Sperber et al. 2001). The total cell number and percentages of oligodendrocytes were identified as cells immunoreactive for 2',3' cyclic nucleotide phosphodiesterase (CNP) per total hematoxylin-labeled nuclei in culture. To isolate purified microglia, mixed glial cultures were trypsinized after being in culture for two weeks and single cell suspensions were incubated in DMEM media without phenol red for 30 minutes at 37°C to allow for the re-expression of trypsinized surface markers. Microglia were purified to >98% purity by flow cytometry using PE-conjugated antibodies directed against FcR/CD16/CD32 (BD Bioscience, San Diego, CA) (Carson et al. 1998, 1999, Schmid et al. 2009).
RNA Extraction and Reverse Transcription
RNA was extracted from isolated cells immediately after isolation as previously described (Schmid et al. 2002). RNA concentration was assessed by measuring the absorbance at 260 nm and was adjusted to 1 ug/ul. RNA integrity and absence of genomic DNA were verified by fractionating samples by electrophoresis in denaturing gels. Gels were stained with ethidium bromide and the ratio of 28S to 18S RNA was quantified using a UVP Biodoc it imaging system. Two micrograms of RNA were reverse transcribed using first strand cDNA synthesis kit according to manufactuers instructions (Amersham Biosciences, Buckinghamshire, UK).
Quantitative Real time Polymerase Chain Reaction
Primers were chosen to anneal with a DNA template at a temperature of 60°C and to encompass a coding fragment of 100–300 bp. All the primers used were designed in the 3' UTR of the molecules tested so as to ensure specificity of amplification. Real time qPCR was performed as detailed previously (Schmid et al. 2009). In brief, a constant amount of 200 ng cDNA from each reverse transcription, or each dilution of the appropriate standard, was amplified in 25 μl of TaqMan PCR Core Reagent (Applied Biosystems) according to the manufacturer's instructions. The reaction mixture consisted of 0.5 U of AmpliTaq Gold polymerase, each of the 4dNTPs (0.2 mM), with dUTP replacing dTTP, each pair of primers (300 nM), and MgCl2 (3 mM final concentration) in the above-described Tris buffer. Amplifications were performed in an ABI Prism 7700 Sequence Detector System (Applied Biosystems). The reaction was started with a step of 10 min at 50°C for the removal of uracyl residues incorporated into the cDNAs with 1 U of uracyl-N-glycosylase (AmpErase reagent). This was followed by an incubation of 10 min at 95°C, for AmpliTaq Gold activation, then 40 cycles each consisting of 15 sec at 95°C and 1 min at 60°C. At the end of each experiment, amplification products were fractionated by gel electrophoresis to verify that they migrated as a single band with the expected size. Each sample was analyzed in duplicate. For the quantitative analysis, direct detection of PCR products was performed by measuring the progressive increase in fluorescence emitted by the binding of SYBR Green to double-stranded DNA. Data were normalized to endogenous expression of housekeeping gene hypoxanthine phosphoribosyl transferase (HPRT). Using the comparative cycle threshold (Ct) method, the amount RNA transcripts were expressed as a reference to unstimulated microglia.
Induction of CNS inflammation and flow cytometric analysis of microglia
As previously described, microglia were isolated from the CNS of adult (8–12 weeks old) C57Bl/6J and CCL2KO mice following no treatment or 24 hours following intracerebral injection with LPS (100 ng/ml) plus/minus IFNγ(10 U/ml) plus/minus DFMO (0.25uM), plus/minus 2 nmoles each of putrescine, spermidine and spermine. Total injection volume for all injection conditions is 5 ul (Carson et al. 1998, Schmid et al. 2009). In brief, mice were euthanized by halothane inhalation, and the brains of the mice rapidly removed and mechanically dissociated. The cell suspension was separated on a discontinuous 1.03/1.088 percoll gradient and microglia/macrophages were collected from the interface as well as from the 1.03 Percoll fraction. Microglia and CNS-infiltrating macrophages were purified by flow cytometry using APC-conjugated antibodies against pan-CD45 and phycoerythrin-conjugated antibodies against either CD11b or FcR (BD Biosciences, San Diego, CA). Activated microglia were identified as CD45lo, and either CD11b-positive or FcR-positive Macrophages were identified as CD45hi and either CD11b-positive or FcR-positive.
In situ hybridization analysis
In situ hybridization was performed on free-floating cryosections as described previously (Schmid et al. 2009). Briefly, coronal sections (25 μm) were hybridized at 55°C for 16 h with a 33P-labeled riboprobe (107 cpm/mL). Excess probe was removed by washing at room temperature (23°C) for 30 min in 0.03 M NaCl, 0.003 M sodium citrate (2× SSC) containing 10 uM β-mercaptoethanol, followed by a 1 hour incubation with 4 μg/mL ribonuclease, 0.5 m NaCl, 0.5 m EDTA, 0.05 m Tris-HCl, pH 7.5, at 37°C. Sections were then washed under high-stringency conditions for 1.30 hours at 55°C in 0.5× SSC, 50% formamide and 10 uM β-mercaptoethanol, followed by a 1 hour incubation at 68°C in 0.1× SSC, 5 uM β-mercaptoethanol and 0.1% N-lauryl sarcosine. Myeloid cells and blood vessels were identified by their ability to bind biotinylated tomato lectin (Sigma), while neuronal nuclei were identified by labeling with biotinylated NeuN (Sigma). Bound biotinylated tomato lectin or NeuN was visualized by standard strepavidin-horseradish peroxidase methodology. Sections were mounted on to FisherBrand SuperFrost/plus slides (Fischer Scientific, Pittsburgh, PA, USA) and dehydrated with ethanol and chloroform. Slides were exposed for 3 days to Kodak X-AR film and dipped in Ilford K-5 emulsion (Polysciences, Warrington, PA, USA). After 3 weeks, slides were developed with Kodak D19 developer (Fischer Scientific), fixed and counterstained with Mayer's hematoxylin.
Quantification of CCL2 expression from in situ hybridized tissue sections
The degree of CCL2 expression in each tissue section was expressed as a function of autoradiogram film exposure caused by tissue-bound 33P labeled riboprobe. To insure that equivalent regions were being quantified in tissue sections from different animals, quantification was performed in regions adjacent to the site of intracerebral injection. The site of injection was identified histologically based on needle induced tissue damage and microgliosis visualized by increased tomato lectin labeling. This area was then outlined on the corresponding autoradiogram using the Adobe Photoshop software and film exposure quantified using NIH image J software. Analysis was based on 16 tissue sections per condition in two replicate experiments.
Detection of secreted cytokine with cytokine bead arrays
Protein concentrations of interleukin-6 (IL-6), Interleukin-10 (IL-10), CCL2, interferon-γ (IFN-γ), tumor necrosis factor (TNF), and interleukin-12p70 (IL-12p70) in the supernatants from replicate serum-free mixed glial cultures were measured using the BD™ cytokine bead array (CBA) mouse inflammation kit according to the manufacturer's protocol. In brief, 500ul of collected supernatants were incubated for 2 hours with 50ul of mixed capture beads and 50ul of the PE-detection reagent. The PE-detection reagent is a mixture of PE-conjugated anti-mouse IL-6, IL-10, CCL2, IFN-γ, TNF and IL-12p70 antibodies. The samples were washed and resuspended in 300ul of wash buffer and analyzed immediately by flow cytometry using a BD FACs Calibur and BD Cell Quest software (version 5.2.1). A standard curve and individual capture beads for each cytokine are provided with the kit. Cytokine protein concentrations were determined using BD cytometric Bead Array Software per kit instructions.
RESULTS
LPS/IFNγ induces cultured microglial expression of polyamine regulatory enzymes
Treating primary microglia derived from mixed glial cultures and peripheral macrophage populations with LPS+IFNγ leads to their rapid activation, characterized by increased expression of pro-inflammatory molecules such as MHC class II and CD40 (Carson 1998, Schmid 2009). In addition, treating monocytes and peripheral macrophages with LPS increases expression of ODC, the rate limiting enzyme in polyamine production, (figure 1a) (Salimuddin et al. 1999 Manni et al. 2004). However, it was unexamined whether direct activation of microglia with pro-inflammatory stimuli would also increase microglial expression of polyamine biosynthetic enzymes.
Therefore using quantitative real-time PCR (qPCR) and cDNA templates prepared from mixed glial culture microglia, we quantified LPS/IFNγ-regulated expression of three critical modulators of polyamine production: (a) ODC, (b) antizyme, an endogenous inhibitor of ODC that also promotes ODC degradation and (c) N1-spermine-spermidine acetyl transferase (SSAT) which catalyzes the regeneration of putrescine from spermine (figure 1a). In response to 24 hours of LPS/IFNγ treatment, ODC expression increased by more than 5-fold over the basal level of expression (p < 0.001) (figure 1b). In addition, LPS/IFNγ treatment increased expression of SSAT and antizyme, 1.89 (p < 0.001) and 3.50 (p < 0.001) fold over basal levels, respectively (figure 1b).
LPS/IFNγ induces ODC expression in both neurons and glia in the adult murine CNS
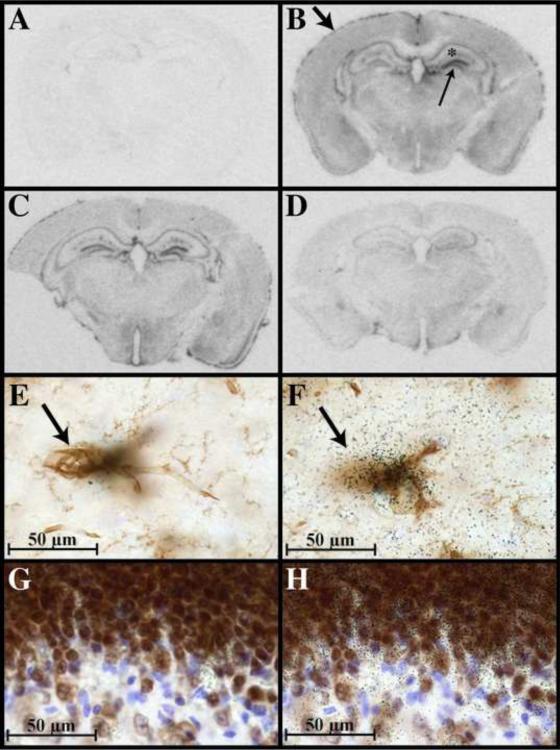
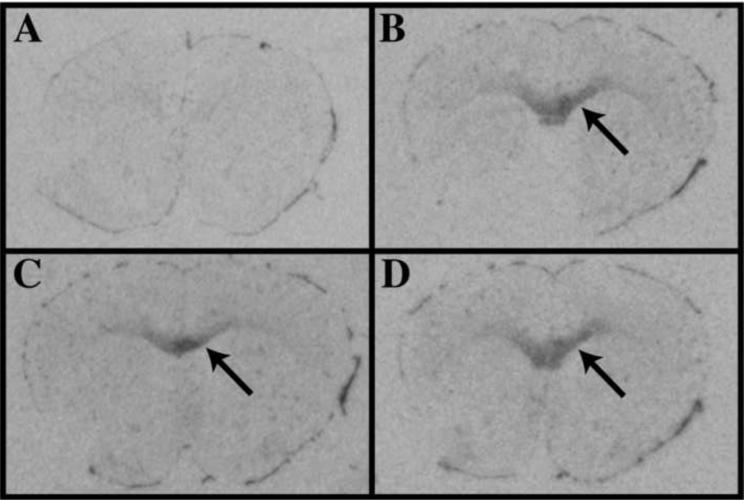
We previously reported that cultured microglia are only in part predictive of microglial responses in vivo (Carson et al 1998, Carson et al. 2008, Schmid et al 2009). Therefore, we examined whether direct intracerebral injection of LPS/IFNγ led to an increase in ODC expression in the CNS as revealed by 33P-labeled riboprobe exposure of autoradiograms. Basal levels of ODC expressed in the CNS of untreated specific pathogen-free (SPF) adult mice were at the border of detection by in situ hybridization analysis and showed diffuse expression in all CNS cells consistent with previous publications (figure 2a; Bernstein et al. 1999). However, as early as three hours post-injection of LPS/IFNγ, increased ODC expression was readily detected throughout the CNS, including sites distant from the site of injection (figure 2b). The highest level of ODC induction was observed in the meninges (downward arrow, figure 2b) and in the dentate gyrus (upward arrow, figure 2b). Within the dentate gyrus, the induction of ODC was always higher on the hemisphere receiving the intrastriatal injection of LPS/IFNγ (upward arrow, figure 2b). A similar pattern and level of ODC expression was detected at 6 hours post-injection of LPS+IFNγ (figure 2c). By 24 hours post-injection, ODC mRNA expression was still elevated over that of untreated controls but was much lower than the levels detected at 3 and 6 hours post-injection (figure 2d). No change in antizyme or SSAT mRNA expression was detected by in situ hybridization following intracerebral injection of LPS/IFNγ in contrast to our in vitro observations with cultured microglia (data not shown, figure 1b).
Figure 2. ODC mRNA expression is robustly upregulated by perivascular cells and neurons following intracerebral injection of LPS/IFNγ.
ODC expression was detected by autoradiogram analysis of brain sections hybridized with 33P-labeled ODC riboprobes (A–D). Brain sections from uninjected control mice (A), from mice 3 hours (B), 6 hours (C) and 22 hours (D) post-LPS/IFNγ injection. Induced ODC expression is indicated in meninges by large downward arrow and in the dentate gyrus by small upward arrow panel in panel B. Panels E and F depict two high magnification focal planes from the region indicated by the asterick in panel B. Panels G and H depict two high magnification focal planes from region indicated by the small upward arrow in panel B. ODC expression is visualized by black grains in film emulsion (panels F and H). Blood vessels, microglia and macrophages are visualized in brown by tomato lectin (E and F). Neurons are visualized in brown by NeuN (G and H). Nuclei are visualized in blue with hematoxylin (E–H).
To identify the cell types expressing ODC in brain sections from control and LPS/IFN-injected mice, microglia, macrophages and blood vessels were visualized using tomato lectin (figure 2e, f), while neurons were visualized using antibodies against NeuN (figure 2g, h). The initial analysis of the autoradiograms suggested that ODC was upregulated in all regions of the CNS and in hippocampal neurons. Analysis of grain density at the level of light microscopy confirmed this initial observation. A global increase in riboprobe associated grain density was observed throughout LPS/ IFNγ-injected brain sections indicating that ODC expression was increased in nearly all CNS cell types: neurons and glia (figure 2). However, the highest level of LPS/IFNγ-induced ODC expression was observed around the vasculature (figure 2e, f) and in hippocampal neurons (2g, h).
Our initial gene profiling studies were designed to identify microglial responses to LPS+IFNγ treatment (Schmid et al. 2002, Carson et al. 2004 and Schmid et al. 2009, figure 1). However, co-injection of IFNγ with LPS was not necessary to induce ODC expression in the CNS. Intracerebral injection of LPS in the presence or absence of IFNγ induced similar patterns of ODC expression in the CNS (supplementary figure 1 and data not shown). In addition, intracerebral injection of LPS alone was sufficient to trigger macrophage influx into the CNS with similar kinetics as injection of both LPS and IFNγ (Carson et al. 1998, 1999, Schmid et al. 2009 and figure 3). Therefore, IFNγ was omitted from intracerebral injections in subsequent studies testing whether ODC expression regulates microglial activation and macrophage influx into the CNS.
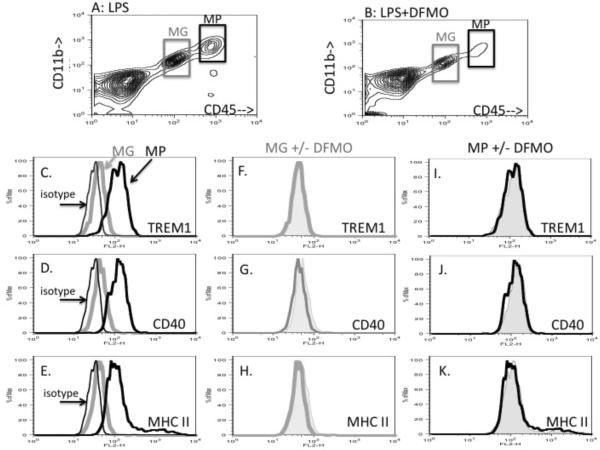
Figure 3. DFMO does not alter LPS-induced microglia or macrophage activation.
Microglia and macrophages were distinguished by flow cytometric analysis of cell suspensions prepared from LPS injected (panel A) or LPS+DFMO (panel B) injected brains. Microglia are identified as CD11b+, CD45lo cells (grey boxes, panels A and B), macrophages are identified as CD11b+, CD45hi cells (black boxes, panels A and B). Microglial (grey histograms) and macrophage (thick black histograms) levels of TREM1 (panel C), CD40 (panel D) and MHC class II (panel E) in LPS injected brains. Non-specific fluorescence of all CD11b+ cells is indicated by the isotype control, (thin black line histogram in panels C–D). Microglial (panels F–H) and macrophage (panels I–K) levels of TREM1 (panels F and I), CD40 (panels G and J) and MHC class II (panels H and K) in LPS-injected mice are depicted by thick line open histograms. Levels in LPS+DFMO injected mice are depicted as grey filled histograms in the same panels.
Inhibiting ODC function in the CNS does not alter LPS-induced activation of microglia and CNS-infiltrating macrophage
α-di-fluoro-methyl-ornithine (DFMO) is a highly specific suicide inhibitor of ODC that binds ODC, inactivates its enzymatic activity and targets ODC for rapid degradation (Poulin et al. 1992, Wallace and Fraser 2004). Thus DFMO treatment inhibits production and is often used as an in vivo diagnostic to distinguish events that are consequences of ODC-dependent polyamine production from events that are merely co-incident with ODC expression (Deng et al. 2009, Manni et al. 2004, Slotkin et al. 2003, Soulet and Rivest 2003, Wallace and Fraser 2004). We therefore, co-injected DFMO with LPS to test whether LPS-induced ODC expression altered LPS-induced activation of microglia or macrophages.
In flow cytometric analysis of brain cell suspensions, both CNS-resident microglia and CNS-infiltrating macrophages can be distinguished from non-myeloid cells (such as macroglia and neurons) based on their labeling with antibodies against CD11b or FcR (figure 3a and 3b, supplementary figure S2). CNS-resident microglia can be distinguished from macrophages acutely infiltrating the CNS based on their different levels of CD45. CNS-resident microglia are CD45lo (grey boxes, figure 3a and 3b), while CNS-infiltrating macrophages are CD45hi (black boxes, figure 3a and 3b; and supplementary figure S2) (reviewed in Carson et al 2008). Macrophages recruited to the CNS following LPS injection display a highly activated pro-inflammatory phenotype greater than CNS-resident microglia in the same brain preparations (figure 3c–e). Specifically, CD45hi macrophages express high levels of TREM1, a receptor that amplifies TLR4 mediated pro-inflammatory responses (figure 3c), CD40, a receptor that triggers phagocytosis and IL-12 production (figure 3d) and MHC class II, a molecule required to present antigens to CD4+ T cells (figure 3e). By contrast, CD45lo microglia express very low to negligible levels of TREM1, CD40 or MHC class II following intracerebral injection of LPS. Co-injection of DFMO did not alter microglial or macrophage expression of any of these activation markers (note open and filled histograms are co-incident (figures 3f–k).
In supplementary figure 2, we use irradiation bone marrow chimeric mice (CX3CR1-GFP bone marrow donors into irradiated C57Bl/6j recipients) to demonstrate that CNS-resident CD45lo microglia do not significantly contribute to the CD4hi macrophage population following LPS-induced activation. In LPS-injected chimeric mice, greater than 95% of CD45hi microglia are GFP+ indicating they are bone marrow derived cells which have only acutely infiltrated the CNS.
Inhibiting ODC function in the CNS decreases LPS-induced influx of CD45hi macrophages into the CNS
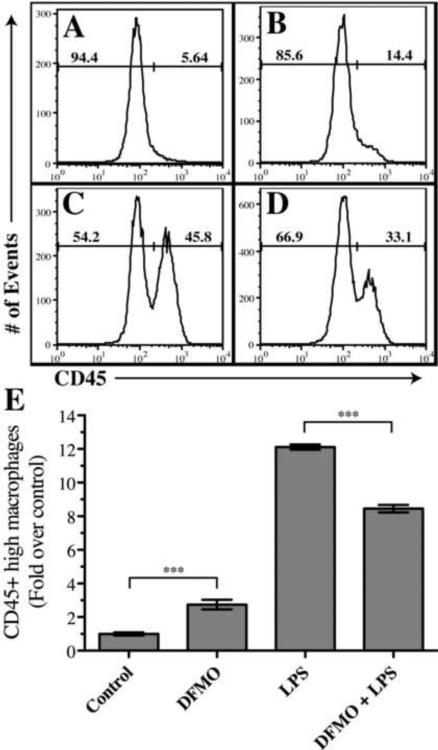
Although DFMO had no effect on LPS-induced microglial and macrophage activation, it did have an effect on macrophage influx (figure 3a, 3b and figure 4). Intracerebral sham injections trigger very little influx of CD45hi macrophages into the CNS (figure 4a, 4e). By contrast, intracerebral injection of DFMO alone caused a small influx of CD45hi macrophages greater than that of sham-only injections (figure 4b, 4e, *P < 0.05). However, this influx was much less than the large influx of macrophages triggered by intracerebral injections of LPS (figure 4c, 4e). Strikingly, co-injection of DFMO with LPS decreased the LPS-induced macrophage accumulation in the CNS by 25% (figure 4d, 4e *P < 0.05). These data indicate that LPS-induced, ODC-dependent polyamine production did not alter microglial or macrophage activation within the intact CNS microenvironment, but did increase the numbers of pro-inflammatory macrophages recruited to the CNS.
Figure 4. LPS-induced accumulation of CD45hi macrophages in the adult CNS is decreased by co-injection of DFMO, an ODC inhibitor.
Panels A–D depict a representative experiment of the percentages of CD45lo microglia and CD45hi macrophages from the brains of mice 24 hours post-injection of A) vehicle control, B) DFMO, C) LPS, D) LPS+ DFMO. CD45 levels are gated on CD11b+ cells. E. Depicts the fold-increase in CD45hi macrophages as compared to the CNS of mice injected with vehicle (n=3 replicate experiments; ***P < 0.05).
Putrescine and spermine induce production of pro-inflammatory cytokines TNF and CCL2 in vitro
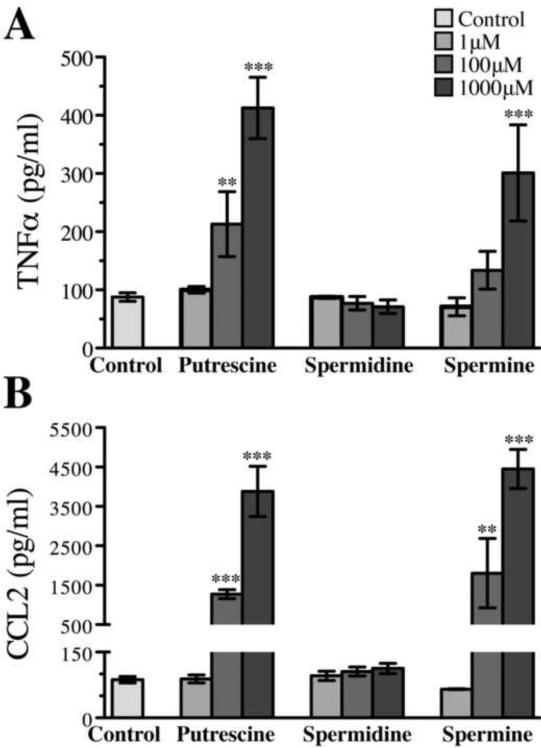
To identify how polyamines promoted and/or sustained LPS-induced CNS neuroinflammation, we treated mixed glial cultures (comprised of astrocytes, microglia and oligodendrocytes) with putrescine, spermidine or spermine. Mixed glial cultures were maintained in serum free media for 48 hours prior to polyamine addition because polyamines are rapidly converted to the highly cytotoxic compound acrolein in the presence of serum (Lee and Sayre 1998, Tanako et al. 2005). We then quantified chemokine and cytokine accumulation in culture supernatants using a flow cytometric bead assay following 24 hours treatment with individual polyamines. We found that at all concentrations tested (1uM–1000uM), none of the three polyamines induced detectable accumulation of the anti-inflammatory cytokine, IL-10 nor of pro-inflammatory cytokines IL12p70, IFNγ, IL10 and IL6 in culture supernatants (data not shown). By contrast, putrescine and spermine both had dose-dependent effects on the accumulation of TNF (figure 5a) and CCL2 (figure 5b) in culture supernatants. The lowest tested concentrations of these two polyamines (1uM) had no effect on the accumulation of either TNF or CCL2 in cultures supernatants. However, intermediate (100uM) and high (1000uM) concentrations of putrescine induced a 2- and 4-fold increase respectively in TNF accumulation, while only the highest concentration of spermine were sufficient to induce a 3-fold increase in TNF (figure 5a, P<0.001). The effects of putrescine and spermine on CCL2 accumulation were more dramatic (figure 5b). While low concentrations of each polyamine had no effect on the amount of CCL2 secreted into mixed glial culture supernatants, intermediate (100uM) levels of both putrescine and spermine caused more than a 100-fold increase in CCL2. Spermidine had no effect on TNF or CCL2 production at all concentrations tested (figure 5b). These data indicate that polyamines are more effective in inducing expression of a molecules involved in macrophage recruitment (CCL2) than a molecules involved in activating microglia and macrophages (TNF).
Figure 5. Mixed glial cultures robustly upregulate concentrations of secreted TNF and CCL2 when exposed to putrescine and spermine, but not spermidine.
0μM 1μM, 100μM, or 1000μM concentrations of putrescine, spermidine, or spermine were added to mixed glial cultures in the absence of FBS for 24 hours. Concentrations of TNF (A) and CCL2 (B) (**P < 0.01, ***P < 0.001, two-tailed Student's t-test).
DFMO inhibits LPS-induced expression of macrophage chemoattactant CCL2 in the adult CNS
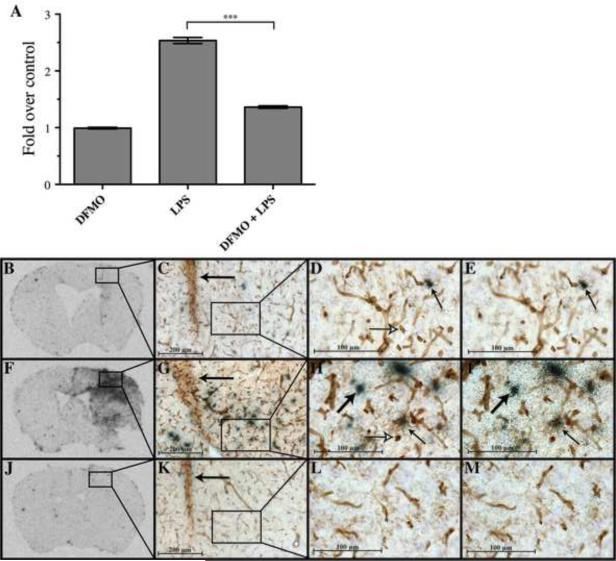
Addition of polyamines to mixed glial cultures stimulated production of the macrophage chemoattractant CCL2, supporting the hypothesis that polyamines play a critical role in LPS-induced macrophage recruitment into the CNS. We therefore tested whether inhibiting ODC in vivo would reduce LPS-induced CCL2 expression in brain regions directly adjacent to the site of intracerebral injection (figure 6). The region in which CCL2 expression was quantified (figure 6a) is identified as the boxed regions in figures 6b, 6f. and 6j). Densitometric analysis of brain sections hybridized with 33P-labeled CCL2 riboprobes demonstrated that intracerebral injection of LPS induced a 2.5-fold higher level of CCL2 expression than DFMO alone (figure 6a, P < 0.001). Strikingly, co-injection of both LPS and DFMO dramatically limited LPS-induced CCL2 expression to nearly the same levels as observed in mice receiving DFMO-only injections (figure 6a, P < 0.001).
Figure 6. LPS-induced expression of CCL2 in the adult CNS is decreased by co-injection of DFMO.
CCL2 expression was quantified using densitometric analysis (A) of autoradiograms exposed to brain sections hybridized with 33P-labeled riboprobes 24 hours post-intracerebral injections of DFMO (B–E), LPS (F–I) or LPS+DFMO (J–M); (3 replicate experiments; ***P < 0.001, two-tailed Student's t-test). Boxed areas in panels B, F and J, represent the areas quantified in panel A. In panels C–E, G–I, K–M, microglia, macrophages and blood vessels are visualized in brown with tomato lectin. CCL2 expression is visualized by back grains in film emulsion. Left pointing arrows in panels C, G, K indicate the site of injection. Panels D, H, L and E, F, H respectively depict two different focal planes of boxed areas in panels C,G, K. Large, upward right pointing black arrows identify CCL2 expressing, lectin-negative cells. Small upward left pointing arrows identify CCL2 expressing lectin-positive cells. Right pointing open headed arrows identify, CCL2-negative, lectin-positive cells.
Blood vessels, microglia and macrophages were visualized with tomato lectin in tissue sections hybridized with 33P-labeled CCL2 riboprobes to identify the spatial relationship of CCL2 expression with the vasculature (figure 6 b–m). Following intracerebral DFMO injection, CCL2 expression was detected in only a small number of both tomato lectin positive and negative cells, generally found closely adjacent to blood vessels (figure 6c–e). Following intracerebral injection of LPS, CCL2 expression was robustly induced in a large number of lectin positive and negative cells (figure 6g–i). However, induced CCL2 expression was not limited to cells directly adjacent to blood vessels. Co-injection of DFMO with LPS dramatically reduced the numbers of cells with detectable CCL2 expression, as well as the numbers of lectin-positive cells displaying an ameboid morphology (figure 6k–m).
Polyamines trigger the influx of CD45hi macrophages into the CNS of wild-type but not CCL2KO mice
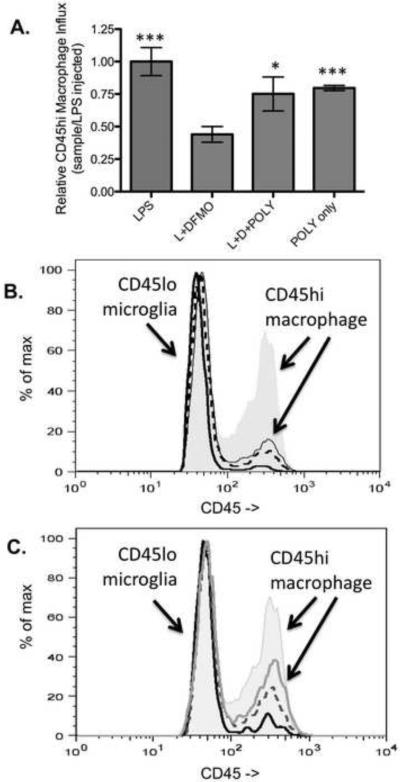
The preceding data suggested that LPS-induced influx of macrophages is mediated in part by polyamine-induced expression of CCL2. To test this hypothesis explicitly in vivo, we tested whether polyamines by themselves were sufficient to trigger macrophage influx into the mature murine CNS of wild-type and CCL2KO mice (figure 7). As previously observed in figure 5, co-injection of DFMO reduced LPS-triggered macrophage influx into the CNS of wild-type mice (figure 7a). Previous studies examining the functional consequences of polyamines in the CNS have intracerebrally injected 1–150nmoles (Deng et al. 2009, Soulet and Rivest 2003, Velloso et al. 2009). Here we found that co-injection of 2 nmoles each of putrescine, spermine and spermidine simultaneous with LPS and DFMO was sufficient to restore ~75% of the LPS-induced macrophage influx into the CNS. Strikingly, co-injection of the three polyamines in the absence of LPS was also sufficient to trigger a macrophage influx that was also ~75% of that observed in mice receiving LPS only injections (figure 7a).
Figure 7. Polyamines restore the influx of CD45hi, TREM1+ macrophages independent of LPS co-stimulation in wild-type but not CCL2KO mice.
Panel A depicts the relative influx of CD45hi, TREM1+ macrophages in mice 24 hours post-injection with LPS, LPS+DFMO (L+DFMO), LPS+DFMO+all three polyamines (L+D+POLY) or all three polyamines (POLY only). Panel B depicts the relative proportion of CD45lo FcR+ microglia and CD45hi, FcR+ macrophages in brain cell suspensions from unmanipulated wild-type mice (solid black line), LPS injected wild-type mice (grey filled histogram), in LPS injected CCL2KO mice (dashed line) and in CCL2KO mice co-injected with 2 nmoles each of all three polyamines. Panel C depicts the relative proportion of CD45lo, FcR+ microglia and CD45hi, FcR+ macrophages in brain cell suspensions from LPS injected wild-type mice (grey filled histogram), putrescene-injected CCL2KO mice (solid black line), in spermine-injected mice (dashed grey line) and in spermidine-injected mice (solid grey line). (n=3 replicates; *P < 0.05, ***P < 0.001, one-tailed Student's t-test; as compared to LPS+DFMO).
To test the CCL2 dependence of macrophage influx into the CNS in our model of primary neuroninflammation, we compared the LPS-triggered macrophage influx between wild-type and CCL2KO mice (figure 7b). Few CD45hi macrophages can be detected in uninjected wild-type mice (solid black line). Approximately 10-fold fewer CD4hi macrophages are observed in LPS injected CCL2KO mice (dashed black line) than observed in LPS-injected wild-type mice (grey filled histogram). Injection of all three polyamines into CCL2KO mice also failed to trigger a large of an influx of CD45hi macrophages in CCL2KO mice (thin grey line). These data indicate that LPS and polyamine triggered macrophage influx were both largely CCL2 dependent and not a simple consequence of tissue damage.
We also compared the relative efficacy of each polyamine to trigger macrophage influx into the CNS of wild-type mice (figure 7c). Individually, none of the three polyamines was able to trigger as large of an influx of CD45hi macrophages (figure 7c) as when all three polyamines were co-injected (figure 7a). Notably, spermidine (solid grey line) triggered a greater influx of macrophages than spermine (dashed black line) or putrescine (solid black line). It is important to point out that the relative potency of each polyamine in triggering macrophage influx in vivo differed from their relative efficacy in inducing TNF and CCL2 expression in mixed glial cultures in vitro (figure 5)
Polyamine treatment leads to depletion of oligodendrocytes from mixed glial cultures
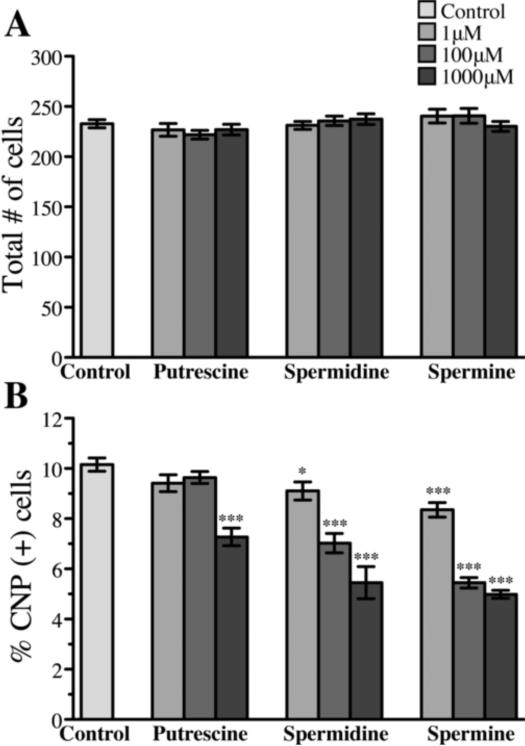
To test whether polyamine associated cytokine induction was associated with cell toxicity, we quantified total cell numbers as a function of polyamine treatment in replicate experiments. At all polyamine concentrations tested, no effect on total cell number per culture was detected (figure 8a). Oligodendrocytes comprise only a small percentage of the total cells in mixed glial cultures (>10%) but can be identified in mixed glial cultures by 2',3'-cyclic nucleotide 3'-phophodiesterase (CNP) immunoreactivity. All three polyamines including spermidine reproducibly decreased the numbers of CNP positive oligodendrocytes present in these mixed glial cultures in a dose-dependent manner (figure 8b). The ability to promote TNF production did not correlate with oligodendrocyte depletion. Putrescine was the most potent polyamine in promoting TNF production, but it was the least potent in reducing oligodendrocytes numbers in mixed glial cultures (figure 5 and figure 8b).
Figure 8. High concentrations of all three polyamines decreased the percentage of oligodendrocytes in culture.
0μM 1μM, 100μM, or 1000μM concentrations of putrescine, spermidine, or spermine were added to mixed glial cultures in the absence of FBS for 24 hours. Total number of cells per slide chamber (A) and percentage of CNP+ cells per slide chamber (B) (*P < 0.05, ***P < 0.001, two-tailed Student's t-test).
Inhibiting basal ODC function induces apolipoprotein D expression in white matter tracts
Intracerebral injection of DFMO alone was sufficient to induce a small, transient accumulation of CD45hi macrophages within the CNS (figure 3), but did not lead to sustained micro- or astrogliosis (figure 6, and data not shown). Increased apolipoprotein D (ApoD) is an early stage response to tissue damage and inflammation (Gangfornia et al. 2008). Its expression is associated with oxidative stress (Gangfornia et al. 2008). We therefore, tested by in situ hybridization analysis whether elevated expression of ApoD would be detected in brains receiving intracerebral injections of DFMO alone (figure 9). ApoD expression was very low, but detectable in the meninges of brains receiving intracerebral injections of vehicle alone (figure 9a). Injection of DFMO alone, LPS alone or DFMO plus LPS, all led to similar increases in ApoD expression globally throughout the CNS, but most prominently within white matter tracts such as the corpus collosum (figures 9b–d). These data indicate that white matter tracts show much greater signs of tissue damage and stress in response to LPS induced inflammation and modulations of polyamine metabolism than in response to the mechanical damage caused by vehicle only injections.
Figure 9. ApoD expression is induced in white matter tracts of mice receiving intracerebral injections of LPS, DFMO and LPS+DFMO.
ApoD expression was detected by autoradiogram analysis of brain sections
DISCUSSION
The endogenous polyamines (putrescine, spermidine and spermine) regulate a diverse array of cellular functions and are essential for normal cell growth and survival (Moinard et al. 2005). Within the CNS, polyamines levels are high during early development and decrease to low steady state levels after birth (Khaing et al. 2006, Malaterre et al. 2004). Polyamines and/or expression of ODC increase dramatically in response to systemic inflammation (Soulet and Rivest, 2003) and during the pathogenesis of several CNS neurodegenerative diseases (Clarkson et al. 2004, Kim et al. 2009, Morrison et al. 1995, Morrison et al. 1998, Virgili et al. 2006). In our current studies, we demonstrate that increased ODC expression is an early response of nearly all CNS resident cells (neurons and glia) to neuroinflammation induced from within the CNS via intracerebral injection of LPS +/− IFNγ.
Previously published experiments aimed at determining the functional consequences of increased polyamine production during CNS injury and disease have yielded conflicting data. While very high levels of polyamines are toxic to neurons, in vitro and in vivo studies, reveal that polyamines can promote critical repair processes required to support axonal outgrowth and regeneration even in the presence of the inhibitory effect of intact myelin (Cai et al. 2004, Gao et al. 2004, Spencer et al. 2004). With respect to inflammation, in vitro data examining the effects of polyamines on macrophages cultured outside the CNS microenvironment reveal an anti-inflammatory role of polyamines (Tjandrawinata et al. 1994, Szabo et al. 1994, Hasko et 2000). Notably, LPS and IFNγ stimulated macrophage activation is associated with specific export of putrescine from intracellular stores, while pharmacologic inhibition of putrescine export inhibits LPS and IFNγ triggered proinflammatory cytokine production (Tjandrawinata et al. 1994, Szabo et al. 1994, Hasko et al. 2000). These data demonstrate the neuroprotective potential of increased polyamine levels, but many of these same studies also report that the anti-inflammatory effects of polyamines are dependent on components present in serum added to cultures.
The potential contribution of polyamines toward pro-inflammatory responses has also been clearly demonstrated. In response to LPS-induced systemic inflammation (Soulet and Rivest, 2003), ODC activity transiently increases in the CNS concurrent with increased expression of two pro-markers of pro-inflammatory responses: TNF and TLR2. Adding DFMO, a suicide inhibitor of ODC to the drinking water of mice not only decreased ODC expression and activity in the CNS, it decreased CNS expression of both TNF and TLR2. One uncertainty from these experiments is whether the observed modulation in TNF and TLR2 expression in the CNS was an indirect consequence of modulating systemic inflammation outside the CNS. In this model, systemic inflammation was initiated by intraperitoneal injection of LPS and the authors carefully documented that LPS did not enter the CNS.
Our current studies focused on CNS-initiated and CNS-intrinsic regulation of neuroinflammation by polyamines. Here, we triggered a robust, transient activation of CNS-resident microglia and influx of activated pro-inflammatory macrophages by intracerebral injections of LPS +/− IFNγ. Using this primary model of CNS neuroinflammation, we found that acute DFMO-mediated inhibition of ODC within the CNS not only decreased LPS-triggered expression of the macrophage chemoattractant CCL2 by neurons and glia. DFMO-mediated inhibition of ODC within the CNS also decreased the influx of CD45hi blood-derived macrophages into the CNS. Furthermore, co-injection of all three polyamines was sufficient to restore macrophage influx even in the presence of DFMO or the absence of LPS. Polyamine induced influx was not a consequence of non-specific damage to the CNS or the blood-brain-barrier. Rather, the 10-fold reduction in macrophage influx in CCL2KO mice revealed that polyamine triggered macrophage influx was largely CCL2 dependent.
Our data also suggest that polyamines may have concentration dependent effects within the CNS. Addition of polyamines to mixed glial cultures reduced the percentage of oligodendrocytes present, while injection of DFMO alone caused increased ApoD expression indicative of tissue stress and oxidative damage in white matter tracts. Constitutive production of low levels of polyamines is well-defined to play essential roles in many cellular homeostatic functions (Bistulfi et al. 2009, Moinard et al. 2005). Thus inhibiting basal ODC activity may have generated modest cytotoxic/proinflammatory signals in the CNS. This type of tissue stress and/or damage may be the reason that injection of DFMO was by itself sufficient to induce low level expression of CCL2 and a small influx of macrophages into the CNS in the absence of additional pro-inflammatory stimuli.
Although the activation states of microglia and macrophages were not decreased when DFMO was co-injected with LPS into the CNS, the numbers of pro-inflammatory CNS-infiltrating macrophages were reduced. Our data thus support the previous studies by Soulet and Rivest (2003) indicating a pro-inflammatory role for polyamines within the CNS. In addition, our studies identify a specific role for polyamines in facilitating immune cell recruitment into the CNS that is in part driven by neuronal expression of ODC. Our data also provide support for polyamines being differentially regulated and playing different pro- and anti-inflammatory roles dependent on the microenvironment. For example, in our studies microglia increase expression of ODC, SSAT and antizyme in vitro, but only increase expression of ODC in vivo. Similarly, in vitro spermidine did not induce CCL2 expression, but in vivo spermidine was the most potent of the three polyamines in promoting macrophage influx into the CNS.
The consequences of neuronal expression of ODC might at first glance be viewed as maladaptive if it ultimately results in chemokine-induced influx of macrophages into the CNS. Chronic macrophage influx is associated with cytotoxicity. However, transient influx of macrophages into the CNS that leads to rapid removal of pathogens and/or damaged CNS tissue can be adaptive for CNS function. For example, decreased influx of blood-derived macrophages into the CNS has been correlated with increased amyloid plaque deposition in murine models of amyloid pathology (Simard et al. 2006). By contrast, chronic overproduction of polyamines may ultimately serve to prevent resolution of inflammation and thus promote neurodegenerative processes.
Supplementary Material
Acknowledgements
These studies were supported by grants to MJC from NINDS (NS39508, NS045735), the Dana Foundation and UCR Division of Biomedical Sciences PIC Program. DSD is supported by a fellowship from UNCF-Merck.
Abbreviations
- ApoD
apolipoprotein D
- AMPA
α-amino-3-hydroxyl-5-methyl-4-isoxazolepropionate
- CNP
2',3'-cyclic nucleotide 3'-phophodiesterase
- CNS
central nervous system
- Ct
comparative cycle threshold
- DMEM
Dubecco's modified Eagle's medium
- DFMO
α-di-fluoro-methyl-ornithine
- FBS
fetal bovine serum
- HPRT
hypoxanthine phosphoribosyl transferase
- IL
interleukin
- INOS
inducible nitric oxide synthase
- LPS
lipopolysaccharide
- MG
microglia
- MP
macrophage
- NMDA
N-Methyl-D-aspartic acid
- ODC
ornithine decarboxylase
- PE
phycoerythrin
- qPCR
quantitative real-time PCR
- SPF
specific pathogen free
- SSAT
N1-spermine-spermidine acetyl transferase
- TLR
toll-like receptor
- TNF
tumor necrosis factor
- TREM
Triggering Receptor Expressed on Myeloid cells
Footnotes
Publisher's Disclaimer: This is a PDF file of an unedited manuscript that has been accepted for publication. As a service to our customers we are providing this early version of the manuscript. The manuscript will undergo copyediting, typesetting, and review of the resulting proof before it is published in its final citable form. Please note that during the production process errors may be discovered which could affect the content, and all legal disclaimers that apply to the journal pertain.
All authors declare that there are no conflicts of interest.
REFERENCES
- Bernstein H-G, Muller M. The cellular localization of the L-Ornithine Decarboylase/Polyamine System in Normal and Diseased Central Nervous Systems. Progress in Neurobiology. 1999;57:485–505. doi: 10.1016/s0301-0082(98)00065-3. [DOI] [PubMed] [Google Scholar]
- Bistulfi G, Diegelman P, Foster BA, Kramer DL, Porter CW, Smiraglia DJ. Polyamine biosynthesis impacts cellular folate requirements necessary to maintain S-adenosylmethionine and nucleotide pools. FASEB J. 2009;23:2888–2897. doi: 10.1096/fj.09-130708. [DOI] [PMC free article] [PubMed] [Google Scholar]
- Bussiere FI, Chaturvedi R, Cheng Y, et al. Spermine causes loss of innate immune response to Helicobacter pylori by inhibition of inducible nitric-oxide synthase translation. JBC. 2005;280:2409–2412. doi: 10.1074/jbc.C400498200. [DOI] [PubMed] [Google Scholar]
- Cai D, Deng K, Mellado W, Lee J, Ratan RR, Filbin MT. Arginase I and polyamines act downstream from cyclic AMP in overcoming inhibition of axonal growth MAG and myelin in vitro. Neuron. 2002;35:711–719. doi: 10.1016/s0896-6273(02)00826-7. [DOI] [PubMed] [Google Scholar]
- Carson MJ, Bilousova TV, Puntambekar SS, Melchoir B, Doose JM, Ethell IM. A rose by any other name: the potential consequences of microglial heretogeneity during CNS health and disease. Neurotherapeutics. 2007;4:571–579. doi: 10.1016/j.nurt.2007.07.002. [DOI] [PMC free article] [PubMed] [Google Scholar]
- Carson MJ, Crane J, Xie AX. Modeling CNS microglia: the quest to identify predictive models. Drug Discov Today Dis Models. 2008;5:19–25. doi: 10.1016/j.ddmod.2008.07.006. [DOI] [PMC free article] [PubMed] [Google Scholar]
- Carson MJ, Reilly CR, Sutcliffe JG, Lo D. Mature microglia resemble immature antigen-presenting cells. Glia. 1998;22:72–85. doi: 10.1002/(sici)1098-1136(199801)22:1<72::aid-glia7>3.0.co;2-a. [DOI] [PubMed] [Google Scholar]
- Carson MJ, Sutcliffe JG, Campbell IL. Microglia stimulate naïve T-cell differentiation without stimulating T-cell proliferation. J. Neurosci. Res. 1999;55:127–134. doi: 10.1002/(SICI)1097-4547(19990101)55:1<127::AID-JNR14>3.0.CO;2-2. [DOI] [PubMed] [Google Scholar]
- Carson MJ, Thrash JC, Lo D. Analysis of microglial gene expression: identifying targets for CNS neurodegenerative and autoimmune disease. Am J Pharmacogenomics. 2004;4:321–330. doi: 10.2165/00129785-200404050-00005. [DOI] [PubMed] [Google Scholar]
- Clarkson AN, Liu H, Pearson L, Kapoor M, Harrison JC, Sammut IA, Jackson DM, Appleton I. Neuroprotective effects of spermine following hypoxic-ischemic-induced brain damage: a mechanistic study. FASEB J. 2004;18:1114–1116. doi: 10.1096/fj.03-1203fje. [DOI] [PubMed] [Google Scholar]
- Deng K, He H, Qui J, Lorber B, Bryson JB, Filbin MT. Increased synthesis of spermine as a result of upregulation of arginase I promotes axonal regeneration in culture and in vivo. J. Neurosci. 2009;29:9545–9552. doi: 10.1523/JNEUROSCI.1175-09.2009. [DOI] [PMC free article] [PubMed] [Google Scholar]
- Doyle KM, Shaw GG. Investigation of the involvement of the N-methyl-D-aspartate receptor macrocomplex in the development of spermine-induced CNS excitation in vivo. Br J Pharmacol. 1996;117:1803–8. doi: 10.1111/j.1476-5381.1996.tb15358.x. [DOI] [PMC free article] [PubMed] [Google Scholar]
- El Khoury J, Toft M, Hickman SE, Means TK, Terada K, Geula C, Luster AD. CCR2 deficiency impairs microglial accumulation oand accelerates progression of Alzheimer-like disease. Nat Med. 2007;13:432–438. doi: 10.1038/nm1555. [DOI] [PubMed] [Google Scholar]
- Ganfornina MD, Do Carmo S, Lora JM, Torres-Schumann S, Vogel M, Allhorn M, Gonzalez C, Bastiani MJ, Rassart E, Sanchez D. Apolipoprotein D is involved in mechanisms regulating protection from oxidative stress. Aging cell. 2008;7:506–515. doi: 10.1111/j.1474-9726.2008.00395.x. [DOI] [PMC free article] [PubMed] [Google Scholar]
- Gao Y, Deng K, Hou J, Bryson JB, Barco A, Nikulina E, Spencer T, Mellado W, Kandel ER, Filbin MT. Activated CREB is sufficient to overcome inhibitors in myelin and promote spinal axon regeneration in vivo. Neuron. 2004;44:609–621. doi: 10.1016/j.neuron.2004.10.030. [DOI] [PubMed] [Google Scholar]
- Georgiev D, Taniura H, Kambe Y, Takarada T, Yoneda Y. A critical importance of polyamine site in NMDA receptors for neurite outgrowth and fasciculation at early stages of P18 neuronal differentiation. Exp Cell Res. 2008;314:2603–2617. doi: 10.1016/j.yexcr.2008.06.009. [DOI] [PubMed] [Google Scholar]
- Gilad GM, Gilad VM. Astroglia growth retardation and increased microglia proliferation by lithium and ornithine decarboxylase inhibitor in rat cerebellar cultures: cytotoxicity by combined lithium and polyamine inhibition. J. Neurosci. Res. 2007;85:594–601. doi: 10.1002/jnr.21152. [DOI] [PubMed] [Google Scholar]
- Ginhoux F, Greter M, Leboeuf M, Nandi S, See P, Gokhan S, Mehler MF, Conway SJ, Ng LG, Stanley ER, Samokhvalov IM, Merad M. Fate mapping analysis reveals that adult microglia derive from primitive macrophages. Science. 2010;330:841–845. doi: 10.1126/science.1194637. [DOI] [PMC free article] [PubMed] [Google Scholar]
- Graeber MB. Changing face of microglia. Science. 2010;330:783–788. doi: 10.1126/science.1190929. [DOI] [PubMed] [Google Scholar]
- Hasko G, Kuhel DG, Marton A, Nemeth ZH, Deitch EA, Scazbo C. Spermine differentially regulates the production of interleukin-12.40 and interleukin-10 and suppresses the release of the T-helper 1 cytokine interferon gamma. Shock. 2000;14:144–149. doi: 10.1097/00024382-200014020-00012. [DOI] [PubMed] [Google Scholar]
- Khaing ZZ, Fidler L, Nandy M, Phillips GR. Structural stabilization of CNS synapses during postnatal development in rat cortex. J. Neurochem. 2006;98:471–480. doi: 10.1111/j.1471-4159.2006.03898.x. [DOI] [PubMed] [Google Scholar]
- Kim GH, Komotar RJ, McCullough-Hicks ME, Otten ML, Starke RM, Kellner CP, Garrett MC, Merkow MB, Rynkowski M, Dash KA, Connolly S. The role of polyamine metabolism in neuronal injury following cerebral ischemia. Can J Neurol Sci. 2009;36:14–19. doi: 10.1017/s0317167100006247. [DOI] [PubMed] [Google Scholar]
- Lee Y, Sayre LM. Reaffirmation that metabolism of polyamines by bovine plasma amine oxidase occurs at the primary amino termini. J Biol Chem. 1998;273:19489–19489. doi: 10.1074/jbc.273.31.19490. [DOI] [PubMed] [Google Scholar]
- Manni A, Washington S, Mauger D, Hackett DA, Verderame MF. Cellular mechanisms mediating the anti-invasive properties of ornithine decarboxylase inhibitor alpha – difluromethylornithine (DFMO) in human breast cancer cells. Clin.Exp.Metastasis. 2004;24:461–467. doi: 10.1007/s10585-004-2724-3. [DOI] [PubMed] [Google Scholar]
- Moinard C, Cynober L, de Bandt JP. Polyamines: metabolism and human disease. Clin Nutr. 2005;24:184–97. doi: 10.1016/j.clnu.2004.11.001. [DOI] [PubMed] [Google Scholar]
- Mony L, Kew JN, Gunthorpe MJ, Paoletti P. Allosteric modulators of NR2B-containing NMDA receptors: molecular mechanisms and therapeutic potential. BJP. 2009;157:1301–1317. doi: 10.1111/j.1476-5381.2009.00304.x. [DOI] [PMC free article] [PubMed] [Google Scholar]
- Morrison LD, Cao XC, Kish SJ. Ornithine decarboxylase in human brain: influence of aging, regional distribution and Alzheimer's disease. J. Neurochem. 1998;71:288–294. doi: 10.1046/j.1471-4159.1998.71010288.x. [DOI] [PubMed] [Google Scholar]
- Morrison LD, Kish SJ. Brain polyamine levels are altered in Alzheimer's Disease. Neurosci. Letters. 1995;197:5–8. doi: 10.1016/0304-3940(95)11881-v. [DOI] [PubMed] [Google Scholar]
- Pegg AE. Mammalian polyamine metabolism and function. IUBMB Life. 2009;61:880–894. doi: 10.1002/iub.230. [DOI] [PMC free article] [PubMed] [Google Scholar]
- Raible DW, McMorris FA. Oligodendrocyte differentiation and progenitor cell proliferation are independently regulated by cyclic AMP. J Neurosci Res. 1993;34:287–294. doi: 10.1002/jnr.490340305. [DOI] [PubMed] [Google Scholar]
- Rao TS, Cler JA, Mick SJ, Iyengar S, Wood PL. Polyamines modulate events mediated by the N-methl-D-aspartate (NMDA) receptor complex through an ifenprodil-insensitive pathway: in vivo measurements of cyclic CMP in the cerebellum. Neuropharmacology. 1991;30:567–573. doi: 10.1016/0028-3908(91)90074-l. [DOI] [PubMed] [Google Scholar]
- Salimuddin, Nagasaki A, Gotoh T, Isobe H, Mori M. Regulation of the genes for arginase isoforms and related enzymes in mouse macrophages by lipopolysaccharide. Am J Physiol. 1999;277:E110–117. doi: 10.1152/ajpendo.1999.277.1.E110. [DOI] [PubMed] [Google Scholar]
- Schmid CD, Melchoir B, Masek K, Puntambekar SS, Danielson PE, Lo DD, Sutcliffe JG, Carson MJ. Differential gene expression in LPS/IFNγ activated microglia and macrophages: in vitro versus in vivo. J. Neurochem. 2009;109(s1):117–125. doi: 10.1111/j.1471-4159.2009.05984.x. [DOI] [PMC free article] [PubMed] [Google Scholar]
- Melchior B, Garcia AE, Hsiung BK, Lo KM, Doose JM, Cameron Thrash J, Stalder AK, Staufenbiel M, Neumann H, Carson MJ. Dual induction of TREM2 and tolerance-related transcript, Tmem176b in amyloid transgenic mice: implications for vaccine-based therapies for Alzheimer's disease. ASN NEURO. 2010;2:e00037. doi: 10.1042/AN20100010. [DOI] [PMC free article] [PubMed] [Google Scholar]
- Schreiber RC, Boeshore KL, Laube G, Veh RW, Zigmond RE. Polyamines increase in sympathetic neurons and non-neuronal cells after axotomy and enchance neurite outgrowth in nerve growth facor-primed PC12 cells. Neuroscience. 2004;128:741–749. doi: 10.1016/j.neuroscience.2004.07.014. [DOI] [PubMed] [Google Scholar]
- Shin HG, Lu Z. Mechanism of the voltage sensitivity of IRK1 inward-rectifier K= channel block by the polyamine spermine. J Gen Physiol. 2005;125:413–426. doi: 10.1085/jgp.200409242. [DOI] [PMC free article] [PubMed] [Google Scholar]
- Simard AR, Soulet D, Gowing G, Julien JP, Rivest S. Bone marrow-derived microglia play a critical role in restricting senile plaque formation in Alzheimer's disease. Neuron. 2006;49:489–502. doi: 10.1016/j.neuron.2006.01.022. [DOI] [PubMed] [Google Scholar]
- Slotkin TA, Bartolome J. Role of ornithine decarboxylase and the polyamines in vervous system development: a review. Brain Res Bull. 1986;17:307–320. doi: 10.1016/0361-9230(86)90236-4. [DOI] [PubMed] [Google Scholar]
- Soulet D, Rivest S. Polyamines play a critical role in the control of the innate immune response in the mouse central nervous system. J. Cell.Biol. 2003;162:257–685. doi: 10.1083/jcb.200301097. [DOI] [PMC free article] [PubMed] [Google Scholar]
- Spencer T, Filbin MT. A role for cAMP in regeneration of the adult mammalian CNS. J. Anat. 2004;204:49–55. doi: 10.1111/j.1469-7580.2004.00259.x. [DOI] [PMC free article] [PubMed] [Google Scholar]
- Sperber BR, McMorris Fyn tyrosine kinase regulates oligodendroglial cell development but is not required for morphological differentiation of oligodendrocytes. J Neurosci Res. 2001;63:303–312. doi: 10.1002/1097-4547(20010215)63:4<303::AID-JNR1024>3.0.CO;2-A. [DOI] [PubMed] [Google Scholar]
- Slotkin TA, Freibaum BD, Tate CA, Thillai I, Ferguson SA, Cada AM, Seidler FJ. Long-lasting CNS effects of short-term chemical knock-out of ornithine decarboxylase during development: nicotinic cholinergic receptor upregulation and subtle macromolecular changes in adulthood. Brain Res. 2003;981:118–125. doi: 10.1016/s0006-8993(03)02993-7. [DOI] [PubMed] [Google Scholar]
- Szabo C, Southan GJ, Wood E, Theimermann C, Vane JR. Inhibition by spermine of the induction of nitric oxide synthase in J774.2 macrophages. Br. J. Pharmacol. 1994;112:355–356. doi: 10.1111/j.1476-5381.1994.tb13078.x. [DOI] [PMC free article] [PubMed] [Google Scholar]
- Thomas T, Thomas TJ. Polyamines in cell growth and cell death: molecular mechanisms and therapeutic applications. Cell Mol Life Sci. 2001;58:244–258. doi: 10.1007/PL00000852. [DOI] [PMC free article] [PubMed] [Google Scholar]
- Tjandrawinata RR, Hawel L, Byus CV. Regulation of putrescine export in LPS or IFNγ–activated murine monocytic-leukemic RAW 264 cells. Ame. Asso. Immunologists. 1994;152(6):3039–3052. [PubMed] [Google Scholar]
- Virgili M, Crochemore C, Pena-Altamira E, Contestebile A. Regional and temporal alterations of ODC/polyamine system during ALS-like neurodegenerative motor syndrome in G93A transgenic mice. Neurochem Int. 2006;48:201–207. doi: 10.1016/j.neuint.2005.10.004. [DOI] [PubMed] [Google Scholar]
- Wallace HM, Fraser AV. Inhibitors of Polyamine Metabolism: a review article. Amino Acids. 2004;26:353–365. doi: 10.1007/s00726-004-0092-6. [DOI] [PubMed] [Google Scholar]
- Williams K. Interactions of poyamines with ion channels. Biochem J. 1997;325:289–297. doi: 10.1042/bj3250289. [DOI] [PMC free article] [PubMed] [Google Scholar]
- Zhang M, Wang H, Tracey KJ. Regulation of macrophage activation and inflammation by spermine: a new chapter in an old story. Crit Care Med. 2000;28:N60–66. doi: 10.1097/00003246-200004001-00007. [DOI] [PubMed] [Google Scholar]
Associated Data
This section collects any data citations, data availability statements, or supplementary materials included in this article.


