1. Introduction
Due to the recent advances in spin labeling and the increasingly common use of pulsed dipolar spectroscopy (PDS) [1,2], measuring distances between strategic points in biomacromolecules has become routine [1–31]. Mainstream PDS is based on the measurement of the static dipolar interaction between paramagnetic centers, typically spin labels, by either double electron-electron resonance (DEER) or double quantum coherence (DQC) techniques [32,33]. Occasionally, a variety of other electron paramagnetic resonance (EPR) techniques, such as two-pulse electron spin echo (ESE), relaxation-induced dipolar modulation enhancement (RIDME), and “2+1”[34–38] have also been employed. A complete description of PDS, including its practical application and limitations, can be found in the recent literature [2, 3, 10, 18, 38]. Nitroxide radical based labels (LNO) that have been attached to the biomacromolecule of interest either by site-directed spin labeling (in the case of proteins) or by chemical modifications (in the case of DNA and RNA) serve as conventional spin labels [22, 30, 31, 40–42].
Since PDS as a technique for distance mapping in biomacromolecules and is now well established [3, 11, 20, 43–45], the current direction in its development has become centered on increasing the range of measurable distances, while simultaneously decreasing the amount of required sample and making the acquisition itself more robust. Until recently, the maximum distances (dmax) accessible by PDS were around 50–60 Å [3, 23–25]. In most experiments, the minimum concentration of spin labeled molecules was ~0.1–0.2 mM, corresponding to a LNO concentration of ~0.2–0.4 mM, and the acquisition time required to obtain quality time domain patterns (TDP) with reasonable signal to noise (S/N) ratios was as long as 10–20 hours. Increasing the maximum measurable distance, (which has already been realized) [3, 11, 18], requires a simultaneous increase of the measurement time intervals and a decrease in the concentration of labeled molecules. Although the second requirement is relaxed when the distances between labels are relatively constrained, for less rigid cases, a decrease in concentration is necessary to unambiguously disentangle intra- and interpair TDPs. Even a modest increase in distance, necessitating a decrease in concentration, results in significant signal amplitude loss. Because the acquisition time cannot be unlimited, the problem of signal loss must be addressed in some other way in order to measure larger distances. Recently explored methods to accomplish this objective have been based on the use of more sophisticated pulse sequences [4], complete protein deuteration [25], and on performing measurements in Q and W microwave (mw) bands [46, 47] instead of the more commonly used X or Ku bands. Of these, the most significant progress has resulted from the construction of a new W-band instrument with a non-resonant cavity that allows oversized samples [48]. As a result, the absolute and concentration sensitivities become independent of each other, in contrast to the measurements with standard instrumentation. This instrument has allowed to decrease the concentration of LNO to as low as 1 μM, while preserving a high absolute sensitivity due to the higher operational frequency, superior pulse parameters, and an oversized sample. At the average concentration of 1 μM, the contribution of the interpair dipolar interactions becomes practically negligible, and the maximum potentially measurable distances increase from ~60 Å to ~100 Å. Therefore, there is little doubt that with the new pulsed techniques and instrumentation described above, dmax for the standard nitroxide spin labels can be extended to ~100 Å.
In pursuit of the same goal of increasing dmax, we have been developing a different approach based on new Gd(III)-based spin tags (LGd) [49] that have magnetic resonance properties quite different from those of LNO. Although the details of these differences will be discussed later, it is important to note now that the PDS measurements using LGd must be performed in the high magnetic field/high frequency mw bands, e.g., in the Ka/W mw bands (mw frequency (νmw) ~ 30 GHz–90 GHz) in order to avoid complications caused by crystal field interactions (cfi) [50–53]. Previously, we already established that LGd can be used to measure shorter intrapair distances as compared to LNO [49], and the utility of LGd for the intermediate distance range (30–40 Å) was recently demonstrated in the first DEER measurements of Gd-labeled proteins [54].
The techniques for attaching Gd(III) tags to biomacromolecules, while not yet routine, are gradually becoming more so. The covalent attachment of Gd(III)-dipicolinic acid chelates to the cysteinyl sulfurs of two proteins (p75ICD and τC14) has been reported [54], and a number of new methods have been published for labeling biomacromolecules with lanthanide tags for both in- and ex-vivo fluorescence imaging and paramagnetic NMR spectroscopy [55–65]. Here we report the first synthesis of LGd-DNA conjugates, which are similar to LNO-DNA, a biomacromolecular model previously developed for the specific purpose of probing intrapair distances [30–31]. Specifically, we have synthesized the LGd-DNA conjugates having 14 base pairs, which should result in a distance in the range of 50–70 Å between the labels. Finally, the results of PDS (DEER) measurements will be presented within the context of the general application of using Gd(III) as a long distance marker in biomolecules.
2. Experimental
2.1. Gd(III) complexes and oligonucleotide conjugates
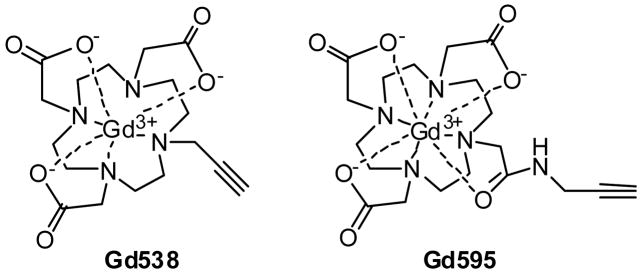
Two different complexes, Gd538 and Gd595 (Figure 1), were chosen as potential Gd(III) tags for further routine investigations of oligonucleotide conjugates. The Gd595 and Gd538 tags were synthesized following reported and modified procedures. While Gd538 has a slightly shorter distance from the Gd(III) ion to the DNA 5′ attachment point (see Fig. S1 of Supporting Information, SI) than Gd595, the latter has substantially weaker cfi, which should make it better suited for PDS measurements. Gd(III) labeled oligonucleotides dT(5′-Gd)-CTA CTG CTT TAG A 3′ and 3′-A-GAT GAC GAA ATC-dT (5′-Gd) were prepared using the conventional phosphoamidite method. Detailed synthetic procedures and annealing conditions are described in the SI. For the DEER measurements, samples of single-stranded and annealed double-stranded Gd(III)-oligonucleotides were prepared in a d2-water/d8-glycerol solution (1:1/v:v) at various concentrations of Gd(III) (from 40 to 160 μM). The water-glycerol solution also contained 50 mM NaCl and 10 mM Tris (pH 7.4). Rapid freezing of the samples in liquid nitrogen resulted in the formation of transparent glasses, ensuring a random distribution of biomacromolecules in the samples. The total sample volume was ~20 μL. The minimal amount of DNA required for a sample preparation was about 1 nmol.
Figure 1.
Structures of the Gd(III) complexes used in this work.
2.2 Pulsed EPR Measurements
Ka-band (νmw ≈ 30 GHz) measurements were performed using a previously described home-built broadband pulsed EPR spectrometer [66]. A zero dead-time four-pulse DEER sequence was used in all DEER measurements [67]. The time separation between the second and third pulses was set at ~7 μs. Currently, this is the maximum possible time separation due to the limited traveling wave tube (TWT) amplifier gate duration [68]. Splitting the TWT gates to achieve greater separations between the mw pulses resulted in slight phase distortions of the ESE signal as a function of the pumping pulse position. These distortions corrupt the dipolar oscillations, and we have refrained from such a manner of measurements in this work. We have to note that this phase problem is specific for our TWT amplifier, which is based on a continuous wave TWT [66,68]. In the majority of Ka-band experiments, the effective durations of both the pumping and observation pulses were ~15 ns. Typical frequency separations (Δν) between the observation (νo) and pumping (νp) frequencies were in the range of 120–150 MHz, at least double the total characteristic spectral width of the pulses. The measurement temperature was ~10 K. At this temperature, the relative population of the 1/2 and −1/2 states is close to the high-temperature limit. The dwell time in all DEER experiments was set to 50 ns, and the repetition frequency, νrep, was 2 kHz, since at higher νrep the signal saturated. A reasonable quality time domain pattern (S/N ≈ 10 for DEER effect) was accumulated during a period of one to four hours with Gd595-DNA. For Gd538-DNA the accumulation time was substantially longer (up to 16 hours).
3. Results and Analysis
3.1 Echo Detected EPR and Primary ESE Measurements
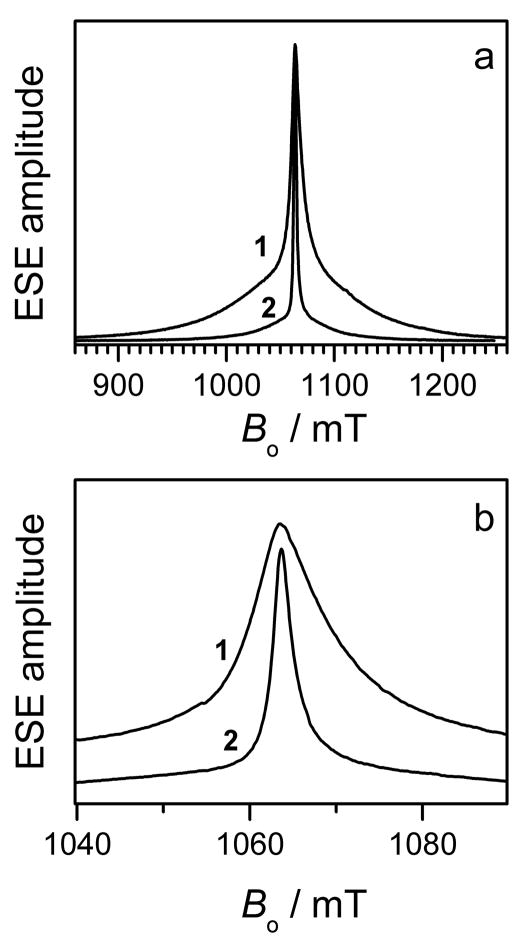
The echo detected EPR spectra of the Gd595- and Gd538-DNA duplexes shown in Fig. 2 a,b are similar to those recorded for nonconjugated Gd595 and Gd538 in our previous work [49]. The appearance of the spectra is similar for all known Gd(III) ions. Specifically, they consist of a central narrow line due to the −1/2 ↔ 1/2 transition that is superimposed on a broad background due to all other transitions. A comprehensive description the Gd(III) EPR spectra would require numerous independent parameters [52, 69, 70]. However, for the purpose of distance determination, which is the goal of this work, a detailed analysis of the spectra is unnecessary. Therefore, only one parameter, D, of the cfi was used. Using standard procedures [52], D can be evaluated as ~200 G and ~400 G for Gd595-DNA and Gd538-DNA, respectively. The former is near the minimum value of the cfi observed for Gd(III) complexes [52]. As is well known, differences in D reflect a change in the Gd(III) complex symmetry, which may, in particular, be caused by differing numbers of water molecules coordinated to the Gd(III). The ratio of D to the external magnetic field, Bo, is rather small (≤0.035) for each compound. This allows the formalism developed for S = 1/2 to be used to describe the DEER effects in the case of Gd(III) [49,50,53].
Figure 2.
(a) Traces 1 and 2, primary ESE field sweep spectra of Gd538-DNA and Gd595-DNA, respectively. (b) central part of the spectra presented in (a). Experimental conditions: mw frequency, 29.628 GHz; mw pulse durations, 20ns; initial time interval between the mw pulses, 200 ns; temperature, 10 K.
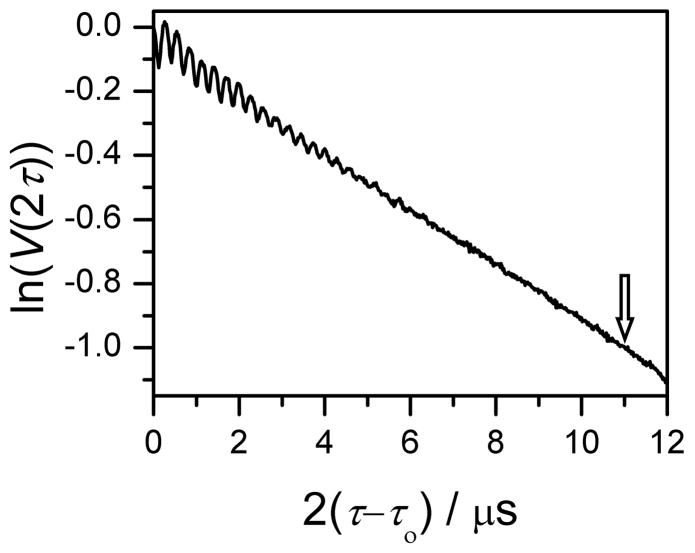
Due to the phase relaxation, the amplitude of the refocused primary echo signal that is used to observe the DEER effect in four-pulse DEER experiments is dependent on the time intervals between the pulses. To evaluate the magnitude of the ESE signal loss as a function of the pulse separation, τ, for our samples, the primary ESE kinetics were investigated. As an example, Fig. 3 depicts the primary ESE kinetics of Gd595-DNA, for which the decay is exponential, exp(−2τ/T2), with the phase relaxation time T2 ≈ 11 μs. As is evident from Fig. 3, the signal amplitude at τ = 7 μs is about 3.6 times smaller than the initial signal amplitude, Vo. For LNO biomacromolecules, the decay is usually non-exponential [71]. In such situations, when discussing the relative sensitivity of DEER experiments with LNO and LGd, the relaxation-induced signal loss for both types of labels should be compared directly.
Figure 3.
Primary ESE kinetics, V(2τ), of Gd595-DNA duplex presented in semi-logarithm coordinates. Experimental conditions: mw frequency, 29.628 GHz; magnetic field, 1068 mT (corresponds to the maximum of the EPR spectrum); mw pulse durations, 20 ns; initial interval between the pulses, τ0=200 ns; temperature, 10 K; concentration of the DNA duplex, 20 μM. Observed ESEEM is due to the interaction of Gd(III) with 2H nuclei of the deuterated solvent. The arrow indicates the time interval, at which the echo signal decreases e times.
3.2 DEER Measurements
3.2.1 Choice of time interval for data collections, concentration of DNA duplexes, and pulse parameters
The minimal time interval for collecting the time domain patterns and the distance to be measured by PDS are related [3,11], To obtain reliable information about the distance between spin labels, the time domain pattern must be recorded for at least a half-period of the dipolar modulation, t1/2, [72], as defined by Eq. 1:
| (1) |
where the distance, r, is in Å. The maximum distance between Gd(III) ions in the DNA duplexes, as estimated from molecular dynamics (MD) simulations (vide infra), does not exceed ~75 Å. Therefore, the minimal time interval for data collection must be at least 4,500 ns. V(t) is a product of the partial kinetics, Vir(t) and Via(t), due to inter- and intrapair dipolar interactions, respectively [72]. While Via(t) contains the desired information about the intrapair distance, Vir(t) represents an unwanted contribution. For data acquisition performed in a limited time interval, the extraction of Via(t) from the collected time domain pattern V(t) is only reliable if the intrapair decay is comparable with or exceeds the interpair decay. Therefore, the label concentration, [Lx], should not exceed the value given by Eq. 2:
| (2) |
where t1/2 is defined by Eq.1. Following this reasoning, the concentration of the DNA duplexes in our experiments should not exceed ~0.1 mM.
The choice of pulse durations (tp) and carrier frequencies of the pumping (νp) and observation (νo) pulses is more complicated. Shorter pulses do not necessarily result in a better S/N ratio for the DEER effect. The maximum absolute DEER effect, η = λVo, is a product of the probability of flipping the spins by the pumping pulse, λ, and the initial (i.e., unaffected by the phase relaxation) amplitude of ESE signal generated by observation pulses, Vo. Although λ increases as shorter pulses are used, the adjustment of the resonator Q-value to accommodate these pulses and the necessary increase of Δν = |νo − νp| result in the loss of Vo (Δν must be large enough, Δν ≥ 2/tp, to avoid interference between the spectra of the observation and pumping pulses). Because of these conflicting factors and other technical issues that are beyond the scope of this paper, the optimal tp and Δν in this work were found to be 15–20 ns and 100–120 MHz, respectively.
3.2.2 DEER Results for the Gd(III)-DNA Duplexes; Qualitative and Quantitave Interpretations and Simulations
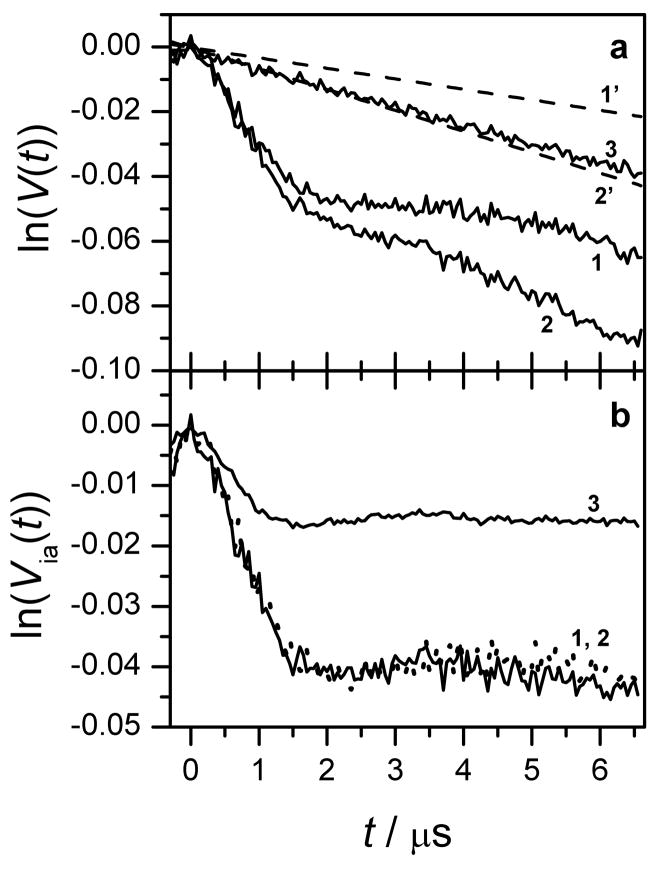
DEER measurements were primarily performed for Gd595-DNA. The broader spectrum of Gd538-DNA (Fig. 2) makes it less suitable for DEER measurements. The DEER kinetics of the Gd595-DNA duplex and of single strands are presented in Figs. 4a,b. In Fig. 4a, the lnV(t) for the single-stranded Gd595-DNA depends linearly on time (trace 3), while for the duplex (traces 1 and 2) it shows about one period of a fast-damping oscillation superimposed on a monotonous decay. The qualitative difference between these time domain patterns is due to the dipolar interaction between the Gd(III) ions within the tagged DNA duplex.
Figure 4.
(a) Traces 1 and 2, DEER kinetics (in semi-logarithmic coordinates) collected for 20 μM and 40 μM solutions of the double-stranded Gd595-DNA (corresponds to 40 μM and 80 μM of single stranded Gd595-DNA). Trace 3, DEER kinetics of 40 μM solution of the single-stranded Gd595-DNA. Trace 1′, linear approximation of the difference between traces 2 and 1. Trace 2′ is obtained by multiplying trace 1‘ by the ratio of concentrations of samples 1 and 2.
(b) Traces 1 and 2, intrapair TDPs, ln(Via(t)), for the double-stranded Gd595-DNA obtained by subtraction of traces 1′ and 2′ from traces 1 and 2 of Fig 4a, respectively. Trace 3 is the intrapair kinetics for the Gd538-DNA duplex. Experimental conditions: observation pulses, 20 ns; pumping π-pulse, 15 ns; temperature, 10 K; pumping mw frequency, 29.98 GHz; observation mw frequency, 29.86 GHz; the pumping pulse is in resonance with the maximum of the EPR spectrum.
To determine the distance or the distribution of distances between the Gd(III) ions within a single duplex, V(t)ia must be extracted from the total kinetics, V(t) = Vir(t)×Via(t). At the first glance, this problem appears trivial. For example, in 3D space, lnVir(t) is a linear function of t, and its slope linearly depends on the average concentration (as opposed to local concentration) of the paramagnetic species, C, as given by Eq. 3 [72–74]:
| (3) |
where t is in ns and C in mM [72–74]. In contrast, Via(t) does not depend on C, and its asymptote, , is independent of the details of the distance distribution [44]:
| (4) |
Therefore, lnVir(t) can be evaluated from lnV(t) at t long enough for Via(t) to reach its asymptotic value. The obtained lnVir(t) is then linearly extrapolated to t = 0, translated vertically to satisfy the condition Vir(0) = lnV(0) (to account for the fact that , see Eq. (4)), and subtracted from the total kinetics. In another approach, Vir(t) can be calculated using Eq. (3) from the known C and the estimated value of λ. In practice, however, even a small inaccuracy in the evaluation of Vir(t) could result in a substantial distortion of Via(t) and, subsequently, in an amplified distortion of the distance distribution function [11].
A more accurate way to separate the two TDPs is to apply the fundamental property of V(t) that Via(t) does not depend on the concentration, while the slope of lnVir(t) is proportional to the concentration. The results obtained using such an approach are presented in Figs. 4a,b. Fig. 4b shows that Via(t) obtained from samples of different concentrations are indeed identical to each other. The unambiguous separation of Via(t) from Vir(t) was only possible because the contribution of the interpair dipolar interaction was relatively small (due to the very low concentration of Gd(III)), consistent with the discussion presented in section 3.2.1. Furthermore, if a space dimensionality for a dipolar interaction is unknown, the processing of a set of V(t) traces collected at various concentrations would be the best way of isolating Via(t) [75].
Similar experiments and processing were also performed for Gd538-DNA. The most important result of the processing, the Via(t) kinetics, is presented in Fig. 4b, trace 3. As evident from Fig. 4b, the Via(t) traces for Gd538-DNA and Gd595-DNA show shallow, poorly defined dipolar modulations. The normalized kinetics for each duplex level off toward the end of the time interval of the measurements, indicating that the time interval was sufficiently large to reach an asymptote. The shallow modulations indicate that the distances between labels are widely distributed. Nevertheless, the characteristic distance between labels can be evaluated using Eq. 1 and the position of the first minimum of the normalized kinetics. This evaluation shows that the Gd(III)-Gd(III) distance for Gd595-DNA is about 60–63 Å. For Gd538-DNA this distance is slightly smaller.
To obtain a detailed information on the distribution function, a more rigorous approach is required. One method is to solve the problem directly, by comparing the experimental Via(t) with those calculated for various probe functions P(r) using Eq. (5) [72]:
| (5) |
where x ≡ cosϑ, ϑ is the angle between the radius-vector connecting the spin-labels and the external magnetic field and value of α depends on choice of units for time and distance.
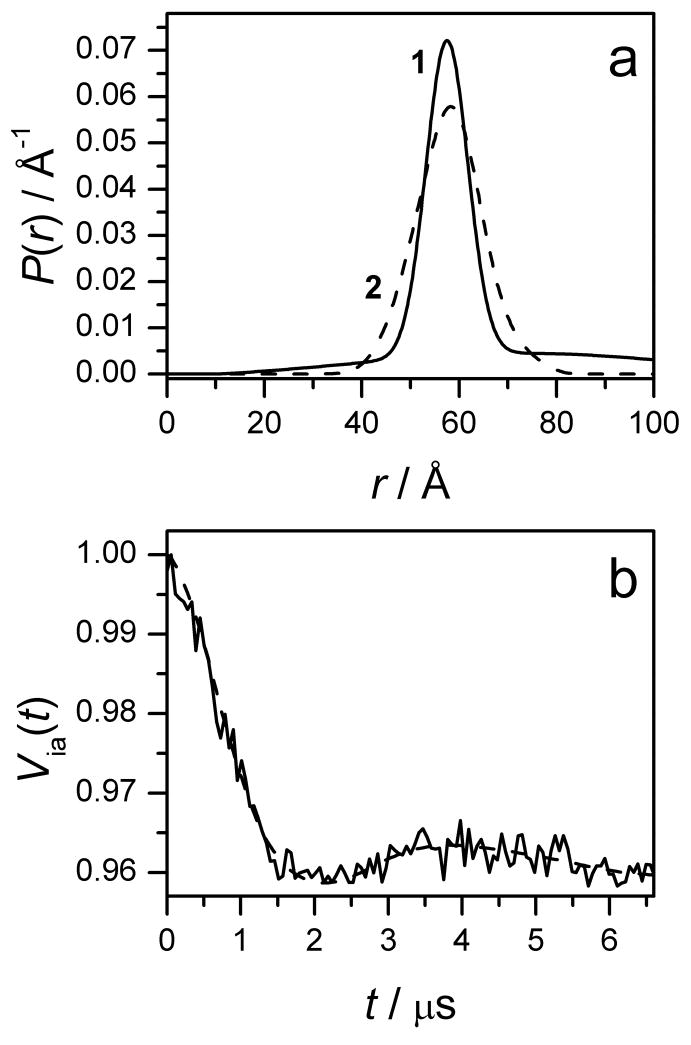
An alternative method is to solve the inverse problem, i.e. find P(r) by applying a truncated singular value decomposition (SVD) or a regularization procedure to Eq.5 [76,77]. The free software packages from ETH [78] and ACERT [79] permit both direct and inverse solutions of Eq. 5. As an example, the possible P(r) found using the DeerAnalysys program from ETH [78] is presented in Fig. 5a, and the Via(t) calculated with this P(r) is presented in Fig. 5b along with the experimental Via(t). The P(r) shown in Fig. 5b is the output of the “two-Gaussian fit option”, and is the sum of two Gaussians that are centered at 73 Å and 57 Å, with a weight ratio of 0.34:0.66. Other parameters of P(r) are: x̄= 58.3 Å and , where x̄ and are the first and second moments, and σ is a characteristic relative width of the distribution. In addition, we have employed other options (Approximate Pake Transform, Tikhonov regularization) for TDP processing, which are also available in the DeerAnalysis program. As anticipated, the resulting P(r) have different appearances, but the first and second moments remain essentially identical, x̄ ≈ 59 Å and σ ≈ 0.2. Therefore, in agreement with our simple evaluation, the average distance between Gd(III) ions in the double-stranded Gd595-DNA is close to 59 Å, and the average deviation from this value is about ±12 Å.
Figure 5.
(a) Trace 1, distance distribution function P(r) obtained from Via(t) of the double-stranded Gd595-DNA (average of kinetics 1 and 2 presented in Fig. 4b) using “the two-Gaussian fit option” of DeerAnalysys software package [78]. P(r) is the sum of two Gaussians, with (xo, δ) = (57.3 Å, 6 Å) and (73 Å, 50 Å), where xo and δ are the center and width of the Gaussians [78]. The ratio of weights (area integrals) for these Gaussians is 0.64:0.36. Trace 2, distance distribution function obtained by MD simulations. For this function x̄ = 57.6 Å and .
(b) Experimental (solid) and calculated (dashed) intrapair kinetics for the double-stranded Gd595-DNA. The calculated kinetics corresponds to the distribution function shown by trace 1 in Fig. 5a.
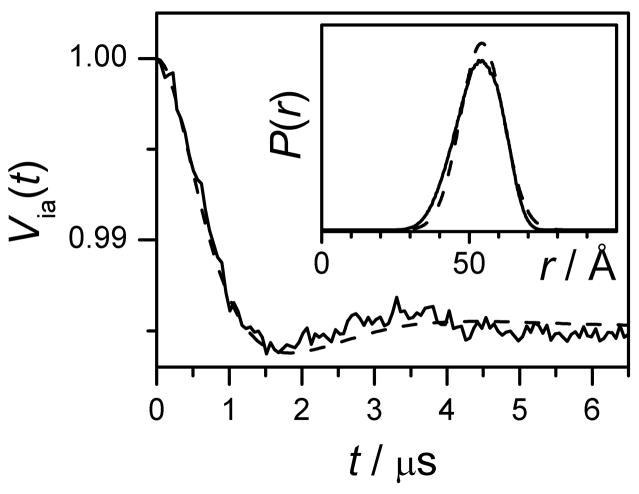
For the double-stranded Gd538-DNA, the intrapair TDP (Fig. 6) is similar in shape to that of Gd595-DNA, although the magnitude of asymptotic decay is substantially smaller. This occurs due to the lesser spin flip probability caused by a much broader EPR spectrum. The distance distribution between Gd(III) ions in Gd538-DNA is also found to be similar to that of Gd595-DNA, and is presented in Fig. 6. However, the most probable distance for the Gd538-DNA is slightly shorter than for the Gd595-DNA, which may reflect the slightly shorter Gd(III) tag linker.
Figure 6.
Experimental (solid) and calculated (dashed) Via(t) for the double-stranded Gd538-DNA. The calculated kinetics is based on the distribution function shown in the Insert by dashed line.
Insert: dashed line, distance distribution function, P(r), obtained from TDP using “1-Gaussian fit option” of DeerAnalysys software package. The Gaussian fit parameters are (xo, δ) = (54.3 Å, 7.5 Å). Solid line, P(r) obtained by MD simulations.
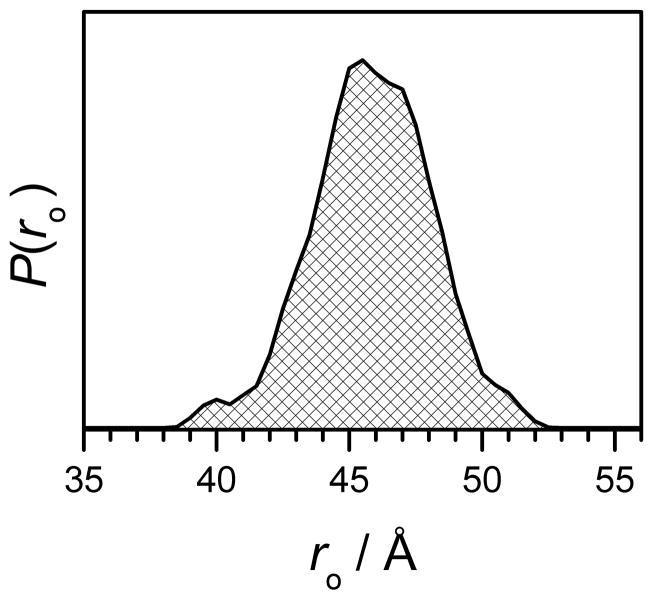
To evaluate, how realistic the P(r) derived from the TDP processing are, we performed MD calculations of Gd(III)-Gd(III) distance distribution functions in a two-stage manner, similar to the one described in ref [30]. First, MD calculations were used to estimate the distance distributions between the DNA 5′ attachment points. Second, additional distance distributions from allowed rotations around the single bonds of the Gd(III) labels were taken into account (vide infra). The starting coordinates for the unmodified DNA oligomer were created using the NAB molecular manipulation language, which is included as a part of the AmberTools package [80], and the coordinates for each of the Gd(III) tags were prepared manually and optimized using the MarvinSketch molecular modeling software [81]. Water molecules that are coordinated to Gd(III) were not included in the label models since their presence would neither alter the overall structure of the label nor affect the resultant Gd(III)-Gd(III) distances of the completed models. The Gd(III)-DNA models themselves were prepared by attaching the Gd(III) tags to the DNA 5′ ends, as presented in Fig. 7 and Fig. S1. These manipulations were carried out by shifting and combining the individual Gd(III) tags and DNA coordinates relative to each other, where the 5′-DNA carbon to Gd(III) linker distance was defined to be ~1.5 Å. The MD simulation for the DNA model was performed using the OpenMM package [82], using the Amber96 force field and the included implicit water solvent model. The temperature in simulations was defined as 295.15 K, and the simulation time was set to 20 ns, with a time step of 2 ps. For each of the simulated configurations, the 5′C-5′C distance of the DNA duplex was measured. The number of occurrences having a given distance, P(r0), over the total simulation time is presented in Fig. 8. From the set of configurations generated in this stage, we selected structures with various distances between the tag attachment points, then included the tags and allowed independent rotations around three single bonds, shown by the arrows in Fig. S1. The rotations for each individual configuration yield a partial distribution function P(r|ro), which is the probability of occurrence of a Gd(III)-Gd(III) distance r, when the distance between the 5′C-5′C points of DNA is ro. The total distribution function between metal ions, P(r), is:
| (6) |
where P(ro) is shown in Fig. 8. The distributions P(r) calculated for Gd595-DNA and Gd538-DNA are shown in Figs. 5 and 6, respectively. The distribution functions obtained from simulations and from processing intrapair kinetics are in close agreement, supporting our claim that distances up to at least ~60 Å can be readily detected.
Figure 7.

Example of structure of double-stranded Gd595-DNA.
Figure 8.
Distance distribution between the tag attachment points of a double-stranded DNA obtained by MD simulations.
In principle, the experimental data, processing, and simulations presented above are already adequate to support our claim that LGd can compete with LNO in long distance measurements. However, to be more certain about the dmax increase using LGd, it is necessary to discuss the quantitative aspects of the obtained results.
3.3. Spin flip probability, asymptotic DEER effect, and related issues
The spin flip probability, λ, is a quantitative parameter in DEER experiments that only depends on the shape of EPR spectra and the mw pulse strengths and durations. It can be evaluated based on these parameters, yielding the calculated value of λ, λc [73]. Independently, it can be determined experimentally from the ESE signal decay caused by the interpair dipolar interactions (λ ≡ λd, Eq. 3) and from the intrapair kinetics asymptote, (λ ≡ λp, Eq. 4). It is important to note that λc and λd are usually in good agreement if the resonator has enough bandwidth to not distort the pulses [11,73]. On the other hand, the analysis of numerous published DEER data for nucleic acids labeled by LNO shows that in many cases λp < λc ≈ λd. Usually, the ratio λp/λc is between 1 and 0.5, although even smaller ratios have been reported [83].
Curiously, this issue has never been explicitly discussed in the context of DEER measurements of labeled nucleic acids. The deviation of λp/λc from unity indicates that either the chosen time base was too short for the measurements or that the complementary DNA strands were not completely coupled. Our examination of the published data suggests that the latter explanation is most probably the case.
In the case of Gd(III) (S = 7/2), the total spin flip probability is a sum of the partial spin flip probabilities for transitions between various electronic spin states [53]. In principle, λc for Gd(III) can be calculated using the simulated shapes of the EPR subspectra. Our experience shows, however, that such a procedure is quite involved, and that it is easier to find λ ≡ λd from the experimental interpair TDP. As discussed above, λd ≈ λc, and therefore λd will be used below in place of λc. Based on the data presented in Fig. 4a, and assuming that the concentration of Gd(III) is equal to that of DNA single strands (as determined by UV-absorption, see SI), λd for Gd595-DNA was estimated to be 0.075–0.08. At the same time, the asymptotic value, λp, is about 0.042, as follows from the TDP presented in Fig. 4b. Thus, the resulting ratio λp/λd = 0.5–0.6 is similar to that usually observed for nitroxide-labeled DNA conjugates [83]. The most likely reason for the deviation of λp/λd from unity is the incomplete coupling of single strands.
In our particular case, since DNA strands are modified with Gd(III) complexes on its 5′ end, two bulky Gd(III) complexes may change the annealing dynamics and implement steric effect on the annealing process. Although a complete coupling could possibly be achieved by some variation in the buffer, salt content, water/glycerol ratio, the annealing protocol, and additional purification, attaining this goal was not our intention in this work. The purpose of this discussion is, rather, to emphasize that the intrapair DEER effect in our measurements is reduced by about 40%–50%. This will be taken into account later, in the evaluation of dmax.
3.4 Evaluation of dmax between Gd(III) Labels by DEER Measurements
We have demonstrated above that LGd allow the distances of at least up to 60 Å to be measured, and that a reasonable S/N (~10) for the intrapair DEER effect can be reached in a few hours of signal accumulation, while keeping the average concentration low enough to unambiguously eliminate the contribution of interpair interactions. Based on the present results, we can now judiciously evaluate, whether dmax can be further expanded by minor instrumental modifications. The simplest modification would be to replace the volume resonators used in this work by dielectric resonators, similar to those used in commercial instrumentation [84]. In dielectric resonators, the bandwidth can be readily increased by a factor of three – four, allowing shorter pulses. This should result in an increase of the absolute DEER effect by about an order of magnitude, as explained in the following section. The anticipated increase of the total DEER effect (~20×) that would result from the implementation of a dielectric resonator (~10× increase) and from the possible improvement in the pairing of the DNA strands (~2× increase) should allow an increase in dmax by a factor of ~1.4, to ~85–100 Å. This estimate takes into account the loss of the ESE signal due to the increase of the time base and the proportional decrease of the sample concentration, and assumes the acquisition time to remain constant. Another possible option would be to perform measurements at higher-frequency mw bands (V,W). In spite of obvious benefits of having a decreased width of the subspectrum of −1/2 ↔ 1/2 transition, however, the use of higher frequency bands results in adverse effects such as population polarization (although this might potentially be dealt with, if the recently proposed fast field sweep technique [85] is applied). If the linewidth of the −1/2 ↔ 1/2 transition is already small in the Ka band (as in the case of Gd595-DNA), the possible advantages of using higher frequency bands become difficult to estimate a priori.
3.5. Tentative comparison of dmax within LNO and LGd-Labeled Biomacromolecules
So far in our discussion we have consciously avoided making any direct comparisons between using LNO and LGd for measuring distances. Such comparisons are complex and require a more detailed investigation. However, some arguments can be presented that reveal the potential advantages of LGd over LNO for long distance measurements under the optimal available conditions for each type of tag. The first relevant parameter that can be compared is the maximal absolute DEER effect, η = λVo. In this case, it is assumed that the experiments for each type of label are performed at Ka-band using the existing spectrometer [66], and the resonators used in these measurements are specifically optimized for each label type. In the four pulse DEER experiment, the initial amplitude of the echo signal, Vo, is determined by [86]:
| (7) |
and the spin flip probability is
| (8) |
In these expressions g(Δω) is the shape of the normalized EPR spectrum, and
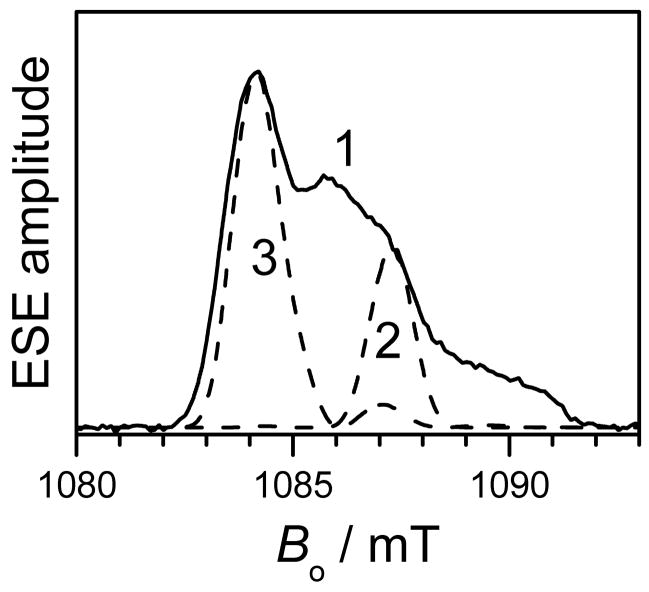
where ω1k and tpk are the amplitude and duration of the kth pulse, respectively. The experimental conditions (i.e., the pulse durations and their positioning in the EPR spectra) should be selected in such a way as to maximize η. However, while maximizing η, the following conditions should be satisfied: (i) the carrier frequencies of the pumping and observation pulses must be sufficiently far apart, so that there is no interference between them, and (ii) the resonator bandwidth must be appropriate for the chosen pulse durations. One possible pulse arrangement to optimize η for LNO is shown in Fig. 9. Here, all of the pulses have equal durations of 16 ns. Although the instrument can produce shorter pulses even with a volume resonator [66], the LNO EPR spectrum is not broad enough to accommodate them. The difference between the carrier frequencies of the pumping and observation pulses is set to about 85 MHz, hence the spectral overlap of the pulses is negligible. This setup results in λ ≈ 0.4 and Vo ≈ 0.15 (these parameters can be readily obtained by integrating the spectral profiles presented in Fig. 9), giving ηNO ≈ 0.06 (more accurately, 0.062).
Figure 9.
One of the possible pulse setups to maximize the DEER effect for LNO in Ka-band. Trace 1, Ka-band ESE-detected field sweep spectrum; trace 2, excitation profile of the observation three-pulse sequence (π/2, π, π); trace 3, excitation profile of the pumping π-pulse. All pulses have durations of 16 ns.
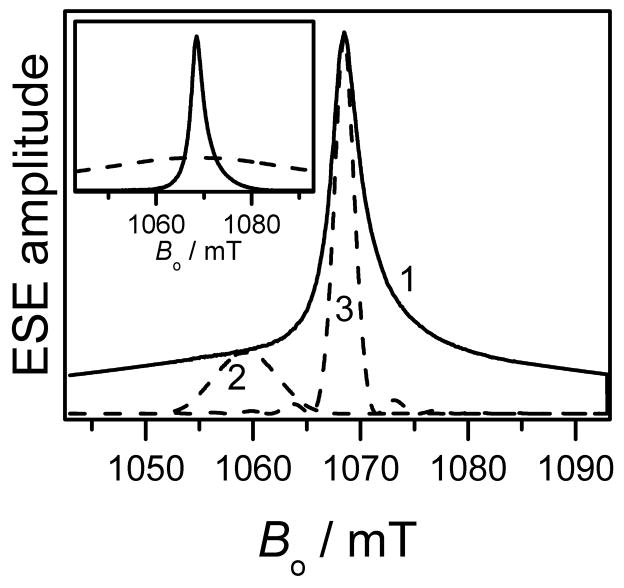
The calculations of Vo and λ for LGd are more complicated than for LNO. In a standard experiment, the Gd(III) spectrum is usually recorded after optimizing B1 at the position of the maximum echo amplitude, which essentially corresponds to the −1/2 ↔ 1/2 transition. The subspectra of all other transitions are therefore collected under non-optimal conditions, resulting in a loss of the signal amplitude. To account for this loss in calculations of λ and Vo, we introduced empirical corrections explained below. First, the narrow subspectrum of the −1/2 ↔ 1/2 transition, g(Δω)1/2, was separated from the broad subspectrum of all other transitions, g(Δω)o (Fig. 10 insert). The values of Vo and λ for this g(Δω)1/2, and λ(1/2), respectively, were calculated using Eqs. 7 and 8. The values of Vo and λ calculated for g(Δω)o, and λ(o), respectively, were corrected using the correction factor determined from comparison of calculated λ(o) with the experimental ones. The latter values were evaluated from the kinetics of interpair dipolar interactions. The correction factor was found to be about 1.2–1.3. Strictly speaking, the correction factor should depend on the position in the spectrum, since the composition of the spectrum varies with the magnetic field. Experimentally, however, we plan to set the frequency separation between the pumping and observation pulses within the range of 200–400 MHz, where the variation in the composition of g(Δω)o can be neglected.
Figure 10.
One of the possible pulse setups for optimized DEER for LGd in Ka-band. Trace 1, part of ESE-detected field sweep spectrum of Gd595-DNA; trace 2, excitation profile of the observation three-pulse sequence (π/2, π, π); trace 3, excitation profile of the pumping π-pulse. The pumping pulse duration is 10 ns. All of the observation pulses are 3 ns long.
Insert: Solid trace, sub-spectrum of the −1/2 ↔ 1/2 transition, g(Δω)1/2; dashed trace, sub-spectrum of all other transitions, g(Δω)O.
The broad Gd(III) spectrum allows to apply substantially shorter pulses than those which can be used in the case of LNO. As a consequence, the full instrument potential can be used. Due to the higher transition probabilities, the π-pulse generated by our instrument could be as short as 3 ns if a dielectric resonator were implemented. Fig. 10 illustrates the pumping and observation profiles and pulse positioning if a classic DEER scheme were used, i.e. when the pumping pulse is applied in resonance with the sharp central transition, while the observation frequency is set in resonance with the broad parts of the spectrum. The durations of the pumping and observation pulses were chosen to be 10 ns and 3 ns, respectively. The frequency separation between these pulses was set to ~225 MHz in order to prevent their interference. The values of λ and Vo for this pulse arrangement are ~0.16 and ~0.08, respectively, resulting in η ≈ 1.3 × 10⁻². Therefore, ηGd is about five times smaller than ηNO. To accommodate the shorter pulses, the resonator bandwidth must be increased to at least 450 MHz (vs. 130 MHz for LNO) and the necessary Q-value adjustment would result in additional signal loss by a factor of 1.87, which is a square root of the bandwidth ratio. With this potential loss, the calculated ratio (ηGd/ηN0) is about 1/9.
So far the use of Gd(III) tags does not offer any advantages as compared with LNO. Three more parameters affect the signal amplitude, however, and must be considered. Two of these are the measurement temperature (T) and the repetition frequency, νrep, which affect Vo according to . At cryogenic temperatures, the spin lattice relaxation time of LNO, T1, is rather long and νrep should be adjusted appropriately to avoid the signal saturation. In the experiments reported to date, the measurement temperatures have been varied from 35 K to 77 K (the commonly used temperature is 50 K), and νrep was varied from 60 Hz to 1 kHz. The choice of the optimal νrep depends on T1 and the organization of the pulse sequence itself (e.g. the reprogramming time, the number of acquisitions per scan, etc.). A reasonable νrep should be equal or less than 1/(3T1). For LNO, at the commonly used measurement temperature of 50 K, T1 ≈ 1 × 10⁻³ s [11] and νrep should be about 300 Hz. The data acquisition parameters close to these were recently reported [23–25]. For Gd(III) ions, the spin lattice interaction is substantially more efficient, and measurements can be performed at 10 K with νrep ~ 2 KHz. The relative signal gain (compared to the optimal one for LNO) due to the higher νrep and lower temperature is . This gain already overcompensates by the factor of 1.4 for the loss in η (1:9).
The phase relaxation is the third parameter affecting the signal amplitude. The loss of ESE signal due to the phase relaxation strongly depends on the nature of the biomacromolecule and the solvent [70]. To our knowledge, the phase relaxation for LNO-DNA dissolved in a d2-water/d8-glycerol solution has not yet been measured. Thus, the most appropriate set of data to use is that for LNO attached to the sites W16C and W95C of human carbonic anhydrase II [71]. These labels are exposed to the solvent and have the least efficient phase relaxation compared to other less exposed sites. As mentioned, the phase relaxation kinetics of LNO is not exponential, and therefore the signal loss must be directly evaluated for the given pulse separation.
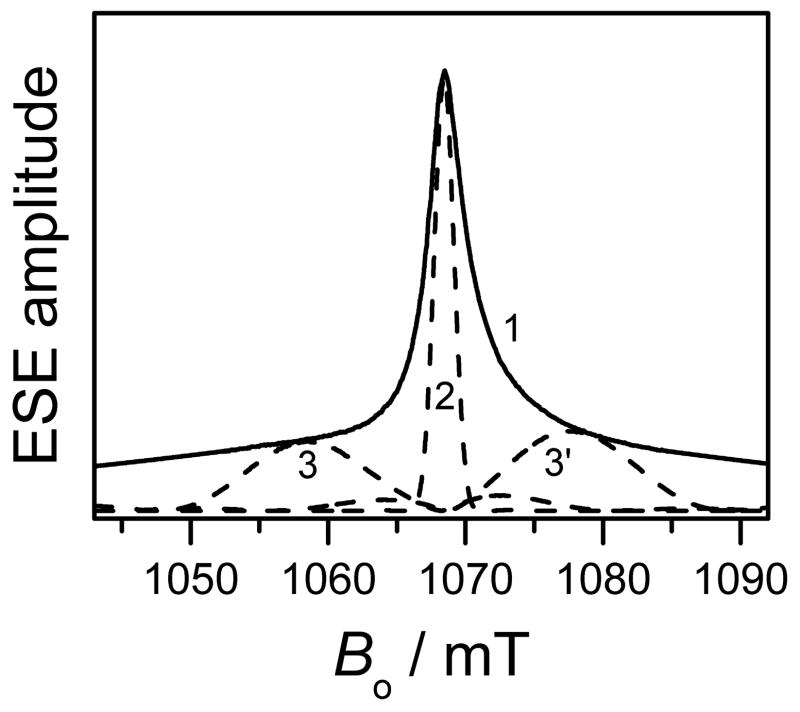
For the sake of comparing signal loss in long-distance measurements, a pulse separation of 10 μs was chosen. At this pulse separation, the LNO signal loss exceeds that of LGd by the factors of 1.3 and 6 for W95C and W16C, respectively. All of these combined factors show that Gd(III) tags should have a S/N of between 2 and 8 times greater than that of LNO tags. An additional factor of two gain may be obtained if a 5-pulse sequence consisting of the three-pulse observation sequence in resonance with the intense central transition plus two pumping pulses placed symmetrically around the central transition were implemented for the measurements, as presented in Fig. 11. Therefore, tapping into the potential benefits offered by Gd(III) tags over LNO tags, the existing instrumentation is expected to give a total 4- to 16-fold improvement in sensitivity and, accordingly, may decrease the measurement time by an order of magnitude for the same S/N ratio.
Figure 11.
Possible modification of the DEER setup for LGd to improve the absolute DEER effect. Observation pulses (excitation profile 2) are applied in resonance with the maximum of the EPR spectrum, while the spectra of the two pumping pulses (excitation profiles 3 and 3′) are set symmetrically (about ±280MHz) with respect to observation pulse. Trace 1, same as in Fig. 10. Pumping π-pulses, 3 ns; observation pulses (π/2, π, π), 10ns.
4. Conclusion
This work describes the first synthesis of Gd(III) chelates conjugated to oligonucleotides and the utility of using Gd(III) tags to perform long-range distance measurements with DEER. Furthermore, this work has established that such measurements can be routinely carried out for distances of at least 60 Å. It was also estimated that by means of minor instrumental modifications this limit could be increased to 85 Å, and possibly to about 100 Å. As a result, reliable measurements of conformations of oligonucleotides having up 30 bp could be performed, and structural variations could be tracked in proteins weighing up to 300 kD. It is also evident, where the use of Gd(III) tags would be most beneficial compared with the widely used nitroxide labels. The Gd(III) tags have a long tether of about 12–15 Å (about twice that of LNO), which has numerous degrees of freedom and can result in rather broad and smooth measured distance distributions. Thus, we can currently foresee that the use of Gd(III)-based labels will be most beneficial in the detection of distance variations in large biomacromolecules, with the emphasis on large scale changes in shape or distance. Tracking the folding/unfolding and domain interactions of proteins and the conformational changes in DNA are examples of such applications.
Supplementary Material
Acknowledgments
This research was supported by the Binational Science Foundation (USA-Israel, BSF#2006179) NIH 1R01 EB005866-01, NSF DBI-0139459, DBI-9604939, BIR-922443 and NIH S10RR020959. A.R. is very thankful to Prof. D. Goldfarb for stimulating discussions.
Footnotes
Publisher's Disclaimer: This is a PDF file of an unedited manuscript that has been accepted for publication. As a service to our customers we are providing this early version of the manuscript. The manuscript will undergo copyediting, typesetting, and review of the resulting proof before it is published in its final citable form. Please note that during the production process errors may be discovered which could affect the content, and all legal disclaimers that apply to the journal pertain.
References
- 1.The designation “Pulsed Dipolar (ESR) spectroscopy (PDS)” for all pulsed EPR techniques used in the measurements of dipolar interactions was recently suggested by Borbat and Freed in [2,3].
- 2.Borbat PP, Freed JH. Pros and Cons of Pulse Dipolar ESR. EPR News Letter. 2007;17:21–32. [Google Scholar]
- 3.Borbat PP, Freed JH. Two-Component Signaling Systems, Part B. Measuring Distances by Pulsed Dipolar ESR Spectroscopy: Spin-Labeled Histidine Kinases. Methods in Enzymology. 2007;423:52–116. doi: 10.1016/S0076-6879(07)23003-4. [DOI] [PubMed] [Google Scholar]
- 4.Borbat JH, Davis PP, Butcher SE, Freed JH. Measurement of Large Distances in Biomolecules Using Double-Quantum-Filtered Refocused Electron-Spin-Echoes. J Am Chem Soc. 2004;126:7746–7747. doi: 10.1021/ja049372o. [DOI] [PubMed] [Google Scholar]
- 5.Fafarman AT, Borbat PP, Freed JH, Kirshenbaum K. Characterizing the structure and dynamics of folded oligomers: Pulsed ESR studies of peptoid helices. Chem Commun. 2007:377–379. doi: 10.1039/b612198e. [DOI] [PubMed] [Google Scholar]
- 6.Tong J, Borbat PP, Freed JH, Shin Y-K. A scissors mechanism for stimulation of SNARE-mediated lipid mixing by cholesterol. PNAS. 2009;106:5141–5146. doi: 10.1073/pnas.0813138106. [DOI] [PMC free article] [PubMed] [Google Scholar]
- 7.Borbat PP, McHaourab HS, Freed JH. Protein Structure Determination Using Long-Distance Constraints from Double-Quantum Coherence ESR: Study of T4 Lysozyme. J Am Chem Soc. 2002;124:5304–5314. doi: 10.1021/ja020040y. [DOI] [PubMed] [Google Scholar]
- 8.Georgieva ER, Ramlall TF, Borbat PP, Freed JH, Eliezer D. Membrane-Bound α-Synuclein Forms an Extended Helix: Long-Distance Pulsed ESR Measurements Using Vesicles, Bicelles, and Rodlike Micelles. J Am Chem Soc. 2008;130:12856–12857. doi: 10.1021/ja804517m. [DOI] [PMC free article] [PubMed] [Google Scholar]
- 9.Upadhyay AK, Borbat PP, Wang J, Freed JH, Edmondson DE. Determination of the Oligomeric States of Human and Rat Monoamine Oxidases in the Outer Mitochondrial Membrane and Octyl D-Glucopyranoside Micelles Using Pulsed Dipolar Electron Spin Resonance Spectroscopy. Biochemistry. 2008;47:1554–1566. doi: 10.1021/bi7021377. [DOI] [PubMed] [Google Scholar]
- 10.Jeschke G. Distance Measurements in the Nanometer Range by Pulse EPR. ChemPhysChem. 2002;3:927–932. doi: 10.1002/1439-7641(20021115)3:11<927::AID-CPHC927>3.0.CO;2-Q. [DOI] [PubMed] [Google Scholar]
- 11.Jeschke G, Polyhach Y. Distance measurements on spin-labelled biomacromolecules by pulsed electron paramagnetic resonane. PhysChemChemPhys. 2007;9:1895–1910. doi: 10.1039/b614920k. [DOI] [PubMed] [Google Scholar]
- 12.Banham JE, Baker CM, Ceola S, Day IJ, Grant GH, Groenen EJJ, Rodgers CT, Jeschke G, Timmel CR. Distance measurements in the borderline region of applicability of CW EPR and DEER: A model study on a homologous series of spin-labelled peptides. J Magn Res. 2008;191:202–218. doi: 10.1016/j.jmr.2007.11.023. [DOI] [PubMed] [Google Scholar]
- 13.Jeschke G, Bender A, Paulsen H, Zimmermann H, Godt A. Sensitivity enhancement in pulse EPR distance measurements. J Magn Reson. 2004;169:1–12. doi: 10.1016/j.jmr.2004.03.024. [DOI] [PubMed] [Google Scholar]
- 14.Dockter C, Volkov A, Bauer C, Polyhach Y, Joly-Lopez Z, Jeschke G, Paulsen H. Refolding of the integral membrane protein light-harvesting complex II monitored by pulse EPR. PNAS. 2009;106:18485–18490. doi: 10.1073/pnas.0906462106. [DOI] [PMC free article] [PubMed] [Google Scholar]
- 15.Polyhach Ye, Godt A, Bauer C, Jeschke G. Spin pair geometry revealed by high-field DEER in the presence of conformational distributions. J Magn Reson. 2007;185:118–129. doi: 10.1016/j.jmr.2006.11.012. [DOI] [PubMed] [Google Scholar]
- 16.Jung H, Padan E, Wegener C, Vogel K-P, Steinhoff H-J, Hilger Dl, Jeschke G. Assessing Oligomerization of Membrane Proteins by Four-Pulse DEER: pH-Dependent Dimerization of NhaA Na1/H1 Antiporter of E. coli. Biophysical J. 2005;89:1328–1338. doi: 10.1529/biophysj.105.062232. [DOI] [PMC free article] [PubMed] [Google Scholar]
- 17.Bode BE, Margraf D, Plackmeyer J, Dürner G, Prisner TF, Schiemann O. Counting the Monomers in Nanometer-Sized Oligomers by Pulsed Electron–Electron Double Resonance. J Am Chem Soc. 2007;129:6736–6745. doi: 10.1021/ja065787t. [DOI] [PubMed] [Google Scholar]
- 18.Schiemann O, Prisner TF. Long-range distance determinations in biomacromolecules by EPR spectroscopy. Q Rev Biophys. 2007;40:1–53. doi: 10.1017/S003358350700460X. [DOI] [PubMed] [Google Scholar]
- 19.Schiemann O, Piton N, Plackmeyer J, Bode BE, Prisner TF, Engels JW. Spin labeling of oligonucleotides with the nitroxide TPA and use of PELDOR, a pulse EPR method, to measure intramolecular distances. Nature Protocols. 2007;2:904–923. doi: 10.1038/nprot.2007.97. [DOI] [PubMed] [Google Scholar]
- 20.Schiemann O, Piton N, Mu Y, Stock G, Engels JW, Prisner TF. A PELDOR-based nanometer distance ruler for oligonucleotides. J Am Chem Soc. 2004;126:5722–5729. doi: 10.1021/ja0393877. [DOI] [PubMed] [Google Scholar]
- 21.Schiemann O, Cekan P, Margraf D, Prisner TF, Sigurdsson ST. Relative orientation of rigid nitroxides by PELDOR: beyond distance measurements in nucleic acids. Angew Chem Int Ed. 2009;48:3292–3295. doi: 10.1002/anie.200805152. [DOI] [PubMed] [Google Scholar]
- 22.Schiemann O, Weber A, Edwards TE, Prisner TF, Sigurdsson ST. Nanometer Distance Measurements on RNA Using PELDOR. J Am Chem Soc. 2003;125:3434–3435. doi: 10.1021/ja0274610. [DOI] [PubMed] [Google Scholar]
- 23.Ward R, Bowman A, El-Mkami H, Owen-Hughes T, Norman DG. Long Distance PELDOR Measurements on the Histone Core. J Am Chem Soc. 2009;131:1348–1349. doi: 10.1021/ja807918f. [DOI] [PMC free article] [PubMed] [Google Scholar]
- 24.Bowman A, Ward R, El-Mkami H, Owen-Hughes T, Norman DG. Probing the (H3-H4)2 histone tetramer structure using pulsed EPR spectroscopy combined with site directed spin labeling. Nucleic Acids Research. 2010;38:695–707. doi: 10.1093/nar/gkp1003. [DOI] [PMC free article] [PubMed] [Google Scholar]
- 25.Ward R, Bowman A, Sozudogru E, El-Mkami H, Owen-Hughes T, Norman DG. EPR Distance measurements in deuterated proteins. J Magn Res. 2010;207:164–167. doi: 10.1016/j.jmr.2010.08.002. [DOI] [PMC free article] [PubMed] [Google Scholar]
- 26.Kuznetsov NA, Milov AD, Koval VV, Samoilova RI, Grishin YA, Knorre DG, Tsvetkov YD, Fedorova OS, Dzuba SA. PELDOR study of conformations of double-spin-labeled single- and double-stranded DNA with non-nucleotide inserts. Phys Chem Chem Phys. 2009;11:6826–6832. doi: 10.1039/b904873a. [DOI] [PubMed] [Google Scholar]
- 27.Sicolli G, Mathis G, Delalande O, Boulard Y, Gasparutto D, Gambarelli S. Double Electron–Electron Resonance (DEER): A Convenient Method To Probe DNA Conformational Changes. Ang Chem, Int Ed. 2008;47:735–737. doi: 10.1002/anie.200704133. [DOI] [PubMed] [Google Scholar]
- 28.Borovykh IV, Ceola S, Gajula P, Gast P, Steinhoff H-J, Huber M. Distance between a native cofactor and a spin label in the reaction centre of Rhodobacter sphaeroides by a two-frequency pulsed electron paramagnetic resonance method and molecular dynamics simulations. J Magn Reson. 2006;180:178–185. doi: 10.1016/j.jmr.2006.02.008. [DOI] [PubMed] [Google Scholar]
- 29.Bird GH, Pornsuwan S, Saxena S, Schafmeister CE. Distance Distributions of End-Labeled Curved Bispeptide Oligomers by Electron Spin Resonance. ACS Nano. 2008;2:1857–1864. doi: 10.1021/nn800327g. [DOI] [PubMed] [Google Scholar]
- 30.Cai Q, Kusnetzow AK, Hubbell WL, Haworth IS, Gacho GPC, Van Eps N, Hideg K, Chambers EJ, Qin PZ. Site-directed spin labeling measurements of nanometer distances in nucleic acids using a sequence-independent nitroxide probe. Nucleic Acids Research. 2006;34:4722–4730. doi: 10.1093/nar/gkl546. [DOI] [PMC free article] [PubMed] [Google Scholar]
- 31.Cai Q, Kusnetzow AK, Hideg K, Price EA, Haworth IS, Qiny PZ. Nanometer Distance Measurements in RNA Using Site-Directed Spin Labeling. Biophys J. 2007;93:2110–2117. doi: 10.1529/biophysj.107.109439. [DOI] [PMC free article] [PubMed] [Google Scholar]
- 32.Milov AD, Salikhov KM, Shirov MD. Application of ELDOR in electron-spin echo for investigation of paramagnetic center space distribution in solids. Fiz Tverd Tela. 1981;23:975–982. [Google Scholar]
- 33.Borbat PP, Freed JH. Multiple-quantum ESR and distance measurements. Chemical Physics Letters. 1999;313:145–154. [Google Scholar]
- 34.Kurshev VV, Raitsimring AM, Tsvetkov YuD. Selection of the dipolar interaction by the “2+1” pulse train. J Magn Reson. 1989;81:441–449. [Google Scholar]
- 35.Kulik LV, Dzuba SA, Grigoryev IA, Tsvetkov YD. Electron dipole–dipole interaction in ESEEM of nitroxide biradicals. Chemical Physics Letters. 2001;343:315–324. [Google Scholar]
- 36.Milikisyants S, Scarpelli F, Finiguerra MG, Ubbink M, Huber M. A pulsed EPR method to determine distances between paramagnetic centers with strong spectral anisotropy and radicals: The dead-time free RIDME sequence. J Magn Reson. 2009;201:48–56. doi: 10.1016/j.jmr.2009.08.008. [DOI] [PubMed] [Google Scholar]
- 37.Astashkin AV, Seravalli J, Mansoorabadi SO, Reed GH, Ragsdale SW. Pulsed electron paramagnetic resonance experiments identify the paramagnetic intermediates in the pyruvate ferredoxin oxidoreductase catalytic cycle. J Amer Chem Soc. 2006;128:3888–3889. doi: 10.1021/ja0585275. [DOI] [PMC free article] [PubMed] [Google Scholar]
- 38.Jeschke G, Pannier M, Godt HW, Spiess A. Dipolar spectroscopy and spin alignment in electron paramagnetic resonance. Chem Phys Lett. 2000;331:243–252. [Google Scholar]
- 39.Finiguerra MG, Prudencio M, Ubbink M, Huber M. Accurate long-range distance measurements in a doubly spin-labeled protein by a four-pulse, double electron–electron resonance method. Magnetic Resonance in Chemistry. 2008;46:1096–1101. doi: 10.1002/mrc.2290. [DOI] [PubMed] [Google Scholar]
- 40.Cornish V, Bentson D, Altenbach C, Hideg K, Hubbell W, Schultz P. Site-specific incorporation of biophysical probes into proteins. Proc Natl Acad Sci. 1994;91:2910–2914. doi: 10.1073/pnas.91.8.2910. [DOI] [PMC free article] [PubMed] [Google Scholar]
- 41.Hubbel WL, Cafiso DS, Altenbach C. Identifying conformational changes with site-directed spin labeling. Nat Struct Biol. 2000;7:735–739. doi: 10.1038/78956. [DOI] [PubMed] [Google Scholar]
- 42.Milhauser GL. Selective Placement of Electron Spin Resonance Labels: New Structural Methods for peptides and proteins. Trends Biochem Sci. 1992;17:448–452. doi: 10.1016/0968-0004(92)90486-s. [DOI] [PubMed] [Google Scholar]
- 43.Jeschke G, Sajid M, Schulteb M, Godt A. Three-spin correlations in double electron–electron resonance. Phys Chem Chem Phys. 2009;11:6580–6591. doi: 10.1039/b905724b. [DOI] [PubMed] [Google Scholar]
- 44.Milov AD, Ponomarev AB, Tsvetkov YuD. Electron-electron double resonance in electron spin echo: Model biradical systems and the sensitized photolysis of decalin. Chem Phys Lett. 1984;110:67–72. [Google Scholar]
- 45.Lovett JE, Bowen AM, Timmel CR, Jones MW, Dilworth JR, Caprotti D, Bell SG, Wongab LL, Harmer J. Structural information from orientationally selective DEER spectroscopy. Phys Chem Chem Phys. 2009;11:6840–6848. doi: 10.1039/b907010a. [DOI] [PubMed] [Google Scholar]
- 46.Zou P, Mchaourab HS. Increased sensitivity and extended range of distance measurements in spin-labeled membrane proteins: Q-band double electron–electron resonance and nanoscale bilayers. Biophys J. 2010;98:L18–L20. doi: 10.1016/j.bpj.2009.12.4193. [DOI] [PMC free article] [PubMed] [Google Scholar]
- 47.Goldfarb D, Lipkin Y, Potapov A, Gorodetsky Y, Epel B, Raitsimring AM, Radoul M, Kaminker I. HYSCORE and DEER with an Upgraded 95 GHz Pulse EPR Spectrometer. J Magn Reson. 2008;194:8–15. doi: 10.1016/j.jmr.2008.05.019. [DOI] [PubMed] [Google Scholar]
- 48.Cruickshank PAS, Bolton DR, Robertson DA, Hunter R, Wylde RJ, Smith GM. A kilowatt pulsed 94 GHz electron paramagnetic resonance spectrometer with high concentration sensitivity, high instantaneous bandwidth, and low dead time. Rev Sci Instrum. 2009;80:103102–17. doi: 10.1063/1.3239402. [DOI] [PubMed] [Google Scholar]
- 49.Potapov A, Song Y, Meade TJ, Goldfarb D, Astashkin AV, Raitsimring A. Distance measurements in model bis-Gd(III) complexes with flexible “bridge”. Emulation of biological molecules having flexible structure with Gd(III) labels attached. J Magn Reson. 2010;205:38–49. doi: 10.1016/j.jmr.2010.03.019. [DOI] [PMC free article] [PubMed] [Google Scholar]
- 50.Astashkin AV, Raitsimring AM. Electron spin echo envelope modulation theory for high electron spin systems in weak crystal field. J Chem Phys. 2002;117:6121–6132. [Google Scholar]
- 51.Astashkin AV, Raitsimring AM, Caravan P. Pulsed ENDOR Study of Water Coordination to Gd3+ Complexes in Orientationally Disordered Systems. J Phys Chem A. 2004;106:1990–2001. [Google Scholar]
- 52.Raitsimring AM, Astashkin AV, Poluektov OG, Caravan P. High field pulsed EPR and ENDOR of Gd3+ complexes in glassy solutions. Applied Magnetic Resonance. 2005;23:281–295. [Google Scholar]
- 53.Raitsimring AM, Gunanathan Ch, Potapov A, Efremenko I, Martin JML, Milstein D, Goldfarb D. Gd3+ Complexes as Potential Spin Labels for High Field Pulsed EPR Distance Measurements. J Am Chem Soc. 2007;129:14138–14139. doi: 10.1021/ja075544g. [DOI] [PubMed] [Google Scholar]
- 54.Potapov A, Yagi H, Huber T, Jergic S, Dixon NE, Otting G, Goldfarb D. Nanometer-Scale Distance Measurements in Proteins Using Gd3+ Spin Labeling. J Am Chem Soc. 2010;132:9040–9048. doi: 10.1021/ja1015662. [DOI] [PubMed] [Google Scholar]
- 55.Van Swieten PF, Leeuwenburgh MA, Kessler BM, Overkleeft HS. Bioorthogonal organic chemistry in living cells: novel strategies for labeling biomolecules. Organic and Biomolecular Chemistry. 2005;3:20–27. doi: 10.1039/b412558d. [DOI] [PubMed] [Google Scholar]
- 56.Prescher JA, Bertozzi CR. Chemistry in living systems. Nature, Chemical Biology. 2005;1:13–21. doi: 10.1038/nchembio0605-13. [DOI] [PubMed] [Google Scholar]
- 57.Griffin BA, Adams SR, Tsien RY. Specific covalent labeling of recombinant protein molecules inside live cells. Science. 1998;281:269–272. doi: 10.1126/science.281.5374.269. [DOI] [PubMed] [Google Scholar]
- 58.Song W, Wang Y, Qu J, Lin Q. Selective Functionalization of a Genetically Encoded Alkene-Containing Protein via “Photoclick Chemistry” in Bacterial Cells. J Amer Chem Soc. 2008;130:9654–9655. doi: 10.1021/ja803598e. [DOI] [PubMed] [Google Scholar]
- 59.Beatty KE, Liu JC, Xie F, Dieterich DC, Schuman EM, Wang Q, Tirrell DA. Fluorescence visualization of newly synthesized proteins in mammalian cells. Ang Chem Int Edit. 2006;45:7364–7367. doi: 10.1002/anie.200602114. [DOI] [PubMed] [Google Scholar]
- 60.Su X-C, Man B, Beeren S, Liang H, Simonsen S, Schmitz C, Huber T, Messerle BA, Otting G. Dipicolinic Acid Tag for Rigid Lanthanide Tagging of Proteins and Paramagnetic NMR Spectroscopy. J Amer Chem Soc. 2008;130:10486–10487. doi: 10.1021/ja803741f. [DOI] [PubMed] [Google Scholar]
- 61.Fokin VV. Click Imaging of Biochemical Processes in Living Systems. ACS Chemical Biology. 2007;2:775–778. doi: 10.1021/cb700254v. [DOI] [PubMed] [Google Scholar]
- 62.Codelli JA, Baskin JM, Agard NJ, Bertozzi CR. Second-Generation Difluorinated Cyclooctynes for Copper-Free Click Chemistry. J Amer Chem Soc. 2008;130:11486–11493. doi: 10.1021/ja803086r. [DOI] [PMC free article] [PubMed] [Google Scholar]
- 63.Rostovtsev VV, Green LG, Fokin VV, Sharpless KB. A stepwise Huisgen cycloaddition process: copper(I)-catalyzed regioselective “ligation” of azides and terminal alkynes. Angew Chem Int Ed. 2002;41:2596–2599. doi: 10.1002/1521-3773(20020715)41:14<2596::AID-ANIE2596>3.0.CO;2-4. [DOI] [PubMed] [Google Scholar]
- 64.Sletten EM, Bertozzi CR. A Hydrophilic Azacyclooctyne for Cu-Free Click Chemistry. Organic Letters. 2008;10:3097–3099. doi: 10.1021/ol801141k. [DOI] [PMC free article] [PubMed] [Google Scholar]
- 65.Song Y, Kohlmeir EK, Meade TJ. Synthesis of Multimeric MR Contrast Agents for Cellular Imaging. J Am Chem Soc. 2008;130:6662–6663. doi: 10.1021/ja0777990. [DOI] [PMC free article] [PubMed] [Google Scholar]
- 66.Astashkin A, Enemark JH, Raitsimring AM. 26.5–40 GHz Ka-band pulsed EPR spectrometer, Concepts in Magnetic Resonance. Part B (Magnetic Resonance Engineering) 2006;29B:125–136. [Google Scholar]
- 67.Pannier S, Veit A, Godt G, Jeschke G, Spiess HW. Dead-Time Free Measurement of Dipole–Dipole Interactions between Electron Spins. J Magn Reson. 2000;142:331–340. doi: 10.1006/jmre.1999.1944. [DOI] [PubMed] [Google Scholar]
- 68.Operation and Maintenance Manuel for the Model 187Ka TWT Amplifier. Prepared by Applied Systems Engineering, Inc; PO Box 122987, Fort Worth, Texas 76121: Apr 14, 2004. [Google Scholar]
- 69.Bleaney B, Rubins RS. Explanation of some ‘Forbidden’ Transitions in Paramagnetic Resonance. Proc Phys Soc. 1961;77:103–112. [Google Scholar]
- 70.Fields RA, Hutchison CA. The determination of hydrogen coordinates in lanthanum nicotinate dihydrate crystals by Gd+3–proton double resonance. Chem Phys. 1985;82:1711–1733. [Google Scholar]
- 71.Huber M, Lindgren M, Hammarström P, Mårtensson L-G, Carlsson U, Eaton GR, Eaton SS. Phase memory relaxation times of spin labels in human carbonic anhydrase II: pulsed EPR to determine spin label location. Biophysical Chemistry. 2001;94:245–256. doi: 10.1016/s0301-4622(01)00239-3. [DOI] [PubMed] [Google Scholar]
- 72.Raitsimring AM, Salikhov KM. ESE method as used to analyze the spatial distribution of the paramagnetic centers. Bull Magn Reson. 1985;7:184–197. [Google Scholar]
- 73.Raitsimring AM, Salikhov KM, Umanskii BA, Tsvetkov YuD. Instantaneous diffusion in the ESE of paramagnetic centers in solids. Fizika Tverdogo Tela. 1974;16:756–762. [Google Scholar]
- 74.Salikhov KM, Dzuba SA, Raitsimring AM. The theory of the ESE signal decay resulting from dipole-dipole interaction between paramagnetic centers in solids. J Magn Res. 1981;42:255–266. [Google Scholar]
- 75.Raitsimring AM, Tregub VV. Electron spin echo decay kinetics of an ion track in β-irradiated frozen solution of sulfuric acid. numerical simulation by the Monte Carlo method and experiment. Chem Phys. 1983;77:123–130. [Google Scholar]
- 76.Chiang Y-W, Borbat PP, Freed JH. The determination of pair distance distributions by pulsed ESR using Tikhonov regularization. J Magn Reson. 2005;172:279–295. doi: 10.1016/j.jmr.2004.10.012. [DOI] [PubMed] [Google Scholar]
- 77.Chiang Y-W, Borbat PP, Freed JH. Maximum entropy: A complement to Tikhonov regularization for determination of pair distance distributions by pulsed ESR. J Magn Reson. 2005;177:184–196. doi: 10.1016/j.jmr.2005.07.021. [DOI] [PubMed] [Google Scholar]
- 78.Jeschke G, Chechik V, Ionita P, Godt A, Zimmermann H, Banham J, Timmel CR, Hilger D, Jung H. DEER Analysis 2006 a comprehensive software package for analyzing pulsed ELDOR data. Appl Magn Res. 2007;30:473–498. [Google Scholar]
- 79.http://www.acert.cornell.edu/indexfiles/acert_ftp_links.php
- 80.http://www.ambermd.org/
- 81.http://www.scfbio-iitd.res.in/utility/marvin/help/sketch/sketch-intro.html.
- 82.http://gpgpu.org/2010/07/18/openmm-2-0-now-available
- 83.In [30] where more than dozen of different DNA duplexes were investigated, λp varies from 0.22 to 0.42 while λc as we evaluated from EPR spectrum and pumping pulse parameters, was 0.4. In [20] λp for different oligonucleotides was found between 0.01 and 0.2 while λc calculated for this experiment was 0.24. In [26] the ratio of λp/λc was ~ 0.7.
- 84.http://www.bruker-biospin.com/epr_res_qband_ft.html
- 85.Kaminker I, Potapov A, Feintuch A, Vega S, Goldfarb D. Population transfer for signal enhancement in pulsed EPR experiments on half integer high spin systems. Phys Chem Chem Phys. 2009;11:6799–6806. doi: 10.1039/b906177k. [DOI] [PubMed] [Google Scholar]
- 86.Astashkin AV, Raitsimring AM. Refocused Primary Echo: A Zero Dead Time Detection of the Electron Spin Echo Envelope Modulation. J Magn Reson. 2000;143:280–291. doi: 10.1006/jmre.1999.1988. [DOI] [PubMed] [Google Scholar]
Associated Data
This section collects any data citations, data availability statements, or supplementary materials included in this article.


