Abstract
Background and Objectives:
In the fields of the pharmaceutical and cosmetic industries and in toxicology, the study of the skin penetration of molecules is very interesting. Various studies have considered the impact of different physicochemical drug characteristics, skin thickness, and formulations, on the transition from the surface of the skin to the underlying tissues or to the systemic circulation; however, the influence of drug concentration on the permeation flux of molecules has rarely been raised. Our study aims to discover the influence of caffeine concentration in a formulation on the percutaneous penetration from gels, as a result of different dose applications to polysulfate membrane and human skin.
Materials and Methods:
For this purpose, three identical base gels were used at 1, 3, and 5% of caffeine, to evaluate the effect of the concentration of caffeine on in vitro release through the synthetic membrane and ex vivo permeation through the human skin, using diffusion FranzTM cells.
Results:
The diffusion through the epidermal tissue was significantly slower than through the synthetic membrane, which recorded an increase of flux with an increase in the concentration of caffeine. The skin permeation study showed that diffusion depended not only on the concentration, but also on the deposited amount of gel. Nevertheless, for the same amount of caffeine applied, the flux was more significant from the less concentrated gel.
Conclusion:
Among all the different concentrations of caffeine examined, 1% gel of caffeine applied at 5 mg / cm2 showed the highest absorption characteristics across human skin.
Keywords: Absorption rate, Diffusion coefficient, Franz™ diffusion cells, Percutaneous absorption, Permeation flow
Introduction
The therapeutic efficacy of any drug depends on its bioavailability. Bioavailability is defined as the amount of drug that reaches the systemic circulation and the speed which is then reached.[1]
In dermatology, the effectiveness of a therapy is based on the availability of a pharmacologically active element, able to reach its biological target, and penetrate the skin (healthy or injured).[2]
The targeted therapeutic action by the drugs applied to the skin can be a local or systemic action. In the first case, drugs can act either on the surface of the skin (antiseptics, keratolytic agents) or in the deeper part of the skin (corticosteroids, analgesics), therefore, the active drug should penetrate into the deep structures and should remain there at an effective concentration. In case of a drug for systemic action, for example, estrogen or piroxicam, drug absorption is essential for reaching the action area.[2–5]Consequently, the optimization of drug formulations applied through the skin occupies an important place in modern therapy, where transdermal application constitutes an alternative to an oral one.[6]
Percutaneous absorption is the transfer of a substance through the skin from the outside environment to the blood. It can be defined as the sum of two phenomena: the penetration of molecules from the external environment into the entire skin, followed by the absorption from the dermis by means of the blood or lymphatic stream.[7]The cutaneous pharmacokinetic studies allow one to recognize the fate of the drugs applied to the skin, to evaluate what fraction of the applied doses have been effectively absorbed, and also to determine the bioequivalence of the generic products.[8–10]
Few techniques exist presently that determine the bioequivalence of topical agents that are both minimally invasive and give precise information on the tissue concentration of the drug, over time.[11]The evaluation of drug penetration through animal skins does not always reflect the situation in human beings and considering the moral and ethical issues while experimenting on healthy volunteers or animals, it is necessary to set up in vitro or ex vivo methods, which would foresee the skin penetration.[12,13]Some studies have demonstrated the reliability of in vitro or ex vivo methods in the prediction of molecule skin absorption. These methods have demonstrated the influence of many factors on the portion and amount of the compound absorbed from a topical formulation.
Our present study has focused mainly on the variation in drug absorption, according to the drug concentration in the formulation and the amount applied to the skin. We have evaluated the permeation of caffeine, a molecule of reference according to the OECD represents the Organisation for Economic Cooperation and development, through human skin, from three gels prepared in the laboratory, containing 1, 3, and 5% of caffeine, applied at different doses. The high-performance liquid chromatography (HPLC) dosage of caffeine has allowed us to identify key parameters of diffusion, namely the diffusion flow (J), the diffusion coefficient (Dm), the absorption rate (T %), and the lag time (T lag).
Materials and Methods
The applied method is in compliance with the American Association of Pharmaceutical Scientists (AAPS) and the Food and Drug Administration (FDA) recommendations.
Skin absorption has been studied on samples of human skin mounted on Franz™ cells. They allow a survival liquid (phosphate buffer pH 7.4) to be put in contact with the skin, in which caffeine is measured over time, after it has passed through the epidermis and dermis.
Preparation of caffeine gels
We prepared three gels in the laboratory with concentrations of 1, 3, and 5% of caffeine, and the formula is:
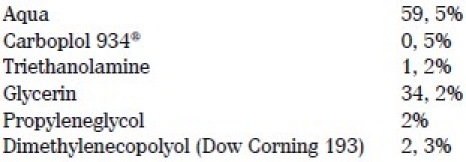
The pH of the three gels was between 6.5 and 7.
Study of caffeine solubility in the gels
Drug solubility is an important molecular property for the successful development of drugs, because it is a key factor governing the access of drugs across biological membranes. In fact, poor solubility has been identified as the cause of a number of drug development failures. On the other hand, if solubility is incorrectly estimated, this can lead to an erroneous interpretation of results in a number of in-vitro assays.[14]
Consequently, we have prepared a set of gels with increasing concentrations of caffeine: 1, 3, 4, 5, 7, 9, and 10%, which we filtered; and we submitted the supernatant (aqueous part of the gel) to a chromatographic assay, to assess the concentrations of caffeine dissolved in the gels. Measurements were carried out at 25ºC.
Description of cells diffusion: Franz™ cells
The diffusion cells used are cells made of glass, static type, and include three separate parts:
A supplier donor compartment, which contains the drug. The application surface is 3.14 cm2 , and the occlusion is provided by Parafilm ® .
A lower receiver compartment, containing a medium whose composition is as close as possible to the physiological medium. The liquid receiver used for the release of caffeine is the phosphate buffer at pH 7.4, in which the substance released through the membrane is determined. The receiver volume is about 10 ml.
A diffusion membrane: Polysulfone membrane or skin.
Once diffusion membranes are deposited, the cells are stabilized and maintained into a water bath at 37ºC. The homogeneity of the temperature and of course of the content in the lower compartment are maintained by the movements of a bar magnet.
These cells are called static, as the receiver compartment is periodically renewed during the tests by sampling liquid and replacement with a new fluid.
Study of the in vitro release of caffeine
The applied method is in compliance with the AAPS and the FDA recommendations.
This study has been performed using Franz™ cells as described earlier in the text. The membranes used are Polysulfone membranes, which have been soaked overnight in a mixture of Ethomeen 15%, Isopropyl Myristate.
The membranes were installed on Franz cells (six cells per gel), the lower compartment was filled with a liquid receiver and the system was allowed to stabilize for two hours. Three hundred milligrams of each formulation was deposited on the surface of the membrane using a micro-spatula. The cells, with stirring, were maintained at 37ºC and closed with Parafilm® to avoid formula evaporation.
The samplings of the receiver liquid were made after 30, 60, and 360 minutes and were immediately tested. The survival liquid was completely renewed each time.
Comparative study of ex vivo skin absorption of caffeine
The applied method is in compliance with the AAPS and the FDA recommendations.
Skin penetration ex vivo was studied in biopsies of human skin placed in Franz™ cells (as described earlier in the text).
Preparation of the human skin
The biopsies used for the tests were obtained during abdominal plastic surgeries.
The skin was defrosted one day before its use. The next day, the skin was freed of subcutaneous fat by the means of a scalpel. Then the whole skin was dermatomed to more or less a constant thickness of 250 to 400 μm using a Brown™ dermatome (Emergence, 94573 Rungis). Once dermatomed, the skin was cut into pieces of about 4 cm2 each.
A control of thickness quality was made for each biopsy using a specific device, and then the skin samples were mounted in diffusion cells without any other process. The skin surface temperature was measured using a mini-thermometer (TESTO 0900.0519) at 32ºC ± 1ºC.
Application of the method
Once the skin was set, the cells were stabilized in a water bath at 37ºC, overnight.
The gel was filled in the upper compartment (on the epidermal surface of the skin biopsy) using a micro spatula. The amount of gel was individually weighted: 1, 2, and 5 mg / cm2 for each gel: 1, 3, and 5%. Sampling of the receiver liquid was made every 30, 60, 90, 180, and 360 minutes for analysis. After filtration, the caffeine was measured by HPLC. Five to six cells were performed for each gel and each dosage.
Quantitative analysis of caffeine
HPLC equipment: HPLC D-7000 Merck Hitachi.
Column: LICHROSPHER RP 18 - 5 μm (4FNx01125)
Mobile Phase: Mixture MeOH / H2 O (30 / 70).
Mobile phase flow: 1 ml / minute
Quantity injected: 20 μl
Detector UV: 272 nm
Analysis Time: 8 minutes
For each sample, three successive tests were performed. For the quantitative determination of caffeine we used a standard range of seven points covering concentrations of 10-2000 mg / ml, prepared from caffeine, identical to that used for the preparation of gels.
Results
Caffeine solubility in the gels
The caffeine extracted from the supernatant of the gels (aqueous part) corresponded with the portion of caffeine that was dissolved in the gel. It increased according to the percentage of caffeine in the gel, until the threshold limit (gel 7% of caffeine) level at which the concentration of caffeine became stable, and then it decreased [Figure 1].
Figure 1.
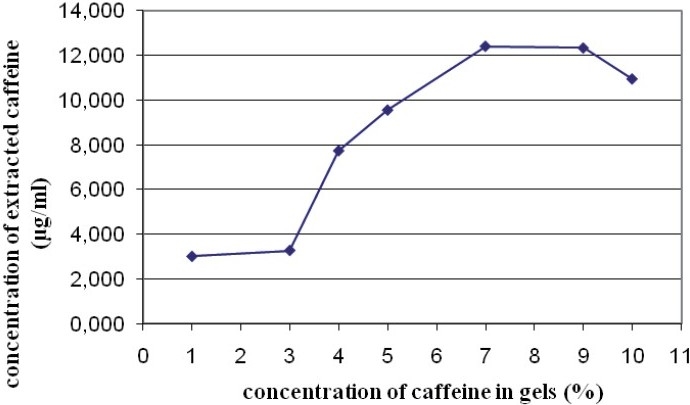
Concentration of caffeine dissolved according to the caffeine content of the gels
It is accepted that the concentration governs the thermodynamic activity and influences the distribution of a molecule in this vehicle. The maximum diffusion is generally obtained when the concentration in the vehicle reaches the limit of solubility. Only the portion of drug dissolved in the vehicle can be released at the surface of the skin and spread.
Figure 1 shows the concentration of caffeine dissolved according to the content of the gels. The plateau corresponds to the limit of solubility of caffeine in the gel. This may correspond to a saturation of the vehicle by caffeine. The decrease of the dissolved caffeine concentration may be explained by a phenomenon of crystallization of the molecule, which is preventing its diffusion in the vehicle.1, 3, and 5% gels are located in the ascending and linear curve, and are therefore valid for our comparative study.
Release of caffeine from gels
The in vitro release of caffeine on the polysulfone membrane has been studied. According to a recent study,[15] the polysulfone membrane is not a limiting factor for the release of caffeine and enables the study of the in vitro release in this molecule.
For the three gels, we traced the cumulated quantity per unit area according to time [Figure 2]. The flow was estimated by the regression curve. As shown in Figure 2, the release flux of caffeine through the membrane became stable from 60 minutes. The steady state flux could be estimated by linear regression through the data obtained between one and six hours. The values produced were 0.57 ± 0.4, 2.68 ± 1.93, and 4.87 ± 0.84 μg / cm2 / minutes, respectively, for gels of 1, 3, and 5%. There was an increase of flow with an increasing concentration of caffeine.
Figure 2.
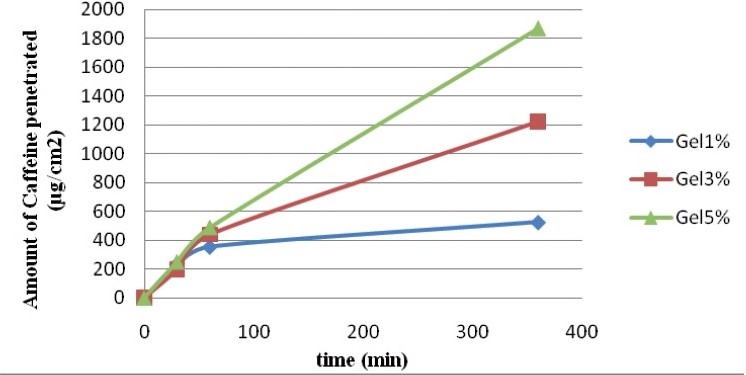
Profile of the in vitro release of caffeine through the polysulfone membrane from gels with 1, 3, and 5% caffeine (n = 5). Applied Dose: 300 mg of gel; cell surface: 3.14 cm2; receptor volume: 10 mL
We plotted the correlation curve between the accumulated quantity per unit area and the square root of time [Figure 3], and very good regression coefficients were obtained (R2 > 0.93). The release rate was estimated from these regression lines. It was more important in case of a higher concentration of caffeine [Table 1]. Similarly, the increase in caffeine accumulated after six hours was proportional to the increase of gel concentration [Table 1].
Figure 3.
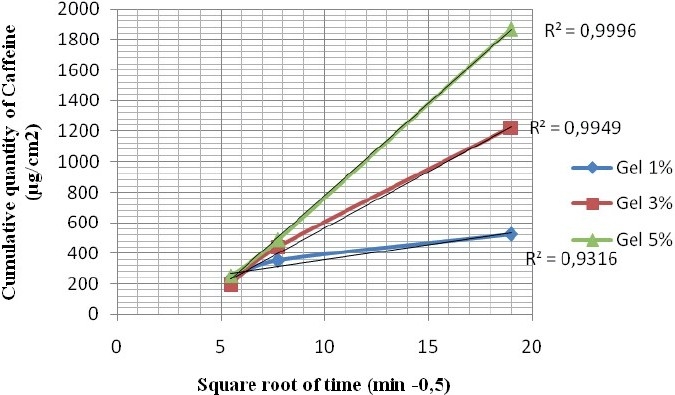
Profile of the in vitro release of caffeine through the polysulfone membrane according to the square root of time. Applied Dose: 300 mg of gel; cell surface: 3.14 cm2; receptor volume: 10 mL.
Table 1.
Characteristics of caffeine release through the polysulfone membrane (± SD; N = 6)

The release rate was satisfactory for the study of skin penetration of caffeine from these gels.
We also calculated the rate of caffeine absorption through the membrane; 55% for 1% gel, 42.63% for the 3% gel, and 39.13% for 5 % gel.
Therefore, despite the increase of the release rate and the accumulated quantity for the same amount of gel, the absorption rate of caffeine decreases, while the concentration of the drug gel increases.
Comparative study of the skin absorption of caffeine
The standard range allows to calculate the concentrations of caffeine diffused in each recipient and for each permeation time (in μg / ml). We can then calculate the accumulated amounts of caffeine diffused into the receiver for each permeation time and per unit area of skin.
From the values thus obtained, the curve of permeation for each cell was drawn; accumulated amounts (μg / cm2) versus permeation time (minutes). The flux (J) was determined from the slope of the steady state portion of the amount of the drug permeated, divided by A versus time. The lag time (T lag) values were determined from the x-intercept of the slope at a steady state.
From this curve, a line was drawn through the last points aligned (steady-state diffusion flux).
Diffusion flow (J)
The diffusion flow is the amount of substance absorbed per unit area and time. The values of the diffusion flow (J) are shown in the Table 2.
Table 2.
Average values of J (μg / cm2 / min) (± SD; N = 5)
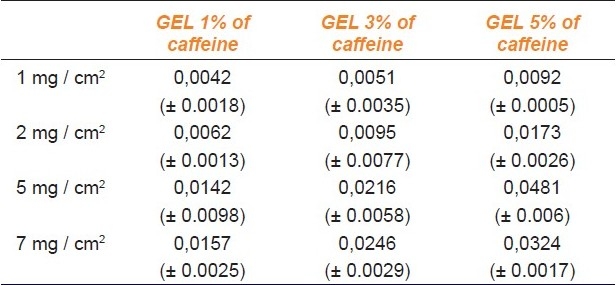
The lowest value of J was obtained with 1% gel applied at a dose of 1 mg / cm2, while the highest flow was recorded with 5% gel, applied at a dose of 5 mg / cm2.
For each gel and for every amount deposited: 1, 2, and 5 mg / cm2 , the diffusion flux increased with the dose of gel applied. For a quantity of gel of 7 mg / cm2 , the increase in flux for gels 1 and 3% was insignificant compared to the deposit of 5 mg / cm2 . In addition there was a reduced flow for the 5% gel.
The 1% Gel: When moving from 1 mg / cm2 to 2, 5, and 7 mg / cm2, the flow increased from 1.47 to 3.38, and 3.7 times, respectively. Therefore, the increased flow was not proportional to the increase in the amount of gel deposited, even if it approached the proportionality ratio between the deposition of 2 and 5 mg / cm2 (2.3 times). At 7 mg / cm2, the value of diffusion flow was practically similar to the flow obtained with 5 mg / cm2.
The 3% Gel: The flow increased proportionally to the increase in the amount of gel deposited until 5 mg / cm2. At 7 mg / cm2, this increase slowed and the flow was almost identical to the flow obtained with 5 mg / cm2.
The 5% Gel: The increase of J was practically constant until 5 mg / cm2, and then it recorded a decrease of the flow at 7 mg / cm2. This fact could be explained by the saturation of the receiver medium.
Lag time (T lag)
Lag time is the time required for the diffusion flow to become stable.
During our experiments, it varied from 40 to 147 minutes. This lag time was considered appropriate and it could be concluded that caffeine diffused rapidly through the skin.
As shown in Figure 4, although the differences are minimal, the lag time increases with the amount of gel deposited for gels 1 and 3%. For the 5% gel, the T lag was almost the same (120, 118, and 124 minutes) for the three applied doses (1, 2, and 5 mg / cm2).
Figure 4.
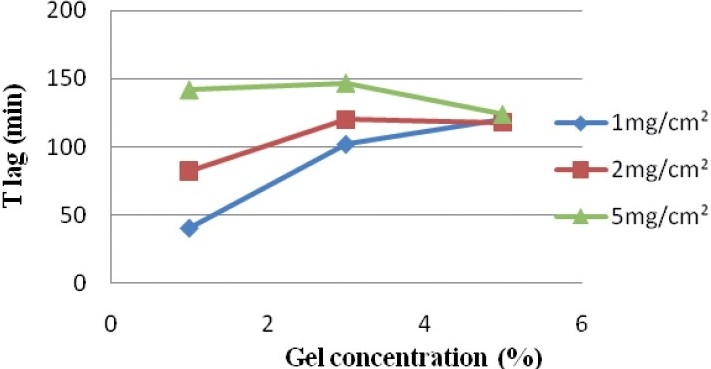
Variation of the lag time (T lag) depending on the gel concentration for a deposited quantity of gel
At 1 mg / cm2, the T lag was longer when the concentration of caffeine increased. A maximum difference of 80 minutes was obtained between the 1 and 5% gels.
At 2 mg / cm2, the T lag was the same (about two minutes) between the 3 and 5% gels, and was slightly higher than the T lag obtained with the 1% gel (difference of 40 minutes).
At 5 mg / cm2, the T lag was the same for the 1 and 3% gels, and then it decreased with the 5% gel, to achieve the same values obtained at 1 and 2 mg / cm2, at the same concentration (5%).
We observed then that higher the deposited amount, the more identical was the lag time for the three gels, 1, 3, and 5%, and it even decreased with the gel 5% at 5mg / cm2.
Absorption rate
We calculated the absorption rate from the amount of caffeine initially deposited and the amount accumulated in the receiver compartment after six hours. The results are summarized in Table 3.
Table 3.
Quantities of Caffeine deposited (μg), accumulated amounts after six hours (μg) (± SD; N = 6) and absorption rate (%)

A reduction in absorption rate was observed when the concentration of caffeine was increased, for the same deposited amount of gel.
Similarly for a given concentration gel, the accumulated amount after six hours was very slightly increased when the deposited amount of gel was increased, then it was followed by a decrease of the absorption rate.
Diffusion Coefficient (Dm)
Fick's second law shows the evolution of the concentration of a substance in a volume of the diffusion field:
(δC / δt) = -D (δ2C / δx2) (1) Fick's second law
In deriving the Fick's second law, in the case of diffusion through a membrane with a constant concentration in the provider compartment under conditions ‘sink’, we get the following equation:
Mt = [ (A. K. D. Co) / h]. t - h2 / 6D with t → ∞ (2)
Mt: Quantity of material that crosses an area of tissue at a given time K: Partition coefficient between the provider phase in contact with the membrane A: Surface membrane D: Diffusion coefficient Co: Concentration of molecule on the surface of the membrane
h: Thickness of the membrane
The equation is represented by the straight part of the curve and corresponds to a state of equilibrium.
The slope of this line is given by the derivative:
δMt / δt = (A. K. D. Co) / h (3)
which corresponds to the flow of solute through the membrane.
The intersection of the line with the x-axis is given by:
h2 / 6D = T lag (4)
From this equation, we calculated the diffusion coefficient for each of the gels and for every deposited amount. The results are shown in Table 4.
Table 4.
Values of diffusion coefficients Dm (cm2.h-1)

Discussion
Our study focuses on the comparison of various parameters of skin absorption of caffeine. After having checked the solubility of caffeine (Criterion limiting) in gels 1, 3, and 5%, we studied the release of the drug from these gels.
The study of the release in vitro, through a synthetic polysulfone membrane, showed a satisfactory release rate of caffeine (19.51, 73.89, and 121 μg / cm2 / min-0.5 respectively for gels 1, 3, and 5%) within a relatively short time, convenient for the comparative study of the skin absorption from these three gels. We have demonstrated that with the higher caffeine concentration in the gel, there is a higher diffusion flow and higher release rate of caffeine.
Similarly, there was a proportional increase in the accumulated amount of caffeine to the increase in the concentration of the drug.
The absorption rate was higher for gel 1% (55% of the caffeine was found lodged in the receiver middle); a negligible difference in the absorption rate was recorded for gels between 3 and 5% (42.63% for the gel 3% and 39.13% for the gel 5%).
The study of caffeine diffusion through the skin showed that the diffusion flow depended not only on the concentration, but also on the deposited amount of gel. For the same concentration of caffeine, the diffusion flow increased when the amount applied was increased.
The increase of flow according to the rise of concentration of the drug or with the deposited amount of substance used was accompanied by an increase in the accumulated amount of caffeine, while the absorption rate decreased.
Nevertheless, we noted that for the same amount of caffeine, of 157 μg: 5 mg / cm2 of gel 1% or 1mg / cm2 of gel 5%, the diffusion flow and the accumulated amount was about 1.5 times higher with the less concentrated gel. The highest diffusion coefficient Dm was found with the gel 1%, and then it decreased with the most concentrated gels, and also as the deposited amount of gel increased.
At the end of the study, a good correlation was observed between the flow and accumulated amount of caffeine. The correlation coefficient values (R2) were: 0.993; 0.967, and 0.836 for gels 1, 3, and 5% of caffeine, respectively. This correlation proved to be stronger with less concentrated gel. It was also observed that the diffusion coefficient Dm did not vary in the same manner as the flow J, but a good correlation between Dm and absorption rate was underlined (R2 > 0.95) [Figure 5].
Figure 5.
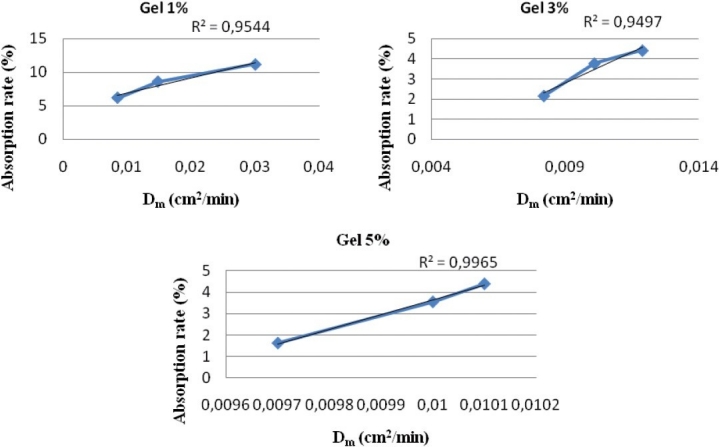
Correlation between the rate of absorption (%) and the diffusion coefficient Dm (cm2 / min)
This type of study may be useful in case the active drug is distributed under various dosages; therefore the key question is to know whether it is preferable to prescribe the most concentrated formulation or to adapt a more intensive treatment with less concentrated dosage.
As an example, in the case of caffeine, with this formulation, it seems that the gel 1% at 5 mg / cm2 is more efficient in terms of flow and absorption rate than the more concentrated gels applied to an equivalent quantity of caffeine.
This study was conducted on caffeine but it is remains to be seen and studied, how other molecules, with different physicochemical properties, will behave in this model.
Footnotes
Source of Support: Nil.
Conflict of Interest: None declared.
References
- 1.Luong MS, Luong MP, Lok C, Carmi E, Chaby G, Viseux V. Evaluation de la biodisoponibilté des dermocorticoïdes par thermographie infrarouge différentielle. Ann Dermatol Vénéréol. 2000;127:701–5. [PubMed] [Google Scholar]
- 2.Barry BW. Mode of action of penetration enhancers in human skin. J Control Release. 1987;6:85–97. [Google Scholar]
- 3.Barry BW. Penetration enhancers. Skin Pharmacol. 1987;1:121–37. [Google Scholar]
- 4.Lippold BC. How to Optimize Drug Penetration through the skin.Pharm. Acta Helv. 1992;67:294–300. [PubMed] [Google Scholar]
- 5.Parikh NH, Babar A, Plakogiannis FM. Transdermal therapeutic systems. Pharm Acta Helv. 1984;59:290–2. [PubMed] [Google Scholar]
- 6.Barry BW. Novel mechanisms and devices to enable successful transdermal drug delivery. Eur J Pharm Sci. 2001;14:101–14. doi: 10.1016/s0928-0987(01)00167-1. [DOI] [PubMed] [Google Scholar]
- 7.Marty JP. La pénétration cutanée des toxiques.26ème Congrès National de Médecine du Travail. Lille, France. 2000 Jun 6-9; [Google Scholar]
- 8.Potard G, Laugel C, Baillet A, Schaefer H, Marty JP. Quantitative HPLC analysis of sunscreens and caffeine during in vitro percutaneous penetration studies. Int J Pharm. 1999;189:249–60. doi: 10.1016/s0378-5173(99)00258-6. [DOI] [PubMed] [Google Scholar]
- 9.Netzlaff F, Kaca M, Bock U, Haltner-Ukomadu E, Meiers P, Lehr CM, et al. Permeability of the reconstructed human epidermis model Episkin® in comparison to various human skin preparations. Eur J Pharm Biopharm. 2007;66:127–34. doi: 10.1016/j.ejpb.2006.08.012. [DOI] [PubMed] [Google Scholar]
- 10.Pershing LK, Nelson JL, Corlett JL, Shrivastava SP, Hare DB, Shah VP. Assessment of dermatopharmacokinetic approach in the bioequivalence determination of topical tretinoin gel products. J Am Acad Dermatol. 2003;48:740–51. doi: 10.1067/mjd.2003.175. [DOI] [PubMed] [Google Scholar]
- 11.Martinez-Pla JJ, Martin-Biosca Y, SAGRADO S, Villanueva-Camanas RM, Medina-Hernandez J. Biopartitionning micellar chromatography to predict skin permeability. Biomed Chromatogr. 2003;17:530–7. doi: 10.1002/bmc.281. [DOI] [PubMed] [Google Scholar]
- 12.Williams FM. in vitro studies-how good are they at replacing in vivo studies for measurement of skin absorption? Environ Toxicol Pharmacol. 2006;21:199–203. doi: 10.1016/j.etap.2005.07.009. [DOI] [PubMed] [Google Scholar]
- 13.Schreiber S, Mahmoud A, Vuia A, Rübbelke MK, Schmidt E, Schaller M, et al. Reconstructed epidermis versus human and animal skin in skin absorption studies. Toxicol In Vitro. 2005;19:813–22. doi: 10.1016/j.tiv.2005.04.004. [DOI] [PubMed] [Google Scholar]
- 14.Faller B, Ertl P. Computational approaches to determine drug solubility. Adv Drug Deliv Rev. 2007;59:533–45. doi: 10.1016/j.addr.2007.05.005. [DOI] [PubMed] [Google Scholar]
- 15.Clement P, Laugel C, Marty JP. Influence of three synthetic membranes on the release of caffeine from concentrated W / O emulsions. J Control Release. 2000;66:243–54. doi: 10.1016/s0168-3659(99)00276-x. [DOI] [PubMed] [Google Scholar]


