

Abstract
Modified DNA bases are widespread in biology. 5-Methylcytosine (mC) is a predominant epigenetic marker in higher eukaryotes involved in gene regulation, development, aging, cancer, and disease. Recently, 5-hydroxymethylcytosine (hmC) was identified in mammalian brain tissue and stem cells. However, most of the currently available assays cannot distinguish mC from hmC in DNA fragments. We investigate here the physical properties of DNA with modified cytosines, in efforts to develop a physical tool that distinguishes mC from hmC in DNA fragments. Molecular dynamics simulations reveal that polar cytosine modifications affect internal base pair dynamics, while experimental evidence suggest a correlation between the modified cytosine’s polarity, DNA flexibility, and duplex stability. Based on these physical differences, solid-state nanopores can rapidly discriminate among DNA fragments with mC or hmC modification by sampling a few hundred molecules in the solution. Further, the relative proportion of hmC in the sample can be determined from the electronic signature of the intact DNA fragment.
Introduction
Modified DNA bases (chemical derivatives of A, G, C, or T) are present in all kingdoms of life, and their diversity suggests functional roles in living organisms1. In viruses and bacteria, modified bases have been identified and studied since the 1950’s, and some functions have been elucidated 2. For example, T-even bacteriophage DNA contains glucosylated cytosines, which protect the viral genome from cleavage by most host cell endonucleases3. In higher eukaryotes cytosine methylation is a prominent epigenetic marker, involved in gene expression and development and disease. It has been suggested that the presence of 5′-methylcytosine (mC) in CpG island promoter regions affects the binding of transcription factors, and consequently gene expression4. Mapping the sites of cytosine modification in genomes and comparing methylation patterns among individuals is crucial for understanding the underlying mechanisms by which gene expression is controlled.
In 2009, substantial amounts of 5-hydroxymethylcytosine (hmC) were identified in mammalian brain tissues and embryonic stem cells5, 6, and the Tet enzyme family involved in mC to hmC oxidation was identified6. The presence of hmC in mammalian DNA confirms earlier findings by Penn and co-workers in 19727. Despite these decades old findings, the physiological role of hmC modification remains elusive. It is not known whether hmC is an epigenetic marker or simply an oxidative intermediate in DNA demethylation. A major reason behind this limited knowledge has been the difficulty to distinguish mC from hmC. Bisulfite sequencing, the primary biochemical assay for mapping cytosine methylation, cannot distinguish between mC and hmC bases, as both modifications protect bisulfite-mediated oxidation of cytosine to uracil8–10. Only recently, fluorescence experiments using a single polymerase enzyme have shown that different cytosine modifications in a specific sequence of a template strand have significant effects on the incorporation kinetics of a DNA polymerase11. While a few hmC-specific antibodies have recently been made available, their use for immunoprecipitation-based enrichment remains technically challenging.12 To our knowledge, antibody-free or enzyme-free assays for distinguishing hmC from mC in an intact genomic fragment are not available.
In this work, we explore the physical properties of DNA molecules that contain modified cytosines. Biological and solid-state nanopores are extremely sensitive devices for discriminating among different nucleic acids13–24, and are promising candidates for DNA sequencing25. In this paper, we show that solid-state nanopores are capable of detecting modified cytosines, and that these changes are a result of the DNA mechanical properties. Molecular dynamics (MD) simulations, previously used to describe the physics of DNA translocation through a nanopore26, are employed here to understand the mechanisms that alter the physical properties of the modified DNA.
Results
Figure 1a shows a thin silicon nitride membrane that separates two electrolyte chambers, with a nanopore being the only junction between the two chambers. Application of voltage ΔV across the membrane drives ions through the pore, resulting in a steady-state ion current that is measured using a low-noise current amplifier. When biomolecules pass through the pore, the magnitude of residual ion current is used to report on the structure of the biomolecule. Figure 1b shows continuous time traces of the current through a 4 nm diameter pore in a 20 nm thick membrane before and after the addition of 3 kbp double-stranded DNA to the chamber with the negative electrode. Addition of DNA results in a sequence of current blockade spikes, each corresponding to the transport of a single DNA molecule. The magnitude of each spike is related to the excluded volume of biopolymer that occupies the pore. We define here two quantities (see Figure 1b): 1) ΔI corresponds to the mean current amplitude of an event, and 2) tT corresponds to the transport time, or total duration of the event. The all-point current histogram in Figure 1b shows that DNA occlusion of the pore produces characteristic current amplitude. Characterization of a sample is performed by statistical analysis of the two parameters ΔI and tT.
Figure 1.
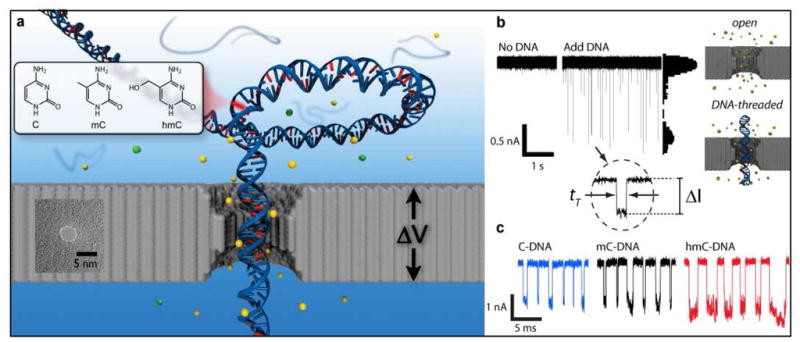
Nanopore detection of modified cytosines. (a) Scheme of a nanopore in a thin silicon nitride membrane, showing a DNA molecule being driven through it by an applied voltage ΔV. A TEM image of a 4 nm diameter pore in a 20 nm thick SiN membrane is also shown in the Figure. The measured signal is the ion current of an electrolyte through the pore (e.g., KCl), represented by the yellow and green spheres. Three types of DNA molecules are driven through the pore, with the only difference between them being the chemical structure of cytosine residues in their sequence, shown in the inset. (b) Ion current traces of a 4 nm pore at 21°C under 300 mV applied voltage, before and after the addition of 3 kbp DNA to the analyte chamber (i.e., the chamber with the negative electrode). The deep spikes after the addition of DNA correspond to transport of DNA across the pore. The all-point histogram to the right of the current trace shows characteristic peaks for the open and DNA-occluded pore. A magnified event is shown in which ΔI and tT are defined. (c) Typical events that correspond to transport of C-DNA, mC-DNA, and hmC-DNA through the pore in (a). Transport of hmC-DNA exhibits larger ΔI and tT values than C-DNA or mC-DNA.
Differentiation of cytosine and 5-methylcytosine from 5-hydroxymethylcytosine
We first show that nanopores can discriminate among identical DNA sequences with different cytosine modifications. Toward this goal, PCR conditions that utilize Phusion DNA polymerase (Finnzymes/NEB) were optimized to yield approximately equal incorporation of native and modified cytosine nucleotides into the replicated strands (see SI-1). Using these conditions, we then prepared DNA fragments that exclusively contain cytosine, 5-methylcytosine, or 5-hydroxymethylcytosine, hereafter called C-DNA, mC-DNA, or hmC-DNA, respectively. Sequencing the amplified DNA fragments verified that no specific mutations were introduced during PCR amplification.
Ion-current traces for a 3 kbp fragment with different cytosine modifications reveal larger ΔI and tT values for hmC-DNA than for C-DNA or mC-DNA (Figure 1c). This result is striking, given the small chemical differences between the different cytosines. We consistently observed similar results for at least ten pores of diameters in the range 4.0 ± 0.3 nm, as well as for a set of 400 bp DNA fragments (see SI-2). Our results were also reproduced by measurements of mC-DNA and hmC-DNA in a blind experiment using a different nanopore measurement setup.
To further explore the mechanism that accounts for deeper blockade amplitudes for hmC-DNA, we studied the dependence of ΔI on bath temperature (see Figure 2). To generate the plots, we fit the ΔI distributions to Gaussian functions in order to find the most-likely current amplitudes, ΔImax. Full ΔI distributions for all three DNA molecules at 10°C and 21°C are shown in the inset to the plot. We find that ΔImax values for mC-DNA and C-DNA are similar at all temperatures. For clarity, we therefore focus on comparing ΔImax values for mC-DNA to hmC-DNA; both of which increase with temperature. However, while the increase in ΔImax is expected with temperature because of the increased ion mobility, ΔIhmC clearly exhibits a non-monotonic behavior, increasing more sharply than ΔImC in the range 10–30°C. The ratio ΔIhmC/ΔImC, shown above the plot in Figure 2, systematically shows that hmC-DNA blocks more current amplitude than mC-DNA, by as much as 40% at 30°C. At 21°C, this difference in ΔImax between mC-DNA and hmC-DNA is ~300 pA.
Figure 2.
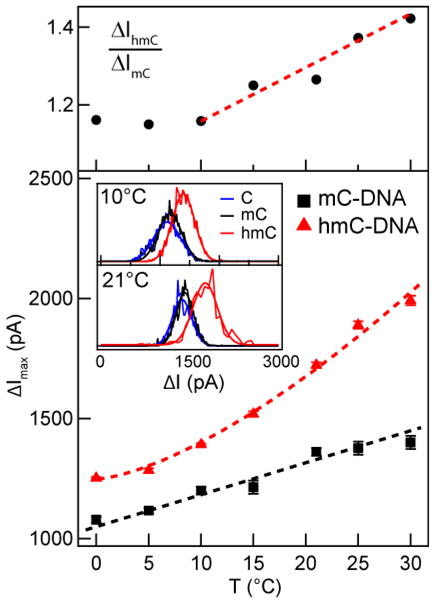
Signal amplitude dependence on bath temperature for mC-DNA and hmC-DNA. Each point in the graph represents the peak ΔI value (ΔImax) obtained from Gaussian fits to ΔI distributions for each experiment. Dashed lines are guides to the eye. The inset shows ΔI distributions for C-DNA, mC-DNA, and hmC-DNA at 10°C and 21°C. The ratio ΔIhmC/ ΔImC is shown above the graph. C-DNA exhibited similar temperature dependence as mC-DNA. Each point is based on a measurement of 1,560–2,900 molecules, and all data were obtained using a single pore.
While we have distinguished between DNA that exclusively contains either mC-DNA or hmC-DNA, mammalian DNA contains relatively small amounts of hmC, up to a few percent of total cytosines5, 27. Therefore, to test the sensitivity of nanopores to sparsely modified DNA, we prepared identical sequences that contain different fractions of hmC compared to either C or mC, and confirmed the cytosine ratio using mass spectrometry (see SI-3). In Figure 3 we plot normalized ΔImax values for 3 kbp DNA samples with different hmC:C ratios. The position of ΔInorm increases with the fraction of hmC, both for samples that have mixed hmC:C and hmC:mC nucleotides. A linear regression fit to the data yields a slope of 8 ± 0.5 pA per percent of hmC. Rigorous statistical analysis of our data is shown in SI-6. From the fits to the Gaussian distributions, the certainty in the mean in ΔInorm for a population of >1,000 molecules is 3 pA. Therefore, for an ideal pore that does not fluctuate during the experiment lifetime, our method should in principle quantify hmC in DNA fragments with hmC abundances of ~1% of total cytosines in the fragment. However, statistical analysis of our data (SI-6) shows that the confidence with which we can discriminate among the 0% hmC and 3% hmC is only 91%; these amounts of hmC correspond to 0.75% of total bases, close to the values found in Purkinje neurons.5 To realize the full analytical potential of our discrimination technique, all sources of systematic errors must be overcome.
Figure 3.
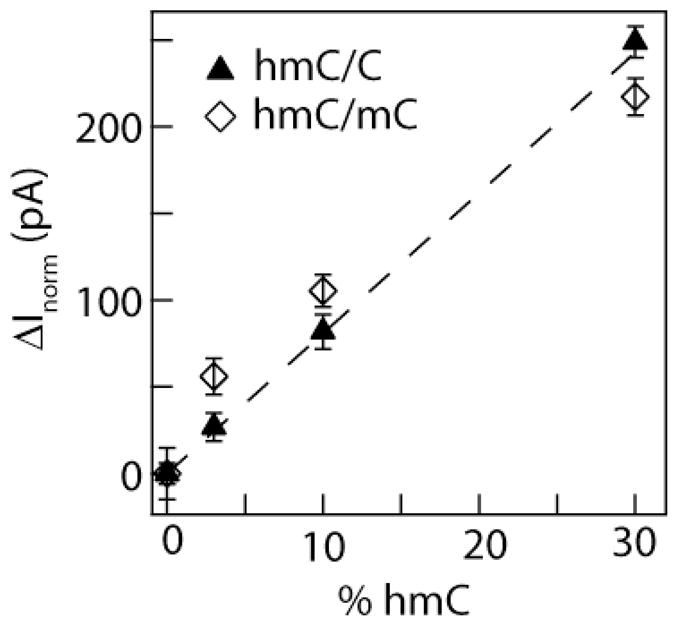
Normalized ΔImax values for 3 kbp DNA with mixed cytosines (ΔInorm). Different cytosine modification ratios hmC/C and hmC/mC were tested, and ΔImax values were found from Gaussian fits to the ΔI distributions. The values in the plots represent the difference in ΔImax values from 0% hmC samples. The dashed line is a best global regression fit to the data, with slope of 8 ± 0.5 pA per percent hmC. Our lowest confidence is distinguishing 0% hmC-DNA from 3% hmC-DNA is 91% according to a Student’s t-test (see SI-6). Each point is based on a measurement of 1,000–2,040 molecules, and the two datasets were obtained using different pores with a similar diameter.
Effect of cytosine modifications on DNA structure
The different ΔImax values for mC-DNA and hmC-DNA suggests that transport through the pore is influenced by differences in DNA structure. In Figure 4a, we plot mean transport times tT for the three DNAs as a function of temperature19. In the range of 10–30°C, we note two main observations: First, tT values follow the trend hmC-DNA > C-DNA > mC-DNA. Second, while tT values decrease for C-DNA and mC-DNA with increasing temperatures, tT values increase for hmC-DNA, suggesting a thermally activated process that stalls DNA transport for hmC-DNA. We also note that transport times for C-DNA are significantly slower than for mC-DNA, although the difference is not as pronounced as the difference between mC-DNA and hmC-DNA. The ψ2 values For all of the transport time fits were between 0.8 and 1.7.
Figure 4.

Temperature dependence on stability of duplexes with different cytosine modifications. (a) Mean transport times for 3 kbp C-DNA, mC-DNA, and hmC-DNA samples as a function of bath temperature. With increasing temperatures in the range of 10–30°C, mean transport times decrease for mC-DNA and C-DNA, while increasing for hmC-DNA. (b) Fluorescence annealing curves for three DNA molecules. The curves were obtained by differentiating the fluorescence signal from SYBR Green I® in the presence of DNA while cooling from 98°C to 54°C in decrements of 0.2°C using a realtime PCR instrument (curves were shifted for clarity). The peak positions represent the annealing temperatures Tm, written above each curve. Tm values follow the trend hmC-DNA<C- DNA<mC-DNA. In addition, annealing of hmC-DNA occurs more gradually with temperature than for C-DNA or mC-DNA, as shown in the inset plot of T-Tm.
The anomalous behaviour of hmC-DNA suggests a subtle change of the structure, since the three modifications have identical visible mobilities in agarose gel electrophoresis. Therefore, we turned to thermal annealing experiments for the three duplexes in order to shed light on structural differences, as shown in Figure 4b. Thermal annealing curves were obtained by monitoring the fluorescence of SYBR Green I® while reducing the temperature of the solution from 98°C in decrements of 0.2°C. Annealing is indicated by an inflection point in the raw fluorescence data (see SI-4), which appears as a peak in the differential −dF/dT. The temperature at which a peak in the differential curve is reached is referred to as the annealing or melting temperature Tm. The three molecules have a significant difference in Tm values with hmC-DNA < C-DNA < mC-DNA (see Figure 4a). Also, complete annealing of the duplex occurs over a wider temperature range for hmC-DNA, as shown in the inset of Figure 4b. Similar results were obtained in the six replicates that were performed.
The nanopore transport time data suggest that hmC-DNA stalls for longer times in the nanopore as temperature is increased, as opposed to smoother transport for mC-DNA or C-DNA. Similarly, the lower annealing temperature and lower annealing rate for hmC-DNA suggest that the duplex structure is less energetically stable, as compared to the other two molecules. Despite the temperature gap between the nanopore experiments and the annealing curves, both pieces of evidence suggest hmC-DNA has a more easily perturbed duplex structure, which can promote slower translocation through the pore. Enhanced permeation through small pores was recently observed by RT-PCR in a nanopore permeation study.21
To gain molecular insight, molecular dynamics (MD) simulations were performed on model DNA duplexes in 1 M KCl solution at neutral pH under ambient temperature and pressure (see SI-5 for more details about the computations)28. We computed 0.12 μs-long trajectories for a series of 27 bp d(A*CT)9·d(AGT)9 duplexes, where *C is either C, mC or hmC. Although not directly relevant to mammalian CpG methylation sites, this sequence was chosen to study the dynamics of isolated cytosines (i.e., G-*C bps spaced by two A-T bps).
Throughout the simulations, all duplexes maintained a B-form double helix of nearly identical diameter and axial orientation. While steric effects from the modifications produced very minor changes in the duplex’s average local structure, the most prominent effects of the modifications occur locally within G-*C base pairs. The polarity of the modification governs the strength of cytosine-water interactions. Average interaction energies, i.e., electrostatic and van der Waals energies, between cytosine major groove atoms and water molecules within the first solvation shell were −1.5, −1.0, and −1.8 kcal/mol for C-DNA, mC-DNA, and hmC-DNA, respectively. These energetic differences, along with the structure and volume of the chemical modifications, affect solvation dynamics in the major groove. Figure 5a displays differential water densities for hmC-DNA and mC-DNA relative to C-DNA. The excluded volume of the methyl and hydroxymethyl groups pushes solvent around the cytosine farther away from the duplex, as seen by the magenta bubbles in the Figure. Alternatively, van der Waals attraction between water molecules and the modifications increases solvent density around nearby phosphates and N4 atoms in mC and hmC. However, the largest changes in solvation are observed for hmC, because its hydroxymethyl group extends into the major groove towards the DNA 5′ end, creating polar cavities that increase solvation in the major groove (see cyan bubbles in Figure 5a). These cavities can capture water molecules within the first solvation shell, thereby increasing the probability of water to bind to hmC for long (~100 ps) timescales.
Figure 5.
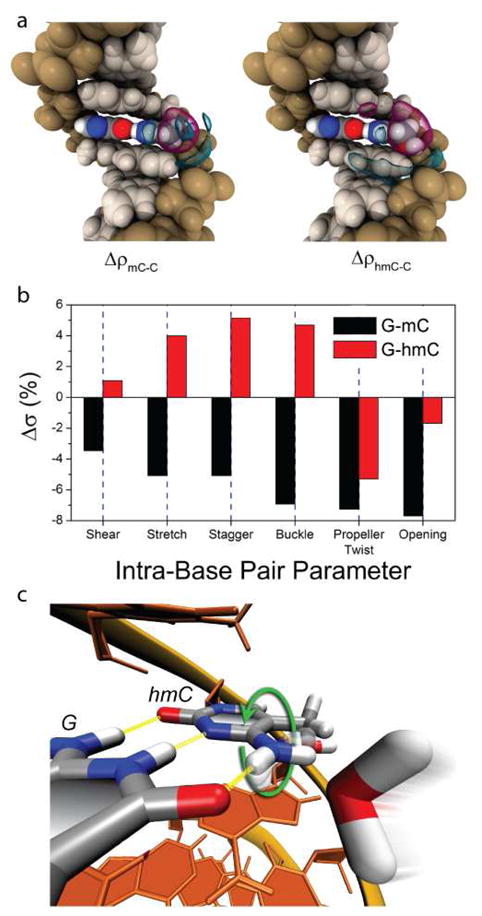
Results of molecular dynamics simulations of duplexes containing modified cytosines. (a) Water density in the major groove of mC (left) and hmC (right) relative to C. Cyan and magenta isosurfaces indicate regions of increased and diminished solvent density, respectively. (b) Differences in standard deviations (fluctuations) of G-mC and G-hmC intra-base pair parameters relative to G-C. Overall, G-hmC experiences the largest fluctuations in internal motion. (c) Rotation of the position 4 amine in hmC due to a colliding water molecule. These rotations occur most frequently in hmC bases (see text).
Interestingly, the MD simulations also show that the polarity of cytosine modifications dictates local structural fluctuations in G-*C bps. The local geometry of DNA can be described by parameters that specify intra-bp, inter-bp and local helical axis conformations29. Figure 5b displays plots of intra-base pair fluctuation amplitudes for G-mC and G-hmC bps relative to G-C bps. Fluctuations in shear, stretch, stagger and buckle are 3–7% smaller in G-mC, while they are 1–5% larger in G-hmC. Due to steric constraints, rotary motion about the helical axis is impeded in G-mC and G-hmC basepairs, which results in reduced fluctuations in propeller twist and opening. Nevertheless, the overall trend for intra-base pair fluctuations is G-hmC > G-C > G-mC. This result is consistent with the polarity of the chemical modification and can be understood as a solvent-mediated effect; fluctuations enable greater opportunities for contact between DNA and water molecules. Because water has the highest affinity for hmC, G-hmC basepairs experience the largest fluctuations. In contrast, water is less favorable to solvate the hydrophobic methyl group of mC, which increases the rigidity of G-mC basepairs. Solvent effects are also responsible for an interesting conformational change in the amine attached to the cytosine 4 position. Water molecules can collide with this group and cause it to rotate by 180° (Figure 5c). This rotation is accompanied by a temporary disruption of hydrogen bonding in G-*C base pairs. Over the simulation timescales, 31 amine rotations are observed throughout the hmC-DNA duplex, compared to only 12 and 7 rotations in mC- and C-DNA duplexes, respectively.
In general, DNA fluctuations are governed by interplay between the steric effects and polarity of the modification. However, for intra-base pair fluctuations, the trend is clear: increasing the size of the modification tends to increase the local rigidity within basepairs, while increasing the polarity of the modification decreases rigidity. Decreased flexibility of mC-DNA duplexes has been observed in previous MD simulations30 and was attributed to the steric effect and hydrophobicity of the methyl group. A novel aspect to our findings is that the steric constraints of the modification, which increase local rigidity, can be mitigated by introducing a more polar modification. Thus, the hydrophilic hydroxymethyl group destabilizes G-hmC basepairs, while the hydrophobic methyl group stabilizes G-mC basepairs.
To determine how these microscopic fluctuations of modified cytosine bases affect global DNA structure, we used atomic force microscopy (AFM) to image surface-immobilized DNA molecules. Rivetti and co-workers31 have argued that measurements of the contour length (L) and end-to-end distance (R) of DNA molecules deposited on a flat 2D mica substrate yields the mean persistence length (P) of the DNA:
| Eqn. 1 |
where the relationship between P and R was derived from a mathematical analysis of worm-like chain bending along its contour. To minimize excluded volume effects from two interacting DNA segments in a long molecule, we synthesized two short DNA fragments that are 410 bp and 1100 bp long, and made the different cytosine variants for each length. For each DNA length, we deposited samples onto freshly cleaved mica under conditions that were optimized to achieve a uniform density of DNA molecules adsorbed on the surface. As indicated by Rivetti and co-workers, a low concentration of Mg2+ ions was used to adsorb the DNA, resulting in diffusion and equilibration of the DNA onto the mica surface31. Following the acquisition of a set of AFM images, we used Gwyddion software to measure R for a set of molecules of each type. In addition, we have measured L for a representative set of molecules in each sample by drawing polyline segments along DNA contours using ImageJ software. For the 410 bp samples, measurement of L values for 30–40 molecules of each kind yielded 137±2 nm, 138±3 nm, and 135±3 nm for C-DNA, mC-DNA, and hmC-DNA, respectively. These mean L values are in very close agreement with the expected contour length based on a helical B-form DNA pitch of 0.34 nm/bp. In contrast, R values were statistically different for each DNA type. By constructing histograms of R and fitting them to Gaussian distributions (see Figure 6), we find that there is a statistical difference between the mean R values, following the trend hmC < C < mC. These differences suggest that there are differences in DNA flexibility. Using Eqn. 1 to compute P for each sample, we find that the range of P values for each modification are (based on <R> values ± uncertainties for both DNA lengths): <PhmC-DNA> = 29–38 nm, <PC- DNA> = 41–49 nm, and <PmC-DNA> = 50–65 nm (see SI-7 for further statistical details). We note that the mean of our calculated P values for C-DNA is somewhat smaller than those found by Rivetti (52 nm). Smaller P values have been ascribed to DNA that adsorbs onto the mica in a partially trapped configuration, and are known to be sensitive to the sample preparation conditions32, 33. Other sources of deviation may be the presence of sequences that inherently contain more unstable basepairing interactions than ordinary DNA sequences, sequences that contain bends (e.g., A-tracts),33 or metrology errors due to tip-mediated artifacts. Therefore, using the same DNA sequence, deposition condition, and AFM tip for each set of molecules ensured that the differences in values of P between samples are trustworthy.
Figure 6.

AFM analysis of DNA with modified cytosines. (a) End-to-end distances R measured by tapping mode AFM of 410 bp fragments immobilized on mica by incubation with a solution of DNA containing 2 mM Tris and 1 mM Mg2+. Insets show representative AFM images for each of the samples (scale bar = 200 nm). The number of molecules n in each distribution is indicated. (b) Similar analysis as in (a) for an 1100 bp DNA fragment. For both DNA lengths, R follows hmC-DNA<C-DNA<mC-DNA.
Our compiled data, both computational and experimental, suggest that increasing the polarity of cytosine modifications reduces the rigidity of a DNA fragment. These findings may be important in explaining epigenetic effects of modified DNAs on transcription factor binding or chromatin assembly, as well as revealing information on the packaging efficiency of certain viruses. This also may explain our ability to discriminate among hmC-DNA and mC-DNA using nanopores: in the temperature range of 10–30°C, hmC-DNA undergoes significant local duplex destabilization, which increases both the mean transport time and current amplitude of hmC-DNA. The exact mechanistic details of DNA transport through a nanopore are yet to be fully understood. MD simulations reveal that the dynamics of DNA translocation through a confined nanopore involves a complex interplay of DNA interactions with solvent, nanopore walls, ions as well as intra-DNA interactions26. Structurally, the 5′ position of cytosine faces outwards towards the grooves, leaving them accessible for interactions with the nanopore. In addition, our findings suggest that the relative stability of modified duplexes is an important factor. Therefore, it is plausible that the combination of hydrophilic pore walls, high electric field inside the pore, and duplex stability, contribute to structural perturbations of hmC-DNA in the nanopore. More simply stated, pulling hmC-DNA through our nanopore may stall transport by deforming or locally denaturing the duplex. Interactions with the hydrophilic nanopore interface may be augmented by contact with deformed DNA structures at the pore. Also, local denaturation of hmC-DNA may promote the presence of multiple DNA strands occupying the pore simultaneously (e.g., three denatured single strands). This may explain the deep current blockades, longer transport times, and more complex current signatures that we observe with hmC-DNA.
In conclusion, we have shown that select physical properties of DNA molecules with identical sequences are dependent on the cytosine modification polarity. These properties give rise to different ion current signatures for DNA molecules threaded through nanopores, and nanopore measurements of as little as a few hundred molecules is sufficient to uniquely distinguish mC-DNA from hmC-DNA. Further, different proportions of hmC in fragments containing C-DNA or mC-DNA can be quantified based on the ion current signatures. We used MD simulations to probe the molecular basis of our findings, revealing that polar cytosine modifications increase the flexibility of DNA by promoting solvent-mediated fluctuations in G-C basepairs. Further, AFM revealed that the mean end-to-end distance for the more polar hmC-DNA was significantly shorter than for C-DNA and mC-DNA, indicating an increased flexibility for hmC-DNA. Nanopore-based discrimination among hmC-DNA and mC-DNA is non-destructive, high-throughput, and sensitive. Provided a better understanding of DNA transport through nanopores, this approach may be able to map cytosine modification patterns directly in unamplified DNA fragments from living cells.
Materials and Methods
All DNA molecules in this paper were prepared by PCR using Phusion DNA polymerase (Finnzymes/NEB). The 3kb sequence was amplified from T4 genomic DNA. The 400 bp and 1100 bp samples were amplified from pBR322 plasmid (NEB). To verify that modified cytosines do not introduce mismatches, we sequenced all types of products following PCR amplification. To make DNA samples with mixed cytosine proportions, we have added different cytosine mononucleotide ratios in the PCR mix. Following PCR amplification, the percentage of hmC was qualitatively determined by digestion with a methylation dependent restriction enzyme (MspJI) (see Figure S1). The 3 kbp DNA products were subjected to a 1% agarose gel electrophoresis as shown in Figure S1A below. The PCR products were then incubated with MspJI modification-dependent restriction endonuclease. As demonstrated in Figure S1B, DNA with modified cytosines was digested, and the extent of digestion qualitatively correlates with the fraction of C with respect to hmC in the PCR mix. For further details regarding the preparation and characterization of the DNA molecules please see the Supplementary Information file.
The substrates for nanopore fabrication were 5×5 mm2 Si chips that have a 20 nm thick low-stress silicon nitride (SiN) film deposited on a 5-μm-thick thermally-grown SiO2 layer, used to reduce the electrical noise. Following removal of the underlying oxide layer, solid-state nanopores in the range 3.5 – 4.5 nm were fabricated and imaged in a JEOL 2010FEG TEM. The nanopore devices were cleaned using piranha solution, followed by copious water wash, assembly in the fluoropolymer cell using a homemade quick cure PDMS gasket, and immersion with 1M KCl + 1mM EDTA buffered to pH 8 using 10 mM tris-HCl. Our fluoropolymer cell accommodates volumes of 1–20 μl and features temperature regulation using a thermoelectric device connected to a copper block that houses the cell. Each chamber was equipped with a Ag/AgCl electrode. An Axopatch 200B patch clamp amplifier was used to apply voltage and measure current through the pore. The analog signal output was sampled at 250 kHz sampling rate using a 16-bit DAQ card (NI PCI-6230). Data were collected and analyzed using custom LabVIEW and Igor Pro software.
Supplementary Material
Acknowledgments
We thank Daniel Branton, Richard Roberts, and Philip Nelson for comments on the manuscript, and Drs. Anna Kalota and Alan Gewirtz for use of their RT-PCR instrument. The computations were supported by Teragrid and ICMS resources and the experimental work by NIH Grant R21HG004767 and New England Biolabs.
Footnotes
Supporting Information Available: Synthetic and characterization of the DNA molecules, fluorescence DNA annealing curves, computational details, and statistical details regarding our nanopore and AFM data. This information is available free of charge via the Internet at http://pubs.acs.org.
References
- 1.Gommersampt JH, Borst P. Faseb J. 1995;9(11):1034–1042. doi: 10.1096/fasebj.9.11.7649402. [DOI] [PubMed] [Google Scholar]
- 2.Warren RA. Annu Rev Microbiol. 1980;34:137–58. doi: 10.1146/annurev.mi.34.100180.001033. [DOI] [PubMed] [Google Scholar]
- 3.Revel HR. Virology. 1967;31(4):688–701. doi: 10.1016/0042-6822(67)90197-3. [DOI] [PubMed] [Google Scholar]
- 4.Lister R, et al. Nature. 2009;462(7271):315–322. doi: 10.1038/nature08514. [DOI] [PMC free article] [PubMed] [Google Scholar]
- 5.Kriaucionis S, Heintz N. Science. 2009;324(5929):929–930. doi: 10.1126/science.1169786. [DOI] [PMC free article] [PubMed] [Google Scholar]
- 6.Tahiliani M, Koh KP, Shen YH, Pastor WA, Bandukwala H, Brudno Y, Agarwal S, Iyer LM, Liu DR, Aravind L, Rao A. Science. 2009;324(5929):930–935. doi: 10.1126/science.1170116. [DOI] [PMC free article] [PubMed] [Google Scholar]
- 7.Penn NW, Bojanows K, Yura R, Suwalski R, Oriley C. Biochem J. 1972;126(4):781–790. doi: 10.1042/bj1260781. [DOI] [PMC free article] [PubMed] [Google Scholar]
- 8.Nestor C, Ruzov A, Meehan RR, Dunican DS. Biotechniques. 2010;48(4):317–319. doi: 10.2144/000113403. [DOI] [PubMed] [Google Scholar]
- 9.Huang Y, Pastor WA, Shen YH, Tahiliani M, Liu DR, Rao A. PLoS One. 2010;5(1):e8888. doi: 10.1371/journal.pone.0008888. [DOI] [PMC free article] [PubMed] [Google Scholar]
- 10.Jin SG, Kadam S, Pfeifer GP. Nucleic Acids Res. 2010;38(11):1–7. doi: 10.1093/nar/gkq223. [DOI] [PMC free article] [PubMed] [Google Scholar]
- 11.Flusberg BA, Webster DR, Lee JH, Travers KJ, Olivares EC, Clark TA, Korlach J, Turner SW. Nat Methods. 2010;7(6):461–472. doi: 10.1038/nmeth.1459. [DOI] [PMC free article] [PubMed] [Google Scholar]
- 12.Ito S, D’Alessio AC, Taranova OV, Hong K, Sowers LC, Zhang Y. Nature. 2010;466(7310):1129–U151. doi: 10.1038/nature09303. [DOI] [PMC free article] [PubMed] [Google Scholar]
- 13.Akeson M, Branton D, Kasianowicz JJ, Brandin E, Deamer DW. Biophys J. 1999;77(6):3227–3233. doi: 10.1016/S0006-3495(99)77153-5. [DOI] [PMC free article] [PubMed] [Google Scholar]
- 14.Li JL, Gershow M, Stein D, Brandin E, Golovchenko JA. Nat Mater. 2003;2(9):611–615. doi: 10.1038/nmat965. [DOI] [PubMed] [Google Scholar]
- 15.Mathe J, Aksimentiev A, Nelson DR, Schulten K, Meller A. Proc Natl Acad Sci U S A. 2005;102(35):12377–12382. doi: 10.1073/pnas.0502947102. [DOI] [PMC free article] [PubMed] [Google Scholar]
- 16.Heng JB, Aksimentiev A, Ho C, Marks P, Grinkova YV, Sligar S, Schulten K, Timp G. Biophys J. 2006;90(3):1098–1106. doi: 10.1529/biophysj.105.070672. [DOI] [PMC free article] [PubMed] [Google Scholar]
- 17.Fologea D, Brandin E, Uplinger J, Branton D, Li J. Electrophoresis. 2007;28(18):3186–3192. doi: 10.1002/elps.200700047. [DOI] [PMC free article] [PubMed] [Google Scholar]
- 18.McNally B, Wanunu M, Meller A. Nano Letters. 2008;8(10):3418–3422. doi: 10.1021/nl802218f. [DOI] [PMC free article] [PubMed] [Google Scholar]
- 19.Wanunu M, Sutin J, McNally B, Chow A, Meller A. Biophys J. 2008;95(10):4716–4725. doi: 10.1529/biophysj.108.140475. [DOI] [PMC free article] [PubMed] [Google Scholar]
- 20.Zhao Q, Comer J, Dimitrov V, Yemenicioglu S, Aksimentiev A, Timp G. Nucleic Acids Res. 2008;36(5):1532–1541. doi: 10.1093/nar/gkm1017. [DOI] [PMC free article] [PubMed] [Google Scholar]
- 21.Mirsaidov U, Timp W, Zou X, Dimitrov V, Schulten K, Feinberg AP, Timp G. Biophys J. 2009;96(4):L32–L34. doi: 10.1016/j.bpj.2008.12.3760. [DOI] [PMC free article] [PubMed] [Google Scholar]
- 22.Purnell RF, Schmidt JJ. ACS Nano. 2009;3(9):2533–8. doi: 10.1021/nn900441x. [DOI] [PubMed] [Google Scholar]
- 23.Clarke J, Wu HC, Jayasinghe L, Patel A, Reid S, Bayley H. Nat Nanotechnol. 2009;4(4):265–270. doi: 10.1038/nnano.2009.12. [DOI] [PubMed] [Google Scholar]
- 24.Kowalczyk SW, Hall AR, Dekker C. Nano Letters. 2010;10(1):324–328. doi: 10.1021/nl903631m. [DOI] [PubMed] [Google Scholar]
- 25.Branton D, et al. Nat Biotechnol. 2008;26(10):1146–1153. doi: 10.1038/nbt.1495. [DOI] [PMC free article] [PubMed] [Google Scholar]
- 26.Aksimentiev A. Nanoscale. 2010;2(4):468–483. doi: 10.1039/b9nr00275h. [DOI] [PMC free article] [PubMed] [Google Scholar]
- 27.Munzel M, Globisch D, Bruckl T, Wagner M, Welzmiller V, Michalakis S, Muller M, Biel M, Carell T. Angew Chem Int Ed. 2010;49(31):5375–5377. doi: 10.1002/anie.201002033. [DOI] [PubMed] [Google Scholar]
- 28.MacKerell AD, et al. The Journal of Physical Chemistry B. 1998;102(18):3586–3616. doi: 10.1021/jp973084f. [DOI] [PubMed] [Google Scholar]
- 29.Lu XJ, Olson WK. Nat Protoc. 2008;3(7):1213–1227. doi: 10.1038/nprot.2008.104. [DOI] [PMC free article] [PubMed] [Google Scholar]
- 30.Derreumaux S, Chaoui M, Tevanian G, Fermandjian S. Nucleic Acids Res. 2001;29(11):2314–2326. doi: 10.1093/nar/29.11.2314. [DOI] [PMC free article] [PubMed] [Google Scholar]
- 31.Rivetti C, Guthold M, Bustamante C. J Mol Biol. 1996;264(5):919–932. doi: 10.1006/jmbi.1996.0687. [DOI] [PubMed] [Google Scholar]
- 32.Lysetska M, Knoll A, Boehringer D, Hey T, Krauss G, Krausch G. Nucleic Acids Res. 2002;30(12):2686–2691. doi: 10.1093/nar/gkf378. [DOI] [PMC free article] [PubMed] [Google Scholar]
- 33.Wiggins PA, Van der Heijden T, Moreno-Herrero F, Spakowitz A, Phillips R, Widom J, Dekker C, Nelson PC. Nat Nanotechnol. 2006;1(2):137–141. doi: 10.1038/nnano.2006.63. [DOI] [PubMed] [Google Scholar]
Associated Data
This section collects any data citations, data availability statements, or supplementary materials included in this article.