Abstract
It is sometimes difficult to differentiate between type B3 thymoma from thymic carcinoma histologically. Given the rarity of these tumours, studies have been limited. A series of 66 thymic neoplasms were reviewed and classified according to the World Health Organization (WHO) scheme. We performed a tissue microarray analysis of surgically resected thymic tumour specimens including 12 thymic carcinomas, 17 type B3 thymomas and 37 thymomas of other types. Percentage and staining intensity of immunohistochemical markers were recorded. Tumour eosinophilia was recorded positive if at least one eosinophilic cell identified. Positive staining of the following markers significantly differentiated type B3 thymoma from thymic carcinoma: cytokeratin 5/6 (15 vs. 3), Mesothelin (0 vs. 5), cytoplasmic androgen receptor (10 vs. 0), CD57 (9 vs. 0), CD5 (0 vs. 7), TdT (lymphocytic) (14 vs. 1), CD1a (lymphocytic) (14 vs. 2), CD117 (1 vs. 9), MOC31 (2 vs. 6), p21 (2 vs. 8), cytoplasmic Survivin (0 vs. 4), and tumour eosinophilia (1 vs. 11). Combining two or three markers was able to differentiate these two tumours with area under the curve percentage of at least 92%. Tumour eosinophilia combined with a panel of immunohistochemistry could differentiate type B3 thymoma from thymic carcinoma.
Keywords: differential diagnosis, immunohistochemistry, thymic carcinoma, thymoma, tumour eosinophilia
Thymic carcinomas and thymomas are anterior mediastinal tumours that originate from thymic epithelium. Thymic carcinoma and thymoma have been classified as distinct entities on the basis of morphology (Shimosato et al. 1977; Snover et al. 1982; Wick et al. 1982; Kuo et al. 1990; Suster & Rosai 1991). Later, the World Health Organization (WHO) classified epithelial thymic tumours into six types: A, AB, B1, B2, B3, and thymic carcinoma. Prognostically, type B3 fell between thymic carcinoma and other types of thymoma. On the morphological level, while type B3 thymoma shows cortical-type cells exhibiting no or mild atypia with a minor component of lymphocytes, thymic carcinoma usually has obvious cytologic atypia (Travis et al. 2004). Although this distinction is straightforward, it can be very difficult to distinguish between these two entities, particularly in small biopsies (Morinaga et al. 1987; Datta et al. 2000; Kojika et al. 2009).
Although CD5 and CD117 have been reported as useful markers to distinguish thymic carcinoma from thymoma, they were reported to be expressed in about 50% of thymic carcinoma (Kojika et al. 2009). Moreover, the stains are not always diffuse which limits their use in needle biopsy specimens (Kornstein & Rosai 1998; Pomplun et al. 2002; Nakagawa et al. 2005; Ordo′n˜ ez 2007). Therefore, we sought to evaluate these tumours histologically and screen them immunophenotypically to identify a panel of immunohistochemistry along with histological features that can be used to distinguish these two tumours.
Materials and methods
Patient
In the period from 1982 through 2009, 66 patients with thymic tumours were seen in hospitals in the Buffalo, New York region. We retrospectively studied the pathological features of these patients. Cases were re-classified according to the WHO scheme into types A, AB, B1, B2, B3 and thymic carcinoma. The diagnosis of thymic carcinoma was made after excluding tumour metastases from other sites. Thymic carcinoma cases were subtyped into squamous cell carcinoma and undifferentiated carcinoma. Tumour necrosis and keratin formation were recorded. Tumour eosinophilia was recorded as positive or negative if at least one eosinophilic cell is identified. The number of eosinophilic cells per 10 high power fields was counted. Moreover, the location of the cells was recorded as ‘interface’, if the cells are present at the interface between the tumour and the surrounding reactive stroma; ‘mixed with the tumour’, if the cells are present within the tumour; or ‘mixed’, when the cells are present in both areas.
Tissue microarray and immunohistochemistry
For each case, 2–7 core samples of tumour tissue were acquired from at least two different donor blocks. A relatively high number of cores were taken when variable histological features existed in one case
A list of antibodies with their clones, provider, dilution and antigen retrieval is presented in Table 1. Sections were cut at 5 μm, placed on charged slides and dried in a 60 °C oven for 1 h. Upon return to room temperature, the slides were deparaffinized in three changes of xylene and rehydrated using graded alcohols. Endogenous peroxidase activity was quenched with aqueous 3% hydrogen peroxide for 15 min and washed with phosphate buffered saline with 0.05% Tween-20 (PBS-T). Antigen retrieval was then performed. After a PBS-T wash, casein 0.03% (in PBS-T) was used as a block for 30 min and then the primary antibody was applied to the slides and left for 30–60 min. A PBS-T wash was followed by the biotinylated secondary antibody for 30 min. The PBS-T was followed by the streptavidin complex for 30 min. PBS-T was used as a wash and the Chromagen 3,3′-diaminobenzidine (DAKO, Carpinteria, CA, USA) was applied for 5 min (the colour reaction product was brown). The slides were counterstained with haematoxylin.
Table 1.
Characteristics of antibodies
| Clone | Company | Dilution | Ag retrieval | |
|---|---|---|---|---|
| Thymoma-related markers | ||||
| CD205 | 11A10 | Novacostra | 1:80 | Citrate pH6 |
| FOXn1 | Polyclonal | Abcam | 1:35 | Citrate pH6 |
| Mesothelioma markers | ||||
| D2-40 | M D2-40 | Signet | 1:40 | No pretreatment |
| Calretinin | Dak Calret. 1 | Dako | 1:100 | Vector 10 min |
| WT-1 | P(C-19) | Dako | 1:50 | TRS-Steamer |
| Thrombomodulin | 1009 | Dako | 1:200 | No pretreatment |
| CK5/6 | D5/16B4 | Dako | 1:100 | Vector 10 min |
| HBME | HBME-1 | Dako | 1:10 | No pretreatment |
| Podoplanin | Podoplanin | AngioBio | 1:40 | Citrate buffer |
| Mesothelin | 5B2 | Novocastra | 1:40 | Citrate buffer |
| Transcription factors | ||||
| p63 | 4A4 | Dako | 1:50 | High pH TRS-steamer |
| ER | 1D5 | Dako | 1:100 | Vector 10 min |
| PR | PgR636 | Dako | 1:100 | Vector 10 min |
| AR | AR441 | Dako | 1:50 | High pH TRS-steamer |
| Cluster designation markers | ||||
| CD56 | BC56C04 | Biocare | Prediluted | TRS-steamer |
| CD57 | NK1 | Neomarker | 1:100 | Vector 10 min |
| CD20 | L26 | Dako | 1:1000 | Vector 10 min |
| CD3 | Rabbit polyclonal | Dako | 1:100 | Vector 10 min |
| CD5 | 4C7 | Thermoscience | Prediluted | No pretreatment |
| TdT | Polyclonal | Dako | 1:40 | High pH TRS streamer |
| CD1a | O1O | Dako | 1:50 | Vector 10 min |
| CD138 | MI 15 | Dako | 1:100 | Vector 10 min |
| CD117 | Polyclonal | Dako | 1:50 | Vector 10 min |
| CD15 | C3D-1 | Dako | Prediluted | TRS-steamer |
| Epithelial markers | ||||
| MOC31 | MOC31 | Dako | 1:1000 | TRS-steamer |
| BerEP-4 | BerEP-4 | Dako | 1:200 | Proteinase K |
| EMA | E29 | Dako | 1:600 | No pretreatment |
| E-cadherin | 36B5 | Novocastra | 1:50 | High pH TRS-steamer |
| Cell cycle markers | ||||
| Cyclin D1 | SP4 | Biocare | Prediluted | High pH TRS streamer |
| p21 | SX118 | Dako | 1:35 | Citrate pH6 20 min |
| p27 | SX53G8 | Dako | 1:200 | Citrate pH6 20 min |
| p53 | D07 | Dako | 1:50 | High pH TRS streamer |
| BCL-2 | 124 | Dako | 1:100 | High pH TRS streamer |
| Src | Cat#2180 | Cell signalling | 1:50 | Citrate buffer for 10 min |
| Mitoses markers | ||||
| Survivin | F1-124 | Santa Cruze | 1:200 | Citrate buffer for 10 min |
| Ki-67 | SP6 | Neomarker | 1:200 | High pH TRS streamer |
| Catenins markers | ||||
| α-catenin | C19220 | Transduction laboratories | 1:200 | Citrated pH6 5 min |
| β-catenin | 17C2 | Novocastra | 1:100 | EDTA |
The staining intensity was recorded as 0 (negative), 1 (weak), 2 (moderate) and 3 (strong). The final score was the sum total of the product of the staining intensity and the percentage of stained cells within the tumour. A score greater than 30 was required for the results to be recorded as positive expression.
Certain stains had variable cellular localization including androgen receptor and Survivin (nuclear and cytoplasmic), α-catenin (membranous and cytoplasmic), and β-catenin (membranous, cytoplasmic and granular). CD20 expression was recorded in both lymphocytes and epithelial cells.
Tumour eosinophilia
Only unequivocal bilobed cells with distinctive eosinophilic cytoplasmic granules were considered eosinophils. The number of cells per ten high power (40×) fields (Olympus BX45 microscope, Center Valley, PA, USA) was counted. Eosinophilic cells localization was separated into, interface, mixed with tumour or mixed, as mentioned above.
Statistical analysis
Statistical analyses for categorical variables were performed using Fisher's exact test and logistic regression. Statistical analysis was performed using sas statistical analysis software version 9.1.3 (SAS Institute Inc., Cary, NC, USA). A nominal significance level of 0.05 was used. To determine the predictive ability of the combination of markers, the area under the curve for logistic models were calculated. A perfect marker combination will have an area under the curve of 1.0. In general, if the area under the curve is closer to 1, the better the overall performance of the marker combination, and the closer it is to 0.5, the poorer the test. The small sample size limited our analysis to using only a combination of two markers in each model.
Results
Clinicopathological data and tumour eosinophilia
There were a total of 66 cases (Table 2, Figure 1). There were 24 types A and AB, 13 types B1 and B2, 17 types B3 and 12 thymic carcinoma cases. There were six cases of squamous cell carcinoma (one moderately differentiated and five poorly differentiated) and six cases of undifferentiated carcinoma. Tumour necrosis was identified in five cases while tumour keratinization was seen in one case (Table 3).
Table 2.
Distribution of markers, age, gender and stage by WHO type
| Markers | Freq (%) (n = 66) | A & AB (n = 24) | B1 & B2 (n = 13) | B3 (n = 17) | Thymic carcinoma (n = 12) | |
|---|---|---|---|---|---|---|
| Age | 62.5 (23–90) | 65 (23–79) | 62 (39–90) | 63 (34–80) | 59 (28–81) | |
| Gender | Male | 31 (47) | 10 (41.7) | 8 (61.5) | 10 (58.8) | 3 (25) |
| Female | 35 (53) | 14 (58.3) | 5 (38.5) | 7 (41.2) | 9 (75) | |
| Stage | I | 31 (47) | 17 (70.8) | 9 (69.2) | 5 (29.4) | 0 (0) |
| II | 18 (27.3) | 6 (25) | 2 (15.4) | 7 (41.2) | 3 (25) | |
| III | 8 (12.1) | 0 (0) | 2 (15.4) | 5 (29.4) | 1 (8.3) | |
| IV | 9 (13.6) | 1 (4.2) | 0 (0) | 0 (0) | 8 (66.7) | |
Figure 1.
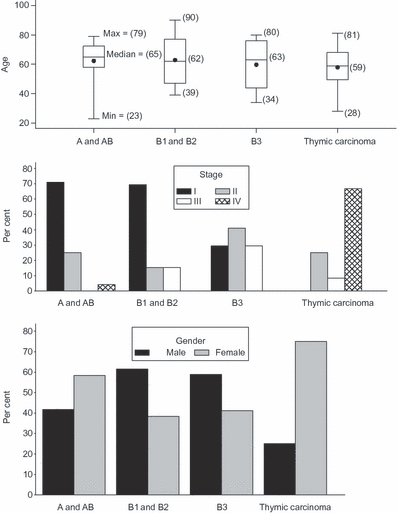
Distribution of WHO types based on age, stage and gender.
Table 3.
Characteristics of tumours with eosinophilia
| Case no. | Tumour type | No. eosinophils/10HPF | Eosinophils lactation | Necrosis | Keratin |
|---|---|---|---|---|---|
| 1 | UDC | 28 | Mixed/interface | + | − |
| 2 | UDC | 8 | Interface | + | − |
| 3 | UDC | 40 | Mixed | − | − |
| 4 | UDC | 12 | Mixed/interface | − | − |
| 5 | UDC | 10 | Mixed/interface | + | − |
| 6 | UDC | 80 | Mixed/interface | − | − |
| 7 | SCCMD | 40 | Interface | − | + |
| 8 | SCCPD | 6 | Interface | + | − |
| 9 | SCCPD | 20 | Mixed/interface | − | − |
| 10 | SCCPD | 10 | Interface | + | − |
| 11 | SCCPD | 60 | Mixed/interface | − | − |
| 12 | SCCPD | 0 | 0* | − | − |
| 13 | B3 thymoma | 5 | Interface | − | − |
UDC, undifferentiated carcinoma; SCCPD, squamous cell carcinoma poorly differentiated; SCCMD, squamous cell carcinoma moderately differentiated; HPF, high power fields.
needle biopsy (interface is not represented)
Tumour eosinophilia was identified in 11 of 12 (91.7%) thymic carcinomas and in 1 of 17 (5.9%) type B3 thymoma (P < 0.0001) (Table 4). In the thymic carcinoma cases, tumour eosinophilia was identified in the interface region [Figure 2(a)] in four cases, mixed with the tumour in one case [Figure 2(b)] and in both regions in six cases. The eosinophilia identified in the type B3 thymoma was seen in the interface [Figure 2(c)]. None of the other thymoma types (A, AB, B1 or B2) had tumour eosinophilia.
Table 4.
Markers distribution with relation to WHO types
| Markers | Freq (%) (n = 66) | A & AB (n = 24) | B1 & B2 (n = 13) | B3 (n = 17) | Thymic carcinoma (n = 12) | *P-value | |
|---|---|---|---|---|---|---|---|
| CD205 | Negative | 12(18.2) | 9(37.5) | 0(0) | 0(0) | 3(25) | 0.06 |
| Positive | 54(81.8) | 15(62.5) | 13(100) | 17(100) | 9(75) | ||
| FOX1 | Negative | 8(12.1) | 4(16.7) | 1(7.7) | 0(0) | 3(25) | 0.06 |
| Positive | 58(87.9) | 20(83.3) | 12(92.3) | 17(100) | 9(75) | ||
| D2-40 | Negative | 50(75.7) | 18(75) | 10(76.9) | 12(70.6) | 10(83.3) | NS |
| Positive | 16(24.2) | 6(25) | 3(23.1) | 5(29.4) | 2(16.7) | ||
| Calretinin | Negative | 66(100) | 24(100) | 13(100) | 17(100) | 12(100) | NA |
| Positive | 0(0) | 0(0) | 0(0) | 0(0) | 0(0) | ||
| WT-1 | Negative | 66(100) | 24(100) | 13(100) | 17(100) | 12(100) | NA |
| Positive | 0(0) | 0(0) | 0(0) | 0(0) | 0(0) | ||
| Thrombomodulin | Negative | 62(94) | 22(91.7) | 12(92.3) | 16(94.1) | 12(100) | NS |
| Positive | 4(6.1) | 2(8.3) | 1(7.7) | 1(5.9) | 0(0) | ||
| CK5/6 | Negative | 28(42.4) | 9(37.5) | 8(61.5) | 2(11.7) | 9(75) | 0.001 |
| Positive | 38(57.6) | 15(62.5) | 5(38.5) | 15(88.2) | 3(25) | ||
| HBME | Negative | 61(93.9) | 22(91.7) | 12(100) | 15(88.2) | 12(100) | NS |
| Positive | 4(6.5) | 2(8.3) | 0(0) | 2(11.8) | 0(0) | ||
| Podoplanin | Negative | 59(89.4) | 22(91.7) | 13(100) | 13(76.5) | 11(91.7) | NS |
| Positive | 7(10.6) | 2(8.3) | 0(0) | 4(23.5) | 1(8.3) | ||
| Mesothelin | Negative | 61(92.4) | 24(100) | 13(100) | 17(100) | 7(58.3) | 0.007 |
| Positive | 5(7.6) | 0(0) | 0(0) | 0(0) | 5(41.7) | ||
| p63 | Negative | 1(1.5) | 0(0) | 0(0) | 0(0) | 1(8.3) | NS |
| Positive | 65(98.5) | 24(100) | 13(100) | 17(100) | 11(91.7) | ||
| ER | Negative | 66(100) | 24(100) | 13(100) | 17(100) | 12(100) | NA |
| Positive | 0(0) | 0(0) | 0(0) | 0(0) | 0(0) | ||
| PR | Negative | 66(100) | 24(100) | 13(100) | 17(100) | 12(100) | NA |
| Positive | 0(0) | 0(0) | 0(0) | 0(0) | 0(0) | ||
| AR (nuclear) | Negative | 65(98.5) | 24(100) | 13(100) | 17(100) | 11(91.7) | NS |
| Positive | 1(1.5) | 0(0) | 0(0) | 0(0) | 1(8.3) | ||
| AR (cytoplasmic) | Negative | 51(77.3) | 23(95.8) | 9(69.2) | 7(41.2) | 12(100) | 0.001 |
| Positive | 15(22.7) | 1(4.2) | 4(30.8) | 10(58.8) | 0(0) | ||
| CD56 | Negative | 66(100) | 24(100) | 13(100) | 17(100) | 12(100) | NA |
| Positive | 0(0) | 0(0) | 0(0) | 0(0) | 0(0) | ||
| CD57 | Negative | 40(60.6) | 12(50) | 8(61.5) | 8(47.1) | 12(100) | 0.003 |
| Positive | 26(39.4) | 12(50) | 5(38.5) | 9(52.9) | 0(0) | ||
| CD20 (epithelial) | Negative | 56(84.9) | 16(66.7) | 12(92.3) | 16(94.1) | 12(100) | NS |
| Positive | 10(15.2) | 8(33.3) | 1(7.7) | 1(5.9) | 0(0) | ||
| CD20 (lymphocytic) | Negative | 57(86.4) | 22(91.7) | 8(61.5) | 15(88.2) | 12(100) | NS |
| Positive | 9(13.6) | 2(8.3) | 5(38.5) | 2(11.8) | 0(0) | ||
| CD3 | Negative | 3(5) | 2(10) | 0(0) | 1(6.3) | 0(0) | NS |
| Positive | 57(95) | 18(90) | 13(100) | 15(93.8) | 11(100) | ||
| CD5 | Negative | 57(89.1) | 23(100) | 13(100) | 17(100) | 4(36.4) | 0.0002 |
| Positive | 7(10.9) | 0(0) | 0(0) | 0(0) | 7(63.6) | ||
| TdT | Negative | 22(34.4) | 10(41.7) | 0(0) | 3(17.7) | 9(90) | 0.0007 |
| Positive | 42(65.6) | 14(58.3) | 13(100) | 14(82.4) | 1(10) | ||
| CD1a | Negative | 24(37.5) | 13(54.2) | 0(0) | 3(17.7) | 8(80) | 0.003 |
| Positive | 40(62.5) | 11(45.8) | 13(100) | 14(82.4) | 2(20) | ||
| CD138 | Negative | 23(34.9) | 4(16.7) | 10(76.9) | 6(35.3) | 3(25) | NS |
| Positive | 43(65.2) | 20(83.3) | 3(23.1) | 11(64.7) | 9(75) | ||
| CD117 | Negative | 56(84.9) | 24(100) | 13(100) | 16(94.1) | 3(25) | 0.0001 |
| Positive | 10(15.2) | 0(0) | 0(0) | 1(5.9) | 9(75) | ||
| EMA | Negative | 34(51.5) | 7(29.2) | 12(92.3) | 10(58.8) | 5(41.7) | NS |
| Positive | 32(48.5) | 17(70.8) | 1(7.7) | 7(41.2) | 7(58.3) | ||
| CD15 | Negative | 56(84.9) | 17(70.8) | 13(100) | 15(88.2) | 11(91.7) | NS |
| Positive | 10(15.2) | 7(29.2) | 0(0) | 2(11.8) | 1(8.3) | ||
| MOC31 | Negative | 57(86.4) | 23(95.8) | 13(100) | 15(88.2) | 6(50) | 0.04 |
| Positive | 9(13.6) | 1(4.2) | 0(0) | 2(11.8) | 6(50) | ||
| BerEpi-4 | Negative | 55(83.3) | 19(79.2) | 13(100) | 14(82.4) | 9(75) | NS |
| Positive | 11(16.7) | 5(20.8) | 0(0) | 3(17.7) | 3(25) | ||
| Cyclin D1 | Negative | 26(39.4) | 8(33.3) | 9(69.2) | 7(41.2) | NS | NS |
| Positive | 40(60.6) | 16(66.7) | 4(30.8) | 10(58.8) | 10(83.3) | ||
| p21 | Negative | 50(75.8) | 19(79.2) | 12(92.3) | 15(88.2) | 4(33.3) | 0.005 |
| Positive | 16(24.2) | 5(20.8) | 1(7.7) | 2(11.8) | 8(66.7) | ||
| p27 | Negative | 6(9.1) | 2(8.3) | 1(7.7) | 2(11.8) | 1(8.3) | NS |
| Positive | 60(90.9) | 22(91.7) | 12(92.3) | 15(88.2) | 11(91.7) | ||
| BCL-2 | Negative | 51(72.3) | 14(58.3) | 13(100) | 15(88.2) | 9(75) | NS |
| Positive | 15(27.3) | 10(41.7) | 0(0) | 2(11.8) | 3(25) | ||
| Src | Negative | 5(7.6) | 1(4.2) | 2(15.4) | 2(11.8) | 0(0) | NS |
| Positive | 61(92.4) | 23(95.8) | 11(84.6) | 15(88.2) | 12(100) | ||
| Survivin (nuclear) | Negative | 50(75.8) | 19(79.2) | 8(61.5) | 15(88.2) | 8(66.7) | NS |
| Positive | 16(24.2) | 5(20.8) | 5(38.5) | 2(11.8) | 4(33.3) | ||
| Survivin (cytoplasmic) | Negative | 59(92.2) | 22(95.7) | 13(100) | 17(100) | 7(63.6) | 0.02 |
| Positive | 5(7.81) | 1(4.4) | 0(0) | 0(0) | 4(36.6) | ||
| Ki-67 | Negative | 27(40.9) | 15(62.5) | 2(15.4) | 7(41.2) | 3(25) | NS |
| Positive | 39(59.1) | 9(37.5) | 11(84.6) | 10(58.8) | 9(75) | ||
| p53 | Negative | 27(40.9) | 14(58.3) | 7(53.9) | 5(29.4) | 1(8.3) | NS |
| Positive | 39(59.1) | 10(41.7) | 6(46.2) | 12(70.6) | 11(91.7) | ||
| α-catenin (membranous) | Negative | 32(48.5) | 15(62.5) | 11(84.6) | 4(23.5) | 2(16.7) | NS |
| Positive | 34(51.5) | 9(37.5) | 2(15.4) | 13(76.5) | 10(83.3) | ||
| α-catenin (cytoplasmic) | Negative | 49(74.2) | 19(79.2) | 8(61.5) | 12(70.6) | 10(83.3) | NS |
| Positive | 17(25.8) | 5(20.8) | 5(38.5) | 5(29.4) | 2(16.7) | ||
| β-catenin (membranous) | Negative | 25(37.9) | 10(41.7) | 7(53.9) | 5(29.4) | 3(25) | NS |
| Positive | 41(62.1) | 14(58.3) | 6(46.2) | 12(70.6) | 9(75) | ||
| β-catenin (cytoplasmic) | Negative | 63(95.5) | 22(91.7) | 13(100) | 16(94.1) | 12(100) | NS |
| Positive | 3(4.6) | 2(8.3) | 0(0) | 1(5.9) | 0(0) | ||
| β-catenin (granular) | Negative | 57(86.4) | 21(87.50) | 13(100) | 16(94.1) | 7(58.3) | NS |
| Positive | 9(13.6) | 3(12.5) | 0(0) | 1(5.9) | 5(41.7) | ||
| E-cadherin | Negative | 32(48.5) | 13(54.2) | 6(46.2) | 8(47.1) | 5(41.7) | NS |
| Positive | 34(51.5) | 11(45.8) | 7(53.9) | 9(52.9) | 7(58.3) | ||
| Tumour eosinophilia | Negative | 54(81.8) | 24(100) | 13(100) | 16(94.1) | 1(8.3) | <0.0001 |
| Positive | 12(18.2) | 0(0) | 0(0) | 1(5.9) | 11(91.7) | ||
P-value reflects B3 vs. thymic carcinoma
Figure 2.
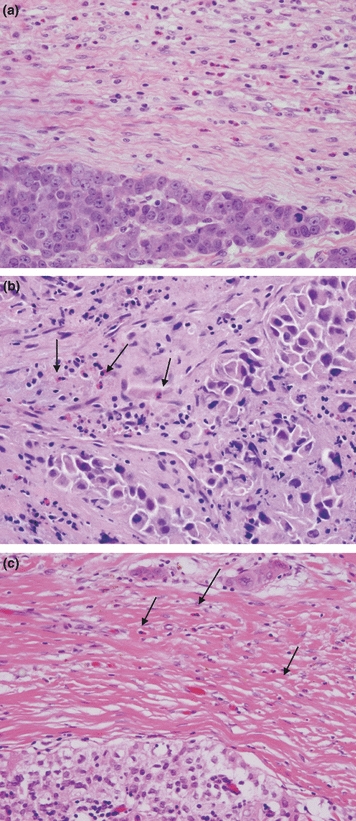
Tumour eosinophilia. (a) Poorly differentiated thymic carcinoma with interface eosinophils (H&E staining, 20×); (b) Poorly differentiated thymic carcinoma with eosinophils mixed within the tumour (arrows, H&E staining, 20×); (c) Type B3 thymoma with sparse interface eosinophils (arrows, H&E staining, 20×).
Immunohistochemistry
Thymic carcinoma had statistically significant more positive staining in the following antibodies compared with type B3 thymoma: CD5 (7 vs. 0), CD117 (9 vs. 1), MOC31 (6 vs. 2), Mesothelin (5 vs. 0) p21, (8 vs. 2) and cytoplasmic Survivin (4 vs. 0) (Table 3, Figure 3).
Figure 3.
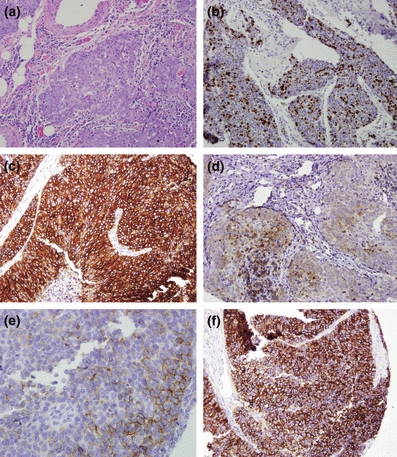
Thymic carcinoma. (a) Thymic carcinoma with clear cytologic atypia and infiltrative growth (H&E staining, 10×); (b) p21 nuclear staining (10×); (c) CD117 diffuse strong cytoplasmic staining (10×); (d) CD5 moderately variably positive (10×); (e) MOC31 weak to moderate focal staining (10×); (f) Mesothelin diffuse strong cytoplasmic staining (10×).
Type B3 thymoma had statistically significant more positive staining in the following antibodies compared with thymic carcinoma: cytokeratin 5/6 (15 vs. 3), cytoplasmic androgen receptor (10 vs. 0), CD57 (9 vs. 0), TdT (14 vs. 1) and CD1a (14 vs. 2) (Table 3, Figure 4). Foxn1 and CD205 had borderline statistically significant power (P = 0.06) in differentiating thymic carcinoma from type B3 thymoma, being the former positive in 100% of cases for both antibodies (Figure 5).
Figure 4.
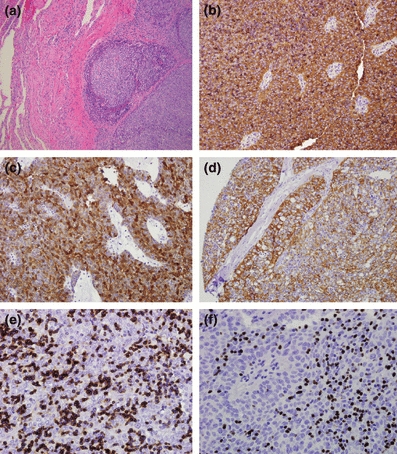
Type B3 thymoma. (a) Atypical thymic cell proliferation with pushing borders to adjacent lung tissue (H&E staining, 20×) (b) CD57 diffuse strong staining (10×); (c) Androgen receptor diffuse strong cytoplasmic staining (10×); (d) Cytokeratin 5/6 and diffuse moderate to strong staining (10×); (e) CD1a stating immature lymphocytes (10×); (f) TdT staining immature lymphocytes (10×).
Figure 5.
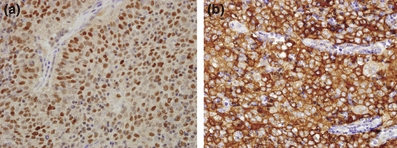
Foxn1 and CD205 staining in type B3 thymoma. (a) Foxn1 nuclear staining (10×); (b) CD205 diffuse strong cytoplasmic staining (10×).
While tumour eosinophilia appears to be the best single marker to differentiate type B3 from thymic carcinoma with area under the curve of 93%, cytokeratin 5/6 appears to be the most useful antibody when combined with two or three antibodies with area under the curve of >94% (Tables 4 and 5, Figures 6–8).
Table 5.
Area under the curve analyses for preferred markers panels to differentiate type B3 vs. thymic carcinoma
| Differentiating markers for B3 vs. thymic carcinoma | Area under the curve % |
|---|---|
| Single marker models | |
| Eosinophilia | 0.93 |
| TdT | 0.86 |
| CD117 | 0.85 |
| CK5/6 | 0.82 |
| CD1a | 0.81 |
| Two markers models | |
| CK5/6, TdT | 0.95 |
| CK5/6, CD117 | 0.95 |
| CK5/6, eosinophilia | 0.95 |
| CK5/6, CD1a | 0.94 |
| CD117, p21 | 0.92 |
| Three marker models | |
| CK5/6, CD117, p21 | 0.96 |
| CK5/6, TdT, MOC31 | 0.96 |
| CK5/6, TdT, CD117 | 0.96 |
| CK5/6, CD1a, CD117 | 0.95 |
| CK5/6, CD1a, MOC31 | 0.95 |
Only markers that were significant in Table 4 were considered for this analysis
Figure 6.
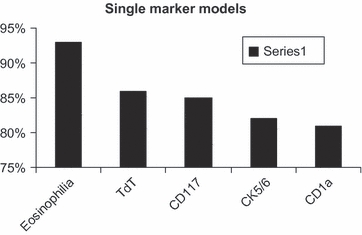
Eosinophilia is the best single marker to differentiate type B3 thymoma from thymic carcinoma.
Figure 8.
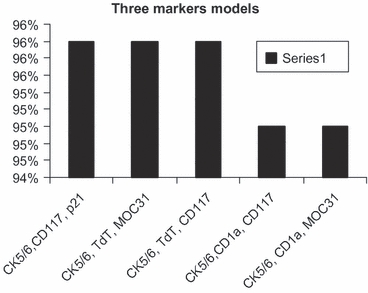
CK5/6 with CD117 and p21, TdT and MOC31 or with TdT, and CD117 are the best three markers to differentiate type B3 thymoma from thymic carcinoma.
Figure 7.
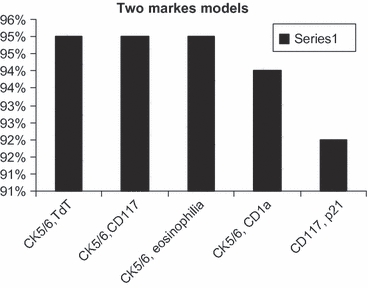
CK5/6 with TdT, CD117 or eosinophilia are the best two markers to differentiate type B3 thymoma from thymic carcinoma.
Discussion
We found that tumour eosinophilia was present in most of thymic carcinoma and in one case of type B3 thymoma. We have reported that elevated eosinophilic cell count in squamous neoplasia of the larynx is a morphological feature associated with tumour invasion (Said et al. 2005). Moreover, the presence of eosinophilic infiltrate has been used to differentiate invasive from in situ carcinoma of the cervix and vulva and has been a prognostic factor for a number of malignancies, including head and neck squamous cell carcinomas (Spiegel 2002; Spiegel et al. 2002; Alrawi et al. 2005). The aetiology of eosinophilic infiltrate is unknown. It has been ascribed to tumour necrosis (Gill 1944), but no relationship has been noted between tumour necrosis and stromal eosinophilia (Bostrom & Hart 1981; Lowe 1988). In our series, there were 6 of 12 thymic carcinoma cases with no necrosis and/or keratinization (Table 3). Therefore, we think the presence of eosinophils is not a reaction to these features. The aetiology has also been attributed to the release of chemotactic factor for eosinophils by T lymphocytes reacting to the tumour (Kapp & LiVolsi 1983; Lowe 1988). It is possible that thymomas have a proportion of non-neoplastic immature T lymphocytes (Sato et al. 1986; Fukayama et al. 1988; Chan et al. 1995) that are incapable of producing chemotactic factors for eosinophils. Thymic carcinoma, on the other hand, acquires mature T lymphocytes, which release chemotactic factors for eosinophils that, at least partially, explains why eosinophilic infiltrate is distinctly present in thymic carcinoma but is present only rarely in other types of thymoma.
This simple observation can be of great help to distinguish type B3 thymoma from thymic carcinoma, particularly in needle biopsy. However, in biopsies that have no interface, this feature will have less diagnostic value, as three thymic carcinomas had eosinophilic cells in the interface only. The only exception is when the biopsy contains both tumour and surrounding stroma. Although eosinophils occasionally seen in type B3 thymoma (one case), the number of cells is relatively small (Table 3).
Among the epithelial and mesothelioma markers studied, cytokeratin 5/6, Mesothelin and MOC31 were useful in differentiating type B3 thymoma from thymic carcinoma. While cytokeratin 5/6 was positive more often in type B3 thymoma, Mesothelin and MOC31 were positive more often in thymic carcinoma. These markers were previously studied with conflicting results (Pan et al. 2003; Kojika et al. 2009). Pan et al. studied 22 thymic carcinoma cases. However, the thymoma cases were not subclassified according to WHO classification, which limits the assessment of markers expression in type B3 thymoma. In thymic carcinoma cases, cytokeratin 5/6 was positive in 95%, MOC31 in 23% and Mesothelin in 36%. It is worth noting that Mesothelin and MOC31 were negative in all cases and cytokeratin 5/6 was positive in most cases of thymomas of all types. Kojika et al. found that cytokeratin 5/6 had no significant difference in its expression between thymic carcinoma and type B3 thymoma (Kojika et al. 2009). However, the number of type B3 thymoma was relatively small (7 cases), comparing with our study (17 cases). This may explain the discrepancy. Moreover, most of our cases were poorly or un- differentiated which might explain the low number of cases that had positive cytokeratin 5/6. They also found that neither Mesothelin nor MOC31 was useful. In our study, it appears that cytokeratin 5/6 is the best common marker to be used in a panel of IHC composed of two or three markers (Table 5).
CD117 has been reported to be a useful marker for the diagnosis of thymic carcinoma (Pan et al. 2004; Nakagawa et al. 2005). It was reported to be positive in up to 90% of thymic carcinomas, comparing with thymoma (5%) (Barisella et al. 2002; Pan et al. 2004; Nakagawa et al. 2005; Kon-no et al. 2006). In our study, CD117 was positive in 75% of thymic carcinoma and in 5.9% of type B3 thymoma. The staining was strong and diffuse in both entities. CD5 was reported to be positive in 50–100% of thymic carcinoma and rare in type B3 thymoma (Kornstein & Rosai 1998; Pomplun et al. 2002; Nakagawa et al. 2005; Nonaka et al. 2007). This, also, is in agreement with our study. While thymic carcinoma was positive in 63.6%, none of type B3 thymoma was positive. The staining was variable ranging from weak focal to moderate and diffuse.
The lymphocytic component in thymic tumours contains a population of immature T lymphocytes, also called thymocytes, characterized by CD1a positive, CD99 positive and TdT positive phenotype. CD1a and TdT were previously studied and found to be of help to differentiate thymoma from thymic carcinoma (Sato et al. 1986; Fukayama et al. 1988; Chan et al. 1995). This finding is also in agreement with our study, as both markers were positive in 82.4% of type B3 thymomas. TdT and CD1a were expressed in 10% and 20% of thymic carcinoma cases respectively. However, these cells composed a small proportion of the lymphocytes.
CD205 is linked to the ‘positive selection’ process for thymic lymphocytes that takes place in the thymic cortex, and Foxn1 is a transcription factor related to the thymic organogenesis (Small & Kraal 2003). They were reported to be positive in the vast majority of thymoma, CD205 was positive in 59% and Foxn1 in 76% of thymic carcinomas (Nonaka et al. 2007). In our study, they were positive in all type B3 thymoma and in 75% of thymic carcinoma with borderline significance (P = 0.06).
Androgen receptor has been described to be expressed in the nucleus and the cytoplasm (Heinlein & Chang 2004). To our knowledge, only one report examined androgen receptor expression in thymic tumours which showed no expression in thymic carcinoma (Kojika et al. 2009). While this observation is in agreement with our study regarding the nuclear localization of the antigen, we found that type B3 thymomas specifically expressed cytoplasmic androgen receptor.
Cell cycle markers including p21, p27, p53, cyclin D1, BCL-2, Src and Survivin have been sparsely studied (Zisis et al. 2004; Baldi et al. 2005; Mineo et al. 2005). All these studies concentrated on the prognostic utility of these markers and studied them in thymomas but not thymic carcinoma. We have described Survivin, Src, p53 and BCL-2 in both thymoma and thymic carcinoma cases, which showed significant correlation with the clinical outcome (Khoury et al. 2009). Although we think these markers are better used as prognostic markers, they can also be used to distinguish between thymoma and thymic carcinoma.
We conclude that the presence of tumour eosinophilia is a good marker for thymic carcinoma. Moreover, we found that a panel of immunohistochemistry including cytokeratin 5/6, Mesothelin, androgen receptor, CD57, CD5, TdT, CD1a, CD117, MOC31, p21 and Survivin could be of assist in differentiating these two entities.
References
- Alrawi SJ, Stoler D, Tan D, et al. Genomic instability, DNA alteration, and tumor eosinophilic expression head and neck squamous cell carcinoma. Cancer Genomics Proteomics. 2005;2:307–316. [PubMed] [Google Scholar]
- Baldi A, Ambrogi V, Mineo D, et al. Analysis of cell cycle regulator proteins in encapsulated thymomas. Clin. Cancer Res. 2005;15:5078–5083. doi: 10.1158/1078-0432.CCR-05-0070. [DOI] [PubMed] [Google Scholar]
- Barisella M, Andreola S, Rosai J. CD117 in soft tissue sarcomas. Am. J. Clin. Pathol. 2002;118:470–471. [PubMed] [Google Scholar]
- Bostrom SG, Hart WR. Carcinomas of the cervix with intense stromal eosinophilia. Cancer. 1981;47:2887–2893. doi: 10.1002/1097-0142(19810615)47:12<2887::aid-cncr2820471223>3.0.co;2-3. [DOI] [PubMed] [Google Scholar]
- Chan JK, Tsang WY, Seneviratne S, et al. The MIC2 antibody 013. Practical application assay for the study of thymic epithelial tumors. Am. J. Surg. Pathol. 1995;19:1115–1123. doi: 10.1097/00000478-199510000-00002. [DOI] [PubMed] [Google Scholar]
- Datta MW, Shahsafaei A, Nadler LM, et al. Expression of MHC class II-associated invariant chain (Ii;CD74) in thymic epithelial neoplasms. Appl. Immunohistochem. Mol. Morphol. 2000;8:210–215. doi: 10.1097/00129039-200009000-00007. [DOI] [PubMed] [Google Scholar]
- Fukayama M, Maeda Y, Funata N, et al. Pulmonary and pleural thymoma. Diagnostic application of lymphocyte markers to the thymoma of unusual site. Am. J. Clin. Pathol. 1988;89:617–621. doi: 10.1093/ajcp/89.5.617. [DOI] [PubMed] [Google Scholar]
- Gill AJ. Local eosinophilia in malignant neoplasms. J. Lab. Clin. Med. 1944;29:820–824. [Google Scholar]
- Heinlein CA, Chang C. Androgen receptor in prostate cancer. Endocr. Rev. 2004;25:276–308. doi: 10.1210/er.2002-0032. [DOI] [PubMed] [Google Scholar]
- Kapp DS, LiVolsi VA. Intense eosinophilic stromal infiltration in carcinoma of the uterine cervix: a clinicopathologic study of 14 cases. Gynecol. Oncol. 1983;16:19–30. doi: 10.1016/0090-8258(83)90004-5. [DOI] [PubMed] [Google Scholar]
- Khoury T, Arshad A, Bogner P, et al. Apoptosis-related (survivin, Bcl-2), tumor suppressor gene (p53), proliferation (Ki-67), and non-receptor tyrosine kinase (Src) markers expression and correlation with clinicopathologic variables in 60 thymic neoplasms. Chest. 2009;136:220–228. doi: 10.1378/chest.08-2482. [DOI] [PubMed] [Google Scholar]
- Kojika M, Ishii G, Yoshida J, et al. Immunohistochemical differential diagnosis between thymic carcinoma and type B3 thymoma: diagnostic utility of hypoxic marker, GLUT-1, in thymic epithelial neoplasms. Mod. Pathol. 2009;22:1341–1350. doi: 10.1038/modpathol.2009.105. [DOI] [PubMed] [Google Scholar]
- Kon-no H, Ishii G, Nagai K, et al. Carbonic anhydrase IX expression is associated with tumor progression and a poor prognosis of lung adenocarcinoma. Lung Cancer. 2006;54:409–418. doi: 10.1016/j.lungcan.2006.08.017. [DOI] [PubMed] [Google Scholar]
- Kornstein MJ, Rosai J. CD5 labeling of thymic carcinomas and other nonlymphoid neoplasms. Am. J. Clin. Pathol. 1998;109:722–726. doi: 10.1093/ajcp/109.6.722. [DOI] [PubMed] [Google Scholar]
- Kuo T-T, Chang J-P, Lin F-G, et al. Thymic carcinomas: histopathologic varieties and immunohistochemical study. Am. J. Surg. Pathol. 1990;14:24–34. [PubMed] [Google Scholar]
- Lowe DG. Carcinoma of the cervix with massive eosinophilia. Br. J. Obstet. Gynaecol. 1988;95:393–401. doi: 10.1111/j.1471-0528.1988.tb06613.x. [DOI] [PubMed] [Google Scholar]
- Mineo TC, Ambrogi V, Mineo D, et al. Long-term disease-free survival of patients with radically resected thymomas: relevance of cell-cycle protein expression. Cancer. 2005;104:2063–2071. doi: 10.1002/cncr.21433. [DOI] [PubMed] [Google Scholar]
- Morinaga S, Sato Y, Shimosato Y, et al. Multiple thymic squamous cell carcinomas associated with mixed type thymoma. Am. J. Surg. Pathol. 1987;11:982–988. doi: 10.1097/00000478-198712000-00009. [DOI] [PubMed] [Google Scholar]
- Nakagawa K, Matsuno Y, Kunitoh H, et al. Immunohistochemical KIT (CD117) expression in thymic epithelial tumors. Chest. 2005;128:140–144. doi: 10.1378/chest.128.1.140. [DOI] [PubMed] [Google Scholar]
- Nonaka D, Henley JD, Chiriboga L, et al. Diagnostic utility of thymic epithelial markers CD205 (DEC205) and Foxn1 in thymic epithelial neoplasms. Am. J. Surg. Pathol. 2007;31:1038–1044. doi: 10.1097/PAS.0b013e31802b4917. [DOI] [PubMed] [Google Scholar]
- Ordo′n˜ ez NG. What are the current best immunohistochemical markers for the diagnosis of epithelioid mesothelioma? A review and update. Hum. Pathol. 2007;38:1–16. doi: 10.1016/j.humpath.2006.08.010. [DOI] [PubMed] [Google Scholar]
- Pan CC, Chen PC, Chou TY, et al. Expression of calretinin and other mesothelioma-related markers in thymic carcinoma and thymoma. Hum. Pathol. 2003;34:1155–1162. doi: 10.1053/j.humpath.2003.07.002. [DOI] [PubMed] [Google Scholar]
- Pan CC, Chen PC, Chiang H. KIT (CD117) is frequently overexpressed in thymic carcinomas but is absent in thymomas. J. Pathol. 2004;202:375–381. doi: 10.1002/path.1514. [DOI] [PubMed] [Google Scholar]
- Pomplun S, Wotherspoon AC, Shah G, et al. Immunohistochemical markers in the differentiation of thymic and pulmonary neoplasms. Histopathology. 2002;40:152–158. doi: 10.1046/j.1365-2559.2002.01328.x. [DOI] [PubMed] [Google Scholar]
- Said M, Wiseman S, Yang J, et al. Tissue eosinophilia: a morphologic marker for assessing stromal invasion in laryngeal squamous neoplasms. BMC Clin. Pathol. 2005;5:1–10. doi: 10.1186/1472-6890-5-1. [DOI] [PMC free article] [PubMed] [Google Scholar]
- Sato Y, Watanabe S, Mukai K, et al. An immunohistochemical study of thymic epithelial tumors II. Lymphoid component. Am. J. Surg. Pathol. 1986;10:862–870. doi: 10.1097/00000478-198612000-00005. [DOI] [PubMed] [Google Scholar]
- Shimosato Y, Kameya T, Nagai K, et al. Squamous cell carcinoma of the thymus: an analysis of eight cases. Am. J. Surg. Pathol. 1977;1:109–121. doi: 10.1097/00000478-197706000-00002. [DOI] [PubMed] [Google Scholar]
- Small M, Kraal G. In vitro evidence for participation of DEC-205 expressed by thymic cortical epithelial cells in clearance of apoptotic thymocytes. Int. Immunol. 2003;15:197–203. doi: 10.1093/intimm/dxg024. [DOI] [PubMed] [Google Scholar]
- Snover DC, Levine GD, Rosai J. Thymic carcinoma five distinctive histological variants. Am. J. Surg. Pathol. 1982;6:451–470. [PubMed] [Google Scholar]
- Spiegel GW. Eosinophils as a marker for invasion in vulvar squamous neoplastic lesions. Int. J. Gynecol. Pathol. 2002;21:108–116. doi: 10.1097/00004347-200204000-00002. [DOI] [PubMed] [Google Scholar]
- Spiegel GW, Ashraf M, Brooks JJ. Eosinophils as a marker for invasion in cervical squamous neoplastic lesions. Int. J. Gynecol. Pathol. 2002;2:117–124. doi: 10.1097/00004347-200204000-00003. [DOI] [PubMed] [Google Scholar]
- Suster S, Rosai J. Thymic carcinoma. A clinicopathologic study of 60 cases. Cancer. 1991;67:1025–1032. doi: 10.1002/1097-0142(19910215)67:4<1025::aid-cncr2820670427>3.0.co;2-f. [DOI] [PubMed] [Google Scholar]
- Travis WD, Brambilla E, Muller-Hermelink HK, et al. In Tumors of the Thymus. Pathology and Genetics of Tumors of the Lung, Pleura, Thymus and Heart. World Health Organization Classification of Tumors. Lyon: IARC Press; 2004. pp. 146–147. [Google Scholar]
- Wick MR, Weiland LH, Sheithauer BW, et al. Primary thymic carcinomas. Am. J. Surg. Pathol. 1982;6:613–630. doi: 10.1097/00000478-198210000-00003. [DOI] [PubMed] [Google Scholar]
- Zisis C, Rontogianni D, Stefanaki K, et al. Expression of cyclins D1, D3 and p27 in thymic epithelial tumors. Interact. Cardiovasc. Thorac. Surg. 2004;3:245–248. doi: 10.1016/j.icvts.2003.10.001. [DOI] [PubMed] [Google Scholar]


