Abstract
Purpose
To test the ability of a multi-band RF pulse to reduce flow enhancement artifacts for steady state imaging without compromising temporal resolution or spatial coverage.
Materials and Methods
Selectively spoiled composite RF pulses that provide simultaneous excitation and flow preparation were designed and tested via simulation, phantom, and in vivo measurements under varying conditions of flow.
Results
Suppression of flow enhancement was found to depend on flow velocity and spatial extent of spoiled regions. By determining necessary pulse characteristics for a given experimental geometry, flow enhancement was reduced and sensitivity to T1-reducing contrast agent was dramatically increased.
Conclusion
These pulses provide an effective means of suppressing flow enhancement without sacrificing temporal resolution or spatial coverage.
Introduction
Dynamic, contrast-enhanced (DCE)-MRI is often used to quantitatively evaluate tumor response to therapeutic intervention (1). This technique is sensitive to differences in the rate of extravasation and clearance of an exogeneous contrast agent between blood and tissues under observation (2). Pharmacokinetic models provide a framework for quantitative assessment of microvascular function by relating the exchange of contrast agents between blood and tissue to parameters (e.g., Ktrans, kep, vb) that are related to physiological characteristics such as blood flow and perfusion (3).
Meaningful pharmacokinetic parameter estimation requires reliable dynamic measurement of the concentration of the contrast agent in both tissue and in blood (4). Measurement of the time course in blood, known as the vascular input function (VIF), is challenging, especially in small animal models of cancer (5). In particular, flow-related enhancement may distort the measured VIF.
Although many approaches to VIF measurement in small animal models of disease have been attempted (5–9), reproducible, non-invasive measurement of the VIF remains difficult (5). Flow-related enhancement is a common phenomenon in vascular structures, and it can cause substantial interference in the quantification of contrast agent concentrations(10). To avoid this artifact, these VIF measurements have used time-consuming saturation-recovery techniques that yield flow-insensitive measurements at the cost of reducing slice coverage to only 1–3 slices and image update rates of 4–7s (6,8). More efficient techniques to prepare flowing spins would allow expanded tumor coverage or improved temporal resolution while minimizing distortion of the VIF due to flow enhancement.
In this work, we evaluate the feasibility of a selectively-spoiled RF pulse for murine DCE-MRI that simultaneously excites spins in the imaging plane while preparing spins that may be flowing through adjacent regions. Preparation is achieved by a combination of RF pulses that are offset symmetrically in time and in space from the imaging plane and that make efficient use of the slice refocusing gradient pulse for spoiling. This approach is tested via simulation, in phantom, and in vivo. Results demonstrate effective suppression of flow enhancement over a range of spin velocities without compromising sequence timing, which will enable VIF measurement with reduced artifacts and uncompromised slice coverage.
Theory
Regions of an image that contain through-plane flow appear hyperintense if the spins entering the plane have greater longitudinal magnetization than stationary spins at equilibrium. Preparation using a 90° pulse eliminates inflow enhancement, but the delay required in order to recover sufficient signal for VIF measurement significantly compromises sequence timing.
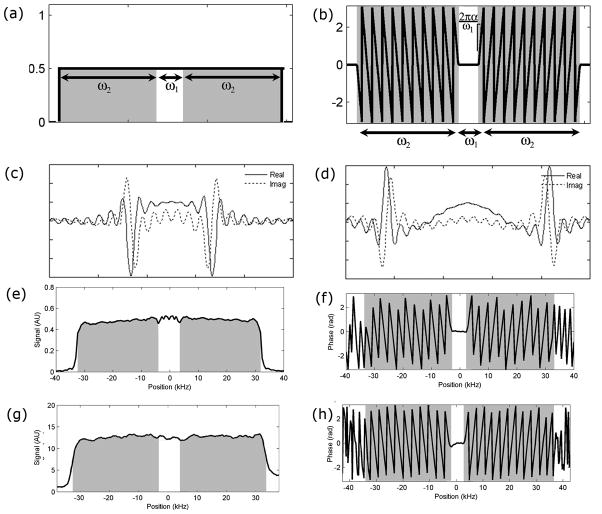
Alternatively, out-of-slice magnetization can also prepared by repeated exposure to lower power pulses (11) that places incoming spins at the same-steady state signal level as those that remain within the slice of interest. This spatial presaturation may be accomplished efficiently by combining the presaturation and excitation pulses into a single composite pulse. This can be achieved using a slice profile that consists of a uniform central region, corresponding to the desired imaging plane, and peripheral preparation regions exhibiting constant amplitude but a linear phase dependence that integrates to zero along the slice-select direction. A constant magnitude across central and peripheral regions ensures that all spins are prepared for steady state imaging when spins flow from the peripheral region into the imaging plane. The spectral content of this pulse (Figure 1ab) can be expressed as:
where ω1 is the bandwidth of the coherent region of the slice, ω2 is the additional bandwidth that is excited but spoiled for flow preparation, and the amplitude of the phase gradient in the spoiled region is 2πα/ω1. Because relatively shallow flip angles are used, the RF waveform can be calculated by Fourier transformation of the desired slice profile (12,13), leading to:
Figure 1.
Theoretical and measured representations of the composite pulse in spectral and spatial domains. The ideal pulse profile has constant amplitude (a) and phase (b) across the excitation bandwidth (ω1) with spatially dependent phase over the flow preparation bandwidth (ω2). The rate of phase change in the spoiled regions corresponds to the shift in time between excitation spoiling components, illustrated for ω2/ω1 = 3, α = 1 (c) and α = 2 (d). Simulation shows pulses are easily implemented via Fourier transform to provide relatively uniform amplitude (e) and expected phase behavior (f) for ω2/ω1 = 5 and α = 2. Phantom measurements of the same pulse confirm amplitude (g) and phase (h) perform as expected. In all plots, shaded areas denote the spoiling region.
The amplitude of the phase gradient in the spoiled region corresponds to the temporal shift between the centers of the excitation and spoiling pulses. Representative waveforms for two different rates of phase change are shown in Figure 1cd. The presence of three distinct components results from the reversal of the phase gradient in the spoiled regions on each side of the slice. A cosine-modulated envelope for the flow preparation waveform (14) results when the phase relationship is not reversed. This produces a pulse with similar flow suppressive properties, but higher peak power requirements, and was not used in this work.
Methods
All experiments and procedures were approved by our Institutional Animal Care and Use Committee, accredited by the Association for the Assessment and Accreditation of Laboratory Animal Care International. All data was acquired on a Biospec USR47/40 (Bruker Biospin MRI, Billerica, MA) 4.7 T small animal MR scanner.
To validate the excitation waveform, the Bloch equation was numerically solved using Matlab (Mathworks, Natick, MA). The ratio of the widths of the spoiled to the coherent excitation regions, ω2/ω1, was varied from 1 through 5 with two phase revolutions per slice select bandwidth (α = 2) for pulses with a 30° excitation angle.
The same pulses were implemented on the scanner and slice profiles were measured to confirm the simulations experimentally. Excitation was performed with the composite RF pulse, followed by a nonselective 180° refocusing pulse to measure the magnitude and phase of the excited magnetization. Acquisition parameters were: TE = 12.4 ms, TR = 4000 ms, matrix size = 256, FOV = 3 cm, receiver bandwidth = 85 kHz, flip angle = 30°. The pulse duration was 1 ms, yielding bandwidths of 6210 Hz for the coherent band, corresponding to a coherent region width of 2.2mm. Sideband widths from 2.2mm to 11mm were used.
Simulations were performed to investigate the convergence of the magnetization of flowing spins when excited using the composite RF pulse. The Bloch equation was numerically integrated, assuming constant linear motion of spins with velocities ranging from 1 mm/s to 20 mm/s. Simulation parameters were: TR = 40 ms, flip angle = 30°, T1 = 1800 ms, gradient strength = 140 kHz. The composite pulse had a duration of 1 ms, α = 2 and ω2/ω1 = 9.
The ability of the RF pulse to perform suppression of flow enhancement was tested in phantom. A silicone catheter was embedded within a bovine gel phantom. Flow was introduced in the catheter using a power injector (Harvard Apparatus, Boston, MA). Composite RF pulses with α = 1 and 2 and ω2/ω1 = 1 to 5 were used. For each pulse, spoiled gradient echo images were acquired of the phantom with and without flow. Acquisition parameters were: TE = 2.75 ms, TR = 20 ms, flip angle = 25°, matrix size = 256×192, FOV = 4.1 × 3.1cm, receiver bandwidth = 80 kHz, pulse length = 1 ms, slice thickness = 1 mm. Flow rates ranged from 0.05 mL/min (average linear velocity of 0.6 mm/s) to 1 mL/min (12 mm/s). The percent signal enhancement from baseline due to the presence of flow was calculated as (Sflow – Sbase)/Sbase × 100% for each pulse and flow combination.
In vivo measurements were acquired to test the ability of the RF pulse to suppress flow enhancement under realistic conditions of pulsatile flow at physiological velocities. Separately acquired short axis images of the heart and axial images of the abdomen, in which the inferior vena cava (IVC) was visible, were acquired using a spoiled gradient echo sequence. Acquisition parameters were: TE = 1.7 ms, TR = 40 ms, matrix size = 128×128, FOV = 3×3 cm, receiver bandwidth = 80 kHz, number of averages = 20, flip angle = 30°, pulse duration = 1 ms, slice thickness = 1 mm. Composite RF pulses with α = 2 and ω2/ω1 = 1 to 7 were used to achieve flow preparation, and a sinc pulse with matching bandwidth was used as a control. Average signal intensity of the blood within the left ventricle and the IVC were measured and normalized to signal from muscle within each acquisition.
The change in sensitivity to the presence of contrast agent with and without presaturation was demonstrated by acquiring a series of short-axis cardiac images with interleaved use of composite and standard excitation pulses. Baseline T1 measurements were performed using a variable flip angle protocol with a spoiled gradient echo sequence with TE = 1.7ms, TR = 40 ms, matrix size = 128×96, FOV = 3×3 cm, slice thickness = 1 mm, receive bandwidth = 80 kHz, and 10 averages to minimize interference from motion. Identical acquisitions were performed using either a sinc pulse or a composite RF pulse of equal duration with ω2/ω1 = 5, α = 2 and excitation angles of 10°, 20°, 30°, and 40°. T1 was calculated by fitting the measured signal to the signal equation with a nonlinear least-squares fit (15). After T1 measurement, a 0.1 mmol/kg dose of contrast agent (gadopentetate dimeglumine) was injected through a tail vein catheter. Dynamic images were acquired beginning approximately 30 seconds after the injection of contrast agent. Acquisition parameters that were identical to the T1 mapping protocol were used (ie, TE = 1.7ms, TR = 40 ms, matrix size = 128×96, FOV = 3×3 cm, slice thickness = 1 mm, receive bandwidth = 80 kHz, 10 averages), except for a fixed excitation angle (30°). A total of 64 images were acquired, with excitation performed in an alternating fashion using either the reference sinc pulse or the composite pulse for each repetition to yield a total of 32 images acquired using each pulse. Alternating acquisition of image pairs with and without flow preparation allowed direct comparison of signal enhancement in images acquired under identical physiological conditions and blood concentration levels. This procedure was repeated for three different mice.
Results
Simulations reveal slice profiles with constant amplitude except for a slight artifact at the transition between excitation and spoiling regions. This artifact results from asymmetric truncation of components of the waveform that achieve flow enhancement suppression. A representative profile for ω2/ω1 = 5 is shown in Figure 1ef. Corresponding measurements in phantom demonstrate good reproduction of the intended pulse, with similar artifacts in transition regions as seen in the simulations (Figure 1gh). A baseline measurement with a non-selective excitation pulse was used to correct for variations in the signal due to phantom alignment.
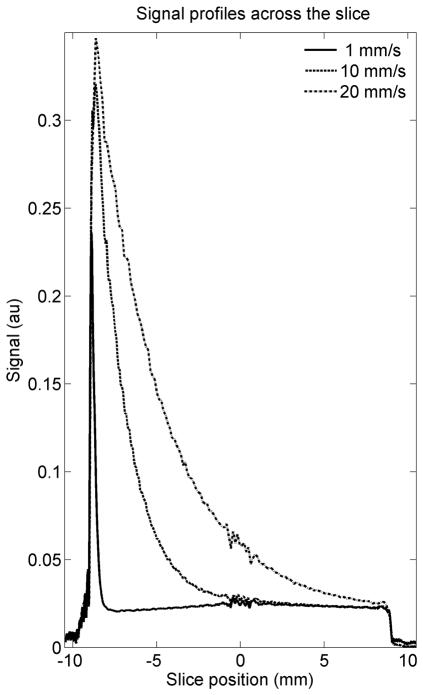
The numerical simulations of flow produced signal profiles along the slice direction, with flow-dependent transitions toward steady-state magnetization levels, as shown in Figure 2. The magnetization reaches its steady state value before arriving at the coherent portion of the slice for velocities of up to 10 mm/s. Although this velocity is somewhat less than average velocities of 23 cm/s which have been reported in the murine aorta (16), it must be considered that linear velocity in the heart will be slower because the ventricle is larger than the aorta and that the width of the saturation region is extended by the tortuous path blood must travel before entering the ventricle. More rapid linear flow may prevent spins from reaching steady state before reaching the coherent center, resulting in incomplete suppression and residual enhancement due to flow.
Figure 2.
The signal profile along the slice for the spatial composite pulse under different flow conditions. Linear velocities 10 mm/s are fully prepared to steady state levels by the time they reach the center of the slice for this protocol, while higher rates of flow require further optimization
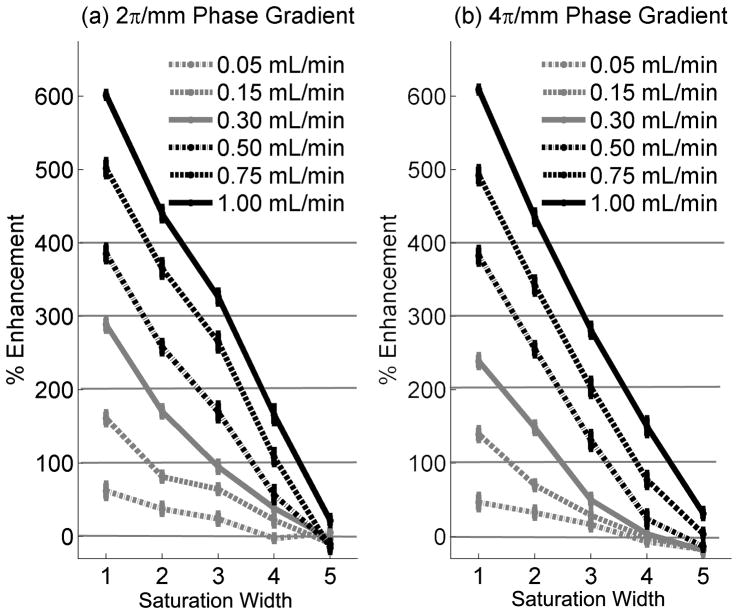
The RF pulse effectively suppressed flow enhancement over a range of flow rates in phantom. The use of a 5 mm saturation width reduced the signal in the catheter in the presence of flow to slightly less than that of stationary spins for all but the most rapid flow, as illustrated in Figure 3. Although both degrees of spoiling performed well at suppressing inflow enhancement, we chose to use the greater amount (α = 2), which produced a 3–24% greater decrease in flow enhancement, for in vivo measurements as a precautionary measure.
Figure 3.
The percent signal increase due to flow enhancement relative to the baseline with no flow, for 2π/mm (a) and 4π/mm (b). Flows are specified volumetrically because linear flow rates contain a mixture of velocities.
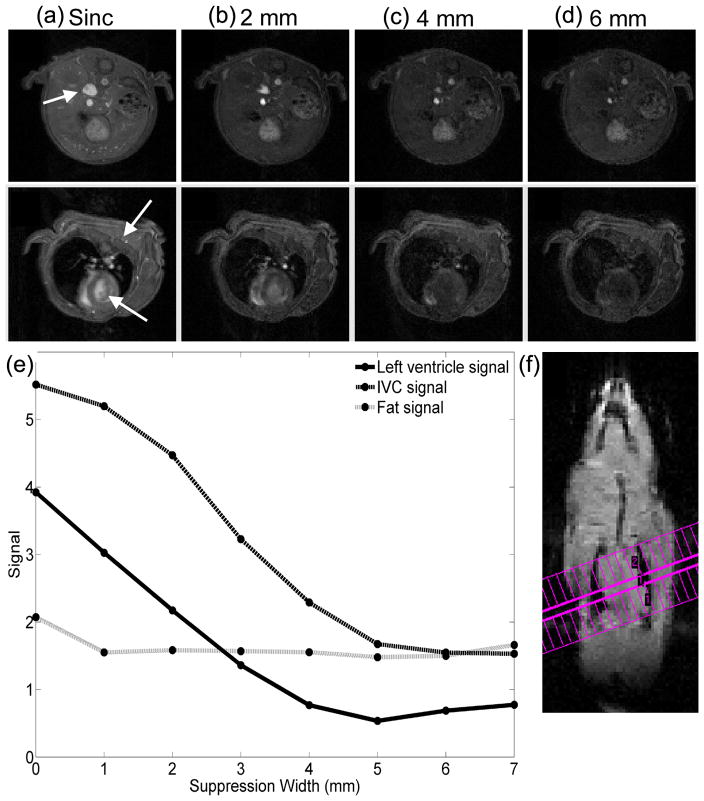
The signal in the ventricle and IVC decreased with the sideband width, as shown in Figure 4, indicating a reduction in flow-related enhancement. The signal from the IVC and left ventricle converged to a stable level by ω2/ω1 = 5, corresponding to 5 mm flow preparation regions on either side of the slice. The ultimate stability of the vascular signal is a strong indicator that spins are in steady state before arrival at the coherent region. The signal from fat is nearly independent of the sideband width, with a coefficient of variation of 4% over the widths considered. The composite pulses produced slightly lower signals than the sinc pulse due to partial spoiling of transition regions along the edge of the slice where the tip angle of the excitation pulse is closer to the Ernst angle than the prescribed excitation angle.
Figure 4.
Comparison of flow enhancement in cardiac and abdominal images as a function of flow preparation region width for 1mm target slices. Images were acquired with a sinc pulse (a) and the flow suppressive pulse over multiple sideband widths (b–d). The signal from fat is stable as spoiled regions increase in extent, indicating that the signal from those regions is effectively suppressed (e). The geometry of the cardiac slice, shown in (f), shows that the saturation region covers the majority of the lungs and heart and thus has much a much longer interval to bring spins in blood to steady state.
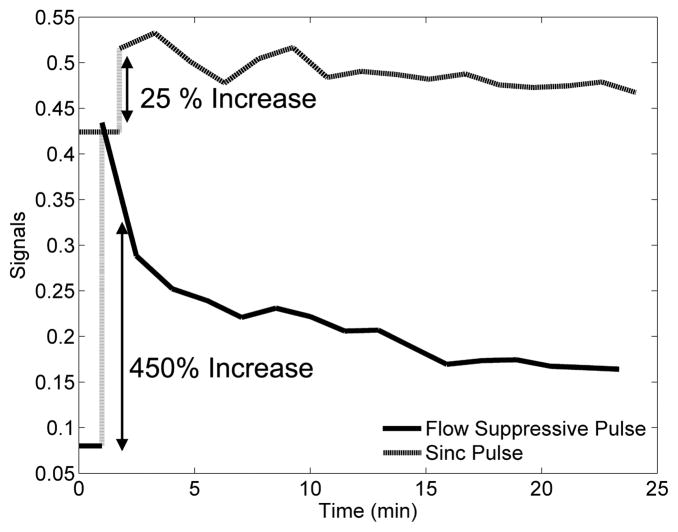
As expected, the apparent T1 of blood differed substantially when measured with the conventional sinc pulse (196 ms) compared to the flow suppressive composite pulse (1739 ms). Comparison of signal time courses in the left ventricle with and without flow preparation following administration of a T1-reducing contrast agent highlights the loss of sensitivity caused by inflow enhancement (e.g., Figure 5) using conventional excitation. Although the sinc pulse produces a larger baseline signal due to the flow enhancement, the introduction of contrast agent produces only a 7–25% change in the signal. The same contrast agent concentration produced a 160–430% increase in signal amplitude measured with suppression of flow enhancement.
Figure 5.
Signal time courses for measurements made with both the flow suppressive composite pulse and a matched sinc pulse that provides no preparation of flowing spins. The baseline (pre-injection) signals are shown as horizontal lines. Signal is higher at baseline for the conventional pulse due to flow enhancement, and sensitivity to presence of a T1-reducing contrast agent is dramatically lower.
Discussion
Although DCE-MRI is an important tool for studies involving small animal models of human disease, repeatable VIF measurement is difficult due to partial volume and inflow enhancement artifacts associated with local blood vessels (17). This has led to considerable effort in the development of techniques to address these limitations (5,8). Quantification in the presence of flow is necessary, but current approaches to suppression of flow enhancement sacrifice considerable sequence time. We have demonstrated the feasibility of a composite RF pulse that significantly attenuates flow enhancement during excitation, thus improving VIF measurement without penalty to sequence timing.
This pulse has been evaluated for use with a 2-D slice-selective acquisition scheme. Extending this approach to 3-D volume-selective acquisitions would introduce refocusing of spoiling phase along the slab-selective direction. Care would be necessary to avoid artifacts resulting from this deleterious refocusing. In multi-slice DCE-MRI, use of this composite pulse is most efficient when applied to a slice dedicated to VIF measurement, acquired in an interleaved fashion with slices providing tumor coverage.
With a saturation width of 5 mm and a phase gradient of 4π/mm, we achieved excellent image quality and suppression of flow enhancement. In vivo data indicates a substantial attenuation of vascular flow enhancement. The T1 of mouse blood, as measured from a 1mm slice with 5mm preparation bands, is consistent with the values reported by Pickup, et al. of 1780±60 ms at 4.7T (8). The signal of stationary tissues has been found to be stable with increasing saturation width, indicating effective spoiling of the out-of-slice signal.
The coherent region at the center of the profile is the source of signal, and maximum sensitivity to contrast agent is achieved when spins have reached steady state prior to their arrival in this region. An inadequate phase gradient may produce imperfect spoiling, and the resulting flow enhancement would be greatest when flow is linear and perpendicular to the slice. This artifact may be manifest in the relative hyperintensity of the IVC and thoracic vessels, as compared to the left ventricle (as seen in Fig 4). Because blood in the left ventricle passes through the lungs and other cardiac chambers before arriving at the measurement site, this effect is not expected to be significant in flow-prepared slices traversing the heart and lungs. The acquisition geometry must be carefully considered for accurate measurements using this technique.
In conclusion, this multi-band, selectively spoiled excitation pulse demonstrates efficient attenuation of flow enhancement by simultaneous excitation and spatial presaturation. Sensitivity to contrast-related T1 changes due is dramatically increased without penalizing sequence timing. This technique is easily implemented and integrated into steady-state imaging sequences to improve the accuracy of VIF measurements.
References
- 1.Leach MO, Brindle KM, Evelhoch JL, Griffiths JR, Horsman MR, Jackson A, Jayson GC, Judson IR, Knopp MV, Maxwell RJ, McIntyre D, Padhani AR, Price P, Rathbone R, Rustin GJ, Tofts PS, Tozer GM, Vennart W, Waterton JC, Williams SR, Workman P Pharmacodynamic/Pharmacokinetic Technologies Advisory Committee DDOCRUK. The assessment of antiangiogenic and antivascular therapies in early-stage clinical trials using magnetic resonance imaging: issues and recommendations. British Journal of Cancer. 2005;92(9):1599–1610. doi: 10.1038/sj.bjc.6602550. [DOI] [PMC free article] [PubMed] [Google Scholar]
- 2.McDonald DM, Baluk P. Significance of blood vessel leakiness in cancer. Cancer Research. 2002;62(18):5381–5385. [PubMed] [Google Scholar]
- 3.Buckley DL. Uncertainty in the analysis of tracer kinetics using dynamic contrast-enhanced T1-weighted MRI. Magnetic Resonance in Medicine. 2002;47(3):601–606. doi: 10.1002/mrm.10080. [DOI] [PubMed] [Google Scholar]
- 4.Tofts PS, Brix G, Buckley DL, Evelhoch JL, Henderson E, Knopp MV, Larsson HB, Lee TY, Mayr NA, Parker GJ, Port RE, Taylor J, Weisskoff RM. Estimating kinetic parameters from dynamic contrast-enhanced T(1)-weighted MRI of a diffusable tracer: standardized quantities and symbols. Journal of magnetic resonance imaging: JMRI. 1999;10(3):223–232. doi: 10.1002/(sici)1522-2586(199909)10:3<223::aid-jmri2>3.0.co;2-s. [DOI] [PubMed] [Google Scholar]
- 5.Yankeelov TE, Luci JJ, Lepage M, Li R, Debusk L, Lin PC, Price RR, Gore JC. Quantitative pharmacokinetic analysis of DCE-MRI data without an arterial input function: a reference region model. Magnetic Resonance Imaging. 2005;23(4):519–529. doi: 10.1016/j.mri.2005.02.013. [DOI] [PubMed] [Google Scholar]
- 6.McIntyre DJ, Ludwig C, Pasan A, Griffiths JR. A method for interleaved acquisition of a vascular input function for dynamic contrast-enhanced MRI in experimental rat tumours. NMR Biomed. 2004;17(3):132–143. doi: 10.1002/nbm.868. [DOI] [PubMed] [Google Scholar]
- 7.Simpson NE, He Z, Evelhoch JL. Deuterium NMR tissue perfusion measurements using the tracer uptake approach: I. Optimization of methods. Magn Reson Med. 1999;42(1):42–52. doi: 10.1002/(sici)1522-2594(199907)42:1<42::aid-mrm8>3.0.co;2-z. [DOI] [PubMed] [Google Scholar]
- 8.Pickup S, Zhou R, Glickson J. MRI estimation of the arterial input function in mice. Academic Radiology. 2003;10(9):963–968. doi: 10.1016/s1076-6332(03)00291-5. [DOI] [PubMed] [Google Scholar]
- 9.Pathak AP, Artemov D, Bhujwalla ZM. Novel system for determining contrast agent concentration in mouse blood in vivo. Magn Reson Med. 2004;51(3):612–615. doi: 10.1002/mrm.10727. [DOI] [PubMed] [Google Scholar]
- 10.Jackson A, Jayson GC, Li KL, Zhu XP, Checkley DR, Tessier JJ, Waterton JC. Reproducibility of quantitative dynamic contrast-enhanced MRI in newly presenting glioma. British Journal of Radiology. 2003;76(903):153–162. doi: 10.1259/bjr/70653746. [DOI] [PubMed] [Google Scholar]
- 11.Felmlee JP, Ehman RL. Spatial presaturation: a method for suppressing flow artifacts and improving depiction of vascular anatomy in MR imaging. Radiology. 1987;164(2):559–564. doi: 10.1148/radiology.164.2.3602402. [DOI] [PubMed] [Google Scholar]
- 12.Haacke EM, Brown RW, Thompson MR, Venkatesan R. Magnetic Resonance Imaging: Physical Principles and Sequence Design. New York: John Wiley & Sons; 1999. A Closer Look at RF Pulses. [Google Scholar]
- 13.Hinshaw WS, Lent AH. An Introduction to Nmr Imaging - from the Bloch Equation to the Imaging Equation. Proceedings of the Ieee. 1983;71(3):338–350. [Google Scholar]
- 14.Alsop DC, Detre JA. Multisection cerebral blood flow MR imaging with continuous arterial spin labeling. Radiology. 1998;208(2):410–416. doi: 10.1148/radiology.208.2.9680569. [DOI] [PubMed] [Google Scholar]
- 15.Schabel MC, Parker DL. Uncertainty and bias in contrast concentration measurements using spoiled gradient echo pulse sequences. Phys Med Biol. 2008;53(9):2345–2373. doi: 10.1088/0031-9155/53/9/010. [DOI] [PMC free article] [PubMed] [Google Scholar]
- 16.Hartley CJ, Michael LH, Entman ML. Noninvasive measurement of ascending aortic blood velocity in mice. Am J Physiol. 1995;268(1 Pt 2):H499–505. doi: 10.1152/ajpheart.1995.268.1.H499. [DOI] [PubMed] [Google Scholar]
- 17.Yankeelov TE, Cron GO, Addison CL, Wallace JC, Wilkins RC, Pappas BA, Santyr GE, Gore JC. Comparison of a reference region model with direct measurement of an AIF in the analysis of DCE-MRI data. Magnetic Resonance in Medicine. 2007;57(2):353–361. doi: 10.1002/mrm.21131. [DOI] [PubMed] [Google Scholar]


