

Abstract
Genetic differences among tree species, their hybrids and within tree species are known to influence associated ecological communities and ecosystem processes in areas of limited species diversity. The extent to which this same phenomenon occurs based on genetic variation within a single tree species, in a diverse complex ecosystem such as a tropical forest, is unknown. The level of biodiversity and complexity of the ecosystem may reduce the impact of a single tree species on associated communities. We assessed the influence of within-species genetic variation in the tree Brosimum alicastrum (Moraceae) on associated epiphytic and invertebrate communities in a neotropical rainforest. We found a significant positive association between genetic distance of trees and community difference of the epiphytic plants growing on the tree, the invertebrates living among the leaf litter around the base of the tree, and the invertebrates found on the tree trunk. This means that the more genetically similar trees are host to more similar epiphyte and invertebrate communities. Our work has implications for whole ecosystem conservation management, since maintaining sufficient genetic diversity at the primary producer level will enhance species diversity of other plants and animals.
Keywords: community genetics, ecosystem conservation, genetic interactions, species interactions, amplified fragment length polymorphisms
1. Introduction
Within an ecological community, many species exist together and both direct and indirect interactions occur between species. Species interact with each other by a variety of means (e.g. competition, predation, mutualism, commensalism and parasitism) and each species in a community will experience numerous interactions with many other species. Additional complexity occurs when the specific combinations of genotypes of the interacting species influence the outcome of direct and indirect species interactions [1–6]. It is, therefore, understood that genetic variation within a species and genotypic interactions between different species can have strong effects on another species in a community. However, experiments that quantify the effect of another species' genotype on the phenotype of a focal species are often limited to experimental communities with a small number of species owing to complexity and cost. This work can create unnatural genotypic combinations, minimizes abiotic (and other biotic) variation and may not reflect the true influence of these interactions in a natural ecosystem [7].
An alternative approach to understand how genetic variation within a species influences the associated community is to consider genetic variation in a focal species, and determine how this is associated with the surrounding community structure of particular species groups. Within temperate ecosystems, genetic variation within a dominant plant species can influence the structure of the associated invertebrate [8–17], plant [18], endophytic fungi [19] and vertebrate [20,21] communities. An important factor in these interactions has been found to be plant biochemistry. Many plant species accumulate specific chemicals (e.g. phenols, monoterpenes and tannins) in their leaves, which reduce herbivory and can influence the chemistry of the surrounding soil when the leaves drop to the ground. Chemical diversity in Scots pine has been found to influence the surrounding species richness of understory plants [18] and leaf tannin concentration has been demonstrated as having a large effect on the associated animal communities of cottonwood trees [17,20–24]. Leaf decomposition rates and leaf litter nutrient concentrations are also influenced by plant genetic variation [25–27], through variation in leaf chemistry. These factors will, in turn, influence ecosystem processes such as nitrogen mineralization [24] and can affect indirectly interacting communities, such as aquatic fauna [25].
There is a vast amount of evidence showing that plant genotype, especially for tree species, can have a strong effect on associated species, and community and ecosystem processes. However, thus far, all the studies are from temperate regions of the world where species diversity and ecosystem complexity are low compared with the species-rich tropical regions. Within-species genetic variation is expected to have a greater impact on the surrounding ecosystem when species diversity and genetic diversity are limited. To what extent these effects will be important in an ecosystem with high species and genetic diversity is unknown. In a genetically diverse population of trees, a genetic mosaic of ecosystem function could arise which means that the environment (biotic and abiotic) around a single tree differs owing to tree genotype [28,29]. This leads to a heterogeneous environment, and thus, different tree genotypes within a diverse ecosystem could still differentially influence the structure of associated communities and even the coevolution of species [29]. In this study, we investigated the effect of within-species genetic variation in a tropical tree species on both plant and invertebrate communities in a diverse complex natural tropical ecosystem.
Epiphytic plants are highly diverse and abundant in tropical forests, and they use the trees as hosts for structural support to gain access to light. Previous work has found that epiphyte species have some preference for different host species, but no particular host trait was found to explain the associations observed [30]. A recent study showed that 80 per cent of epiphyte species actually showed a random distribution among tree hosts in a tropical forest; however, this means that 20 per cent of the epiphyte species studied showed host preference for (i.e. non-random association with) certain tree species [31]. Within a species, individual trees vary in the abundance of epiphytes to which they are host and this can only partially be explained by tree size and branch area [32]. It is plausible that genetically based traits within a tree species will influence which epiphyte species will grow on them and therefore the community structure of the epiphytic flora.
Invertebrates are one of the most species diverse groups of organisms in a tropical forest and previous work has demonstrated that tree genotype can influence invertebrate community structure. Within a tropical forest ecosystem, there are numerous different habitats around a tree in which invertebrates may live, including tree leaves, canopy branches, in epiphytic plants, under bark, on the trunk, on rotting areas, as well as around the base of the tree in the soil and leaf litter. These habitats are likely to contain different invertebrate communities; the extent to which a single tree influences these communities may differ, leading to variation in the strength of effect of tree genetic variation on these different associated communities.
In this study, we investigated the influence of genetic variation within a single tree species (Brosimum alicastrum: Moraceae) on the epiphytic floral community and three different invertebrate faunal communities, in a tropical forest ecosystem. This is the first study to date in which community genetic approaches have been used in an attempt to understand how genetic variation within a single tree species can influence associated communities in a complex and diverse tropical ecosystem. We aim to determine whether the influence of tree genotype on associated ecological communities is still measurable in a complex tropical system or if the complexity of the system overcomes the effect because of the increase in the number of species interactions expected in tropical systems.
2. Material and methods
(a). Study site and tree species
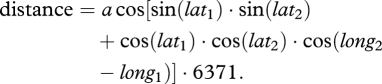
This study was undertaken in the Chiquibul Forest around Las Cuevas Research Station, Belize, Central America. The sample area was approximately 4 km2. The tree species studied was the breadnut, B. alicastrum (Moraceae), which is a common tree species in this area. It can grow up to 40 m in height and produces large nutritious fruits on which many animals and birds feed [33]. Geographical location was recorded using a global positioning system (GPS) unit and the location confirmed at least once over two separate field seasons. The GPS coordinates were converted to digital coordinates, then converted to radians before using the spherical law of cosine to calculate the distance between each pair of trees:
 |
2.1 |
(b). Genetic analysis
Genetic material (leaf or cambium) was sampled from each tree used in this study, and preserved in silica gel [34]. DNA was extracted using a modified hexadecyl trimethyl ammonium bromide (CTAB) method [35] and eluted DNA was cleaned using spin columns (Sigma-Aldrich). Amplified fragment length polymorphisms (AFLP; [36]) were used to calculate Nei's genetic identity using Tools For Population Genetics Analysis (TFPGA, M. Miller) between each pair of trees in the study population. For the AFLPs, EcoR1 and Mse1 restriction enzymes and three selective primer combinations were used (ACA-CTC, ACG-CTC and AGC-CAT), producing 119 scorable loci. The AFLP profiles were visualized using an ABI Prism 3100 and analysed using Genotyper v. 2.0 software (Applied Biosystems). A 5 per cent error rate was used when analysing the AFLP bands to ensure differentiation between trees was not overestimated.
(c). Epiphyte community
The canopy bromeliad and orchid epiphyte community was surveyed on 53 B. alicastrum trees (electronic supplementary material, figure S1) during June–July 2008. The trees were accessed using ropes and harnesses, in order to get high into the canopy. Three branches per tree were chosen, generally the first branch (closest to the ground), the highest accessible branch and another in between these. This method does not restrict the branches to a specific elevation, but it does provide an overall survey for plants across the canopy. Further, branch size was not restricted to similar-sized branches and therefore branch surface area was calculated to control for these differences among trees, as larger branches are expected to host a greater number of epiphytes. To calculate branch surface area, each branch was measured in three sections (inner, middle and outer). The diameter and the length of each section were measured and used to calculate the surface area using a formula for a cylinder (inner and middle) and a cone (outer), ignoring the end surfaces. These measurements were added together for each tree and a matrix created from surface area difference between every pair of trees.
Each epiphyte individual was counted and identified to species where possible, and photographs were taken of the majority of sampled plants in order to confirm identification later. A subset of the epiphytic plants was sampled for genetic analysis and we used barcoding techniques to sequence the matK gene to confirm field identification; reference samples were obtained from B. Sayers at the National Botanical Gardens of Ireland.
Similarity indices were used to calculate the community structure similarity/distance between each pair of trees in Community Analysis Package 4 (CAP4, v. 4.1.3, Pisces Conservation Ltd., 2007). For presence/absence data the Rogers and Tanimoto (RT) similarity index (see [37]) was used:
| 2.2 |
where a, species present on both trees; d, species absent on both trees; b and c, present on only one tree. This index includes circumstances when an epiphyte species known to grow on another tree in the population is not found on either tree being compared (double absence). This is an improved index for comparisons over small geographical distances, whereas indices such as the Bray–Curtis index ignore double absences. There was no relationship between geographical distance and the number of double absences (Mantel test, r = −0.075, p = 0.10), indicating the absence of a species on two trees is informative rather than an artefact of variation owing to geographical variation; the scale of this study is very small and, therefore, variation owing to geographical location is reduced to a minimum. Further, we believe these trees have been studied sufficiently such that the majority of species will have been recorded and false positive rate is low. For the abundance data, mean character difference (MCD) or Czekanowski index (see [38]) was used:
| 2.3 |
where s1 and s2 are species abundances from tree 1 and tree 2. This measure also uses the absence of a species on both trees as information, as for the presence/absence RT index.
We used Mantel and partial Mantel tests to analyse the data statistically. Mantel tests use pairwise matrices to test the correlative relationship between two variables, and partial Mantel tests allow one or more other matrices to be kept constant in the analysis. Here, we analysed the effect of genetic distance between the trees on epiphyte community difference, while controlling for geographical distance and branch surface area. The RT similarity index produces results which range from 0 to 1; therefore by calculating ‘1 − RT’ we can compare this index with the MCD measure and genetic distance to give positive correlation results when significant.
(d). Invertebrate community
The invertebrate community was surveyed on and around 30 B. alicastrum trees (electronic supplementary material, figure S1) during July 2009. Tree number was reduced compared with the epiphyte work owing to time constraints in the field, tree size (large trees with buttress roots were excluded) and accessibility to the base of the tree. Tree size was measured (diameter at breast height; dbh) for every tree.
We used three different methods to collect invertebrates: (i) leaf litter collection, (ii) pitfall traps and (iii) trunk traps. The leaf litter was collected once from the base of each tree using an empty plastic tub to regulate the volume of leaf litter collected. The litter was then sifted through leaf by leaf to collect all invertebrates living within it. The invertebrates were preserved in 70 per cent ethanol for identification. Two pitfall traps were set up at the north and south sides of the tree base, using plastic pint cups and polystyrene plates as a cover. A small amount of water with a drop of washing up liquid was placed in the bottom of each cup to reduce error from escapees. The pitfall traps were emptied daily for 3 days and collected invertebrates were preserved in 70 per cent ethanol. Trunk traps were set on each tree at breast height by wrapping the trunk in one tight layer of black plastic; over the top of this, a slightly smaller width of black plastic was wrapped loosely around and the gaps were filled with twigs and leaves. After 3 days, the trunk traps and invertebrates within were collected. All invertebrates were collected, stored in 70 per cent ethanol and identified to morphospecies.
The Jaccard's (JA) similarity index was used to measure invertebrate community similarity between each pair of trees, using presence/absence data (see [37]):
| 2.4 |
where a, species present on both trees; b and c, present on only one tree. The JA index does not use ‘double absence’ information, when a species is absent from both trees. In this case, this is preferable, since sampling for these communities was not exhaustive [39]. Using double absence information would lead to increased false positive rates owing to the reduced sampling effort for invertebrates. We still assume geographical distance between the trees is small enough not to increase false-positive discovery rate. The JA index gives a range of results from 0 to 1, allowing ‘1 − JA’ to be used as a dissimilarity index rather than a similarity index. This means the results obtained are comparable to the epiphyte community analyses. Partial Mantel tests were used to analyse the association of genetic distance between trees and invertebrate community dissimilarity (1−JA), while controlling for geographical distance and tree-size difference. Mantel tests were used to assess the influence of geographical distance/genetic distance/tree size on the invertebrate communities.
3. Results
(a). Epiphyte community
We surveyed 2142 individuals of 46 orchid and 17 bromeliad species on the 53 B. alicastrum trees. Of the trees sampled, the mean genetic distance between trees from AFLP data was 0.316 (range 0.097–0.702). The average difference in branch surface area between trees was 3.8 m2 (smallest branch area was 0.2 m2 and the largest 22 m2; average branch area was 3.5 m2). The largest geographical distance between trees was 2118 m, smallest was 1 m. The most abundant epiphyte species in our sample was the orchid Christensonella uncata.
We found that as genetic distance between trees increased the epiphyte community difference between trees also increased, both for species presence/absence (partial Mantel test, ‘1 − RT’, r = 0.216, p = 0.025; table 1) and abundance data (partial Mantel test, MCD, r = 0.210, p = 0.035; figure 1). Geographical distance had a significant effect on both genetic distance (Mantel test, r = 0.116, p = 0.02) and community difference (Mantel test, MCD, r = 0.147, p = 0.009; figure 1); however, the correlation was weaker than between genetic distance and epiphyte community difference. Branch surface area difference between the trees had a strong effect on the epiphyte community difference (Mantel test, MCD, r = 0.514, p = 0.003; table 1) and species richness increased as branch surface area increased (Pearson's, r = 0.445, p = 0.0008).
Table 1.
Summary of results from Mantel and partial Mantel tests for the epiphyte community data (r = Pearsons correlation, calculated through mantel tests). Geo, geographical distance between trees; area, surface area difference between trees; genetic distance, Nei's genetic distance between trees; epiphyte community, community difference between trees. The first row, in bold, indicates the correlation between epiphyte community and genetic distance, with the appropriate matrices held constant in a partial Mantel test. In the first column, the matrices held constant in a partial mantel test are indicated in parentheses. The numbers in parentheses in the presence/absence and abundance columns indicate the p-value for the Mantel test, calculated using 9999 permutations.
| correlation (matrices held constant) | presence–absence | abundance |
|---|---|---|
| genetic distance to epiphyte community (geo + area) | r = 0.216 (0.025)* | r = 0.210 (0.035)* |
| genetic distance to epiphyte community | r = 0.222 (0.022)* | r = 0.206 (0.057)NS |
| genetic distance to geo | r = 0.116 (0.020)* | |
| eiphyte community to geo | r = 0.095 (0.040)* | r = 0.147 (0.009)** |
| epiphyte community to area | r = 0.275 (0.016)* | r = 0.514 (0.003)** |
NS > 0.05.
*p ≤0.05.
**p ≤0.01.
***p ≤0.001.
Figure 1.

The relationship between epiphyte community distance (abundance data) and (a) geographical distance, (b) genetic distance. Dots in grey show data for every pairwise combination among the 53 trees with the average for each tree shown as a black triangle.
(b). Invertebrate communities
We surveyed 1933 invertebrate individuals from 30 B. alicastrum trees from the leaf litter, trunk and pitfall samples. For these trees, the mean genetic distance from AFLP data was 0.304 (range 0.097–0.702), the largest tree dbh was 82.5 cm and smallest 11.5 cm (mean-size difference between trees was 20 cm) and the greatest geographical distance between two trees was 2170.8 m (the two closest trees were 1 m apart). The pitfall traps produced the greatest number of individuals at 1084 from 83 morphospecies, the leaf litter community consisted of 349 individuals from 55 morphospecies and the trunk traps contained 500 individuals from 43 morphospecies (electronic supplementary material, table 1). The main invertebrate taxa in our collections were spiders (Araneae), crickets (Orthoptera), beetles (Coleoptera) and ants (Hymenoptera: Formicidae).
Our results show variation in significance values and strength of effect of tree genetic variation across the different invertebrate communities (table 2). We found that the leaf litter invertebrate community was influenced by tree genetic distance, with more closely related trees having the most similar leaf litter communities (partial Mantel test, r = 0.221, p = 0.005; figure 2). Trunk invertebrate community dissimilarity was also significantly positively correlated with tree genetic distance, but less strongly than for the leaf litter data (partial Mantel test, r = 0.138, p = 0.05; figure 2). The pitfall invertebrate community was not influenced by genetic distance between trees (partial Mantel test, r = 0.072, p = 0.263). Geographical distance between the trees was held constant when analysing all datasets, as it significantly influenced the tree genetic distance (Mantel test, r = 0.233, p = 0.001). Geographical distance was not significantly associated with any of the invertebrate communities (table 2). Tree size was not significantly correlated with the community structure of any invertebrate community or tree genetic distance, and therefore was not controlled for in the main analyses.
Table 2.
Summary of results from Mantel and partial Mantel tests for the invertebrate data (r, Pearsons correlation calculated through Mantel tests). The rows in bold are the main correlations between invertebrate community and genetic distance. Geo, geographical distance between trees; tree size, dbh difference between trees. In the first column, the matrices held constant in a partial Mantel test are indicated in parentheses. In the second column, the numbers in parentheses indicate the p-value from the Mantel test, calculated from 9999 permutations.
| correlation (matrices held constant) | invertebrate community |
|---|---|
| genetic distance to geographical distance | r = 0.233 (0.001)*** |
| genetic distance to tree size | r = 0.147 (0.068)NS |
| leaf litter community to genetic distance (geo) | r = 0.221 (0.005)** |
| leaf litter community to geographical distance | r = 0.074 (0.108)NS |
| leaf litter community to tree size | r = 0.017 (0.402)NS |
| trunk community to genetic distance (geo) | r = 0.138 (0.050)* |
| trunk community to geographical distance | r = 0.025 (0.322)NS |
| trunk community to tree size | r = −0.006 (0.492)NS |
| pitfall community to genetic distance (geo) | r = 0.072 (0.263)NS |
| pitfall community to geographical distance | r = 0.068 (0.141)NS |
| pitfall community to tree size | r = −0.104 (0.117)NS |
NS > 0.05.
*p ≤0.05.
**p ≤0.01.
***p ≤0.001.
Figure 2.

Graphs showing the relationship between genetic distance and (a) leaf litter community dissimilarity (1 − JA), (b) trunk community dissimilarity (1 − JA), for every pair of trees (grey dots) and the average for each tree (black triangles).
4. Discussion
We demonstrated that B. alicastrum trees, which are genetically more similar, host more similar communities of epiphytic plants, leaf litter invertebrates and trunk dwelling invertebrates. Our work shows that genetic variation within a single tree species influences associated plant and animal communities, in a complex natural tropical forest ecosystem. This study significantly furthers our knowledge of community genetics concepts because it demonstrates that the extended phenotype phenomenon occurs not only in ecosystems dominated by a small number of tree species but also in a diverse tropical forest where over 300 tree species can be found [40]. We have shown that even in a complex environment, genes within a tree species are important for the dependant plant and animal communities. By using AFLP markers for this study, we were able to detect small genetic differences between these trees. Although AFLP markers are often considered neutral, we have shown that the differences in AFLP profiles among these trees are related to community differences in the interacting species. Therefore, it is probable that one or more of the loci are in linkage disequilibrium with a gene, or number of genes, which influence the communities. In systems where there is no linkage disequilibrium between markers and genes of effect, then relationships between genotype and associated communities might not be detected. By contrast, systems with high linkage disequilibrium (e.g. hybridizing systems) might show large and easily detectable associations following an apparent genetic similarity rule (sensu [22]).
We have shown that the epiphytic plant community on a tree is influenced by the individual genetic make-up of that tree. This indicates that there are genetically based traits within this tree species that determine which epiphyte species can grow on different host tree individuals. The possible mechanisms for epiphyte ‘host-preference’ are unlikely to be through active choice since most seeds are wind-dispersed and adult plants do not actively move. Host preference will most probably act through differential seedling survival on a tree during seed germination or plant growth. Such mechanisms might include the inhibition of seed germination by bark substrates [41] or a requirement for certain mycorrhizal fungal strains to be present on the tree bark, specifically for orchid seed germination [42,43]. For both bromeliad and orchid epiphyte species, early growth could be influenced by nutrient run-off from the tree and the presence of other flora and fauna on the tree host; for example, moss or lichen abundance [44].
We detected an effect of geographical distance on tree genetic distance, indicating that the trees located near to each other are more likely to be genetically similar. However, the effect of geographical distance on tree genetic distance was relatively small compared with the effect of genetic distance on the epiphyte community. As expected, we also found a small influence of geographical distance on epiphyte community difference [45]; however, this effect is again smaller than the effect of genetic distance on the epiphyte community. By controlling for geographical distance between each pair of trees in our analyses we have attempted to reduce any error associated with varying forest habitats, potential strong abiotic environmental differences and tree genetic population structure. Since our sample area was relatively small (approx. 4 km2), including geographical distance in the model was considered sufficient. We also, as expected, found a significant effect of tree branch area sampled, which simply means that the larger branches were host to more species and more individuals of epiphytes. This effect is due to tree age since older trees have had longer for epiphyte colonization [45].
For our invertebrate study we chose to use three different sampling techniques to investigate the invertebrate fauna associated with the tree: leaf litter collection, trunk traps and pitfall traps. Tree size (dbh) did not influence the results from any of our sampling methods. Tree genetic distance was significantly correlated with geographical distance, more so than for the larger sample of trees used in the epiphyte study. This shows a greater degree of population genetic structure for this subset of 30 B. alicastrum trees; however, we still consider the inclusion of geographical distance into the analyses to be sufficient to control for the effect.
We found that the community structure of invertebrates living within the leaf litter was relatively strongly associated with the tree genetic distance, the trunk invertebrate community was less associated, but still significantly so, but the pitfall samples were not. The pattern we see here may be due to the different species found in these communities; for example, the leaf litter community might be more sedentary than the pitfall community, which need to be moving in order to fall into the trap. Indeed, we found more Diptera, Hymenoptera, Coleoptera and Orthoptera in the pitfall samples than in the leaf litter samples, which supports the idea that these communities differ in the movement capabilities of their inhabitants. Pitfall traps are notoriously inefficient at sampling the entire faunal component of a region, but we do not consider this an important effect in this instance because our pitfall samples contained almost as many different morphospecies as the other two sampling techniques combined. The strong difference in the effect of tree genetic variation on the leaf litter and pitfall communities is therefore potentially a result of sedentary leaf litter invertebrates depending much more on the individual tree, and its direct surroundings (including living within its fallen leaves), than transient individuals that were opportunistically caught as they passed by the tree. The trunk community may consist of both more sedentary trunk dwelling species and those species moving up and down the trunk, and possibly also temporary visitors of winged species that may not be expected to be directly associated with a single tree species. This would explain the pattern detected of the trunk community being only moderately influenced by tree genetics (in between the leaf litter and pitfall results). Potential mechanisms for these effects could include food availability, tree or bark structure, presence of other animals and plants or phytochemical differences in leaves and leaf litter decomposition. Leaf litter invertebrates will depend more on the phytochemistry of the leaves which are falling around the tree and the subsequent decomposition of these, than will trunk invertebrates or transient species. It has been shown in other plant species that chemical composition of the leaves and soil chemical composition are related to plant genotype [25–27]. This may explain the stronger interaction seen, in our study, between the leaf litter invertebrates and tree genetics, than for the trunk or pitfall communities.
In complex ecosystems, the number of interactions experienced by one species is expected to be high and therefore the impact of each single interaction will be reduced. We determined that tree genotype explains approximately 4.6 per cent of the variation in epiphyte community structure, 4.8 per cent of the variation in the leaf litter invertebrate community structure and 3.7 per cent of the variation in the trunk invertebrate community. In such a complex ecosystem, with numerous interactions between many species, we consider this effect to be biologically significant. The detection of a significant effect within a naturally high diversity ecosystem would suggest that in a low diversity or experimental common garden system the variation explained would be much higher. These effects of tree genotype on epiphyte and invertebrate communities were also detectable even though a strong direct interaction is unlikely. Epiphytes are not parasitic and it is expected that most strong interactions with the tree will be indirect, although there may be a strong direct interaction at seed germination stage through bark substrates. Also, the invertebrate community was sampled by such methods that any species could potentially be trapped. Many previous community genetics studies have focused on directly interacting invertebrate communities, such as gall-inducing or leaf-folding arthropods [24], which are more likely to be strongly influenced by variation among individual tree hosts. This suggests that the effect of tree genotype, even in a complex system, is likely to be important for the many other associated species in this tropical ecosystem that interact more strongly with this tree species, such as parasitic plants and animals. Furthermore, species that depend on the epiphytic plants for shelter or the invertebrates for food may also be influenced indirectly by tree genetic variation through the epiphytes and invertebrates.
This work supports the idea of conserving a minimal viable interacting population (MVIP; [17]) as opposed to concentrating conservation efforts on minimal viable populations (MVP) of a species. The level of genetic variation required for maintaining a single tree species may be considerably lower than the level required to maintain the associated communities of plants and animals. Therefore, future conservation efforts or reintroductions of tree species should consider the associated communities when determining the level of genetic diversity to be conserved.
In conclusion, we have shown that genetic variation within a single tropical tree species can have extended phenotype effects on associated ecological communities in a complex and highly diverse natural ecosystem. This, in turn, is likely to influence the community structure of other species, such as amphibians, birds and mammals, and we suggest that whole ecosystem conservation may be possible through conserving genetic diversity at the primary producer level, even in complex ecosystems.
Acknowledgements
We would like to thank W. Etherington for canopy access help, B. Sayers for orchid identification training, R. Cowan for laboratory assistance and H. Eyland, B. Hurst, R. Robinson and R. Sweeney for invertebrate fieldwork help. We also thank R. Bangert and an anonymous reviewer for helpful comments. This work was supported by a NERC PhD studentship and CASE sponsor (Royal Botanic Gardens, Kew) to S.E.Z.
Footnotes
One contribution of 13 to a Theme Issue ‘Community genetics: at the crossroads of ecology and evolutionary genetics’.
References
- 1.Aarssen L. W., Turkington R. 1985. Biotic specialization between neighboring genotypes in Lolium perenne and Trifolium repens from a permanent pasture. J. Ecol. 73, 605–614 10.2307/2260497 (doi:10.2307/2260497) [DOI] [Google Scholar]
- 2.Kassen R., Rainey P. B. 2004. The ecology and genetics of microbial diversity. Annu. Rev. Microbiol. 58, 207–231 10.1146/annurev.micro.58.030603.123654 (doi:10.1146/annurev.micro.58.030603.123654) [DOI] [PubMed] [Google Scholar]
- 3.Proffitt E. C., Chiasson R. L., Owens A. B., Edwards K. R., Travis S. E. 2005. Spartina alterniflora genotype influences facilitation and suppression of high marsh species colonizing an early successional salt marsh. J. Ecol. 93, 404–416 10.1111/j.0022-0477.2005.00983.x (doi:10.1111/j.0022-0477.2005.00983.x) [DOI] [Google Scholar]
- 4.Service P. 1984. Genotypic interactions in an aphid–host plant relationship: Uroleucon rudbeckiae and Rudbeckia laciniata. Oecologia 61, 271–276 10.1007/BF00396772 (doi:10.1007/BF00396772) [DOI] [PubMed] [Google Scholar]
- 5.Tétard-Jones C., Kertesz M. A., Gallois P., Preziosi R. F. 2007. Genotype-by-genotype interactions modified by a third species in a plant–insect system. Am. Nat. 170, 492–499 10.1086/520115 (doi:10.1086/520115) [DOI] [PubMed] [Google Scholar]
- 6.Zytynska S. E., Fleming S., Tétard-Jones C., Kertesz M. A., Preziosi R. F. 2010. Community genetic interactions mediate indirect ecological effects between a parasitoid wasp and rhizobacteria. Ecology 91, 1563–1568 10.1890/09-2070.1 (doi:10.1890/09-2070.1) [DOI] [PubMed] [Google Scholar]
- 7.Carpenter S. R. 1996. Microcosm experiments have limited relevance for community and ecosystem ecology. Ecology 77, 677–680 10.2307/2265490 (doi:10.2307/2265490) [DOI] [Google Scholar]
- 8.Bangert R. K., Lonsdorf E. V., Wimp G. M., Shuster S. M., Fischer D., Schweitzer J. A., Allan G. J., Bailey J. K., Whitham T. G. 2008. Genetic structure of a foundation species: scaling community phenotypes from the individual to the region. Heredity 100, 121–131 10.1038/sj.hdy.6800914 (doi:10.1038/sj.hdy.6800914) [DOI] [PubMed] [Google Scholar]
- 9.Barbour R. C., Forster L. G., Baker S. C., Steane D. A., Potts B. M. 2009. Biodiversity consequences of genetic variation in bark characteristics within a foundation tree species. Conserv. Biol. 5, 1146–1155 10.1111/j.1523-1739.2009.01247.x (doi:10.1111/j.1523-1739.2009.01247.x) [DOI] [PubMed] [Google Scholar]
- 10.Dungey H. S., Potts B. M., Whitham T. G., Li H. F. 2000. Plant genetics affects arthropod community richness and composition: evidence from a synthetic eucalypt hybrid population. Evolution 54, 1938–1946 [DOI] [PubMed] [Google Scholar]
- 11.Floate K. D., Fernandes G. W., Nilsson J. A. 1996. Distinguishing intrapopulational categories of plants by their insect faunas: galls on rabbitbrush. Oecologia 105, 221–229 [DOI] [PubMed] [Google Scholar]
- 12.Fritz R. S., Price P. W. 1988. Genetic variation among plants and insect community structure: willows and sawflies. Ecology 69, 845–856 10.2307/1941034 (doi:10.2307/1941034) [DOI] [Google Scholar]
- 13.Hochwender C. G., Fritz R. S. 2004. Plant genetic differences influence herbivore community structure: evidence from a hybrid willow system. Oecologia 138, 547–557 10.1007/s00442-003-1472-4 (doi:10.1007/s00442-003-1472-4) [DOI] [PubMed] [Google Scholar]
- 14.Johnson M. T. J., Lajeunesse M. J., Agrawal A. A. 2006. Additive and interactive effects of plant genotypic diversity on arthropod communities and plant fitness. Ecol. Lett. 9, 24–34 [DOI] [PubMed] [Google Scholar]
- 15.Maddox G. D., Root R. B. 1990. Structure of the encounter between goldenrod (Solidago altissima) and its diverse insect fauna. Ecology 71, 2115–2124 10.2307/1938625 (doi:10.2307/1938625) [DOI] [Google Scholar]
- 16.Stiling P., Rossi A. M. 1996. Complex effects of genotype and environment on insect herbivores and their enemies. Ecology 77, 2212–2218 10.2307/2265714 (doi:10.2307/2265714) [DOI] [Google Scholar]
- 17.Whitham T. G., et al. 2003. Community and ecosystem genetics: a consequence of the extended phenotype. Ecology 84, 559–573 10.1890/0012-9658(2003)084[0559:CAEGAC]2.0.CO;2 (doi:10.1890/0012-9658(2003)084[0559:CAEGAC]2.0.CO;2) [DOI] [Google Scholar]
- 18.Iason G. R., Lennon J. J., Pakeman R. J., Thoss V., Beaton J. K., Sim D. A., Elston D. A. 2005. Does chemical composition of individual Scots pine trees determine the biodiversity of their associated ground vegetation? Ecol. Lett. 8, 364–369 10.1111/j.1461-0248.2005.00732.x (doi:10.1111/j.1461-0248.2005.00732.x) [DOI] [Google Scholar]
- 19.Gaylord E. S., Preszler R. W., Boecklen W. J. 1996. Interactions between host plants, endophytic fungi, and a phytophagous insect in an oak (Quercus grisea x Q. gambelii) hybrid zone. Oecologia 105, 336–342 10.1007/BF00328736 (doi:10.1007/BF00328736) [DOI] [PubMed] [Google Scholar]
- 20.Bailey J. K., Schweitzer J. A., Rehill B. J., Lindroth R. L., Martinsen G. D., Whitham T. G. 2004. Beavers as molecular geneticists: a genetic basis to the foraging of an ecosystem engineer. Ecology 85, 603–608 10.1890/03-3049 (doi:10.1890/03-3049) [DOI] [Google Scholar]
- 21.Muller M. S., McWilliams S. R., Podlesak D., Donaldson J. R., Bothwell H. M., Lindroth R. L. 2006. Tri-trophic effects of plant defenses: chickadees consume caterpillars based on host leaf chemistry. Oikos 114, 507–517 10.1111/j.2006.0030-1299.14668.x (doi:10.1111/j.2006.0030-1299.14668.x) [DOI] [Google Scholar]
- 22.Bangert R. K., et al. 2006. A genetic similarity rule determines arthropod community structure. Mol. Ecol. 15, 1379–1391 10.1111/j.1365-294X.2005.02749.x (doi:10.1111/j.1365-294X.2005.02749.x) [DOI] [PubMed] [Google Scholar]
- 23.Driebe E. M., Whitham T. G. 2000. Cottonwood hybridization affects tannin and nitrogen content of leaf litter and alters decomposition. Oecologia 123, 99–107 10.1007/s004420050994 (doi:10.1007/s004420050994) [DOI] [PubMed] [Google Scholar]
- 24.Whitham T. G., et al. 2006. A framework for community and ecosystem genetics: from genes to ecosystems. Nat. Rev. Genet. 7, 510–523 10.1038/nrg1877 (doi:10.1038/nrg1877) [DOI] [PubMed] [Google Scholar]
- 25.LeRoy C. J., Whitham T. G., Keim P., Marks J. C. 2006. Plant genes link forests and streams. Ecology 87, 255–261 10.1890/05-0159 (doi:10.1890/05-0159) [DOI] [PubMed] [Google Scholar]
- 26.Crutsinger G. M., Sanders N. J., Classen A. T. 2009. Comparing intra- and inter-specific effects on litter decomposition in an old-field ecosystem. Basic Appl. Ecol. 10, 535–543 10.1016/j.baae.2008.10.011 (doi:10.1016/j.baae.2008.10.011) [DOI] [Google Scholar]
- 27.Madritch M. D., Donaldson J. R., Lindroth R. L. 2006. Genetic identity of Populus tremuloides litter influences decomposition and nutrient release in a mixed forest stand. Ecosystems 9, 528–537 10.1007/s10021-006-0008-2 (doi:10.1007/s10021-006-0008-2) [DOI] [Google Scholar]
- 28.Lindroth R. L., Donaldson J. R., Stevens M. T., Gusse A. C. 2007. Browse quality in quaking aspen (Populus tremuloides): effects of genotype, nutrients, defoliation, and coppicing. J. Chem. Ecol. 33, 1049–1064 10.1007/s10886-007-9281-6 (doi:10.1007/s10886-007-9281-6) [DOI] [PubMed] [Google Scholar]
- 29.Madritch M. D., Greene S. L., Lindroth R. L. 2009. Genetic mosaics of ecosystem functioning across aspen-dominated landscapes. Oecologia 160, 119–127 10.1007/s00442-009-1283-3 (doi:10.1007/s00442-009-1283-3) [DOI] [PubMed] [Google Scholar]
- 30.Callaway R. M., Reinhart K. O., Moore G. W., Moore D. J., Pennings S. C. 2002. Epiphyte host preferences and host traits: mechanisms for species-specific interactions. Oecologia 132, 221–230 10.1007/s00442-002-0943-3 (doi:10.1007/s00442-002-0943-3) [DOI] [PubMed] [Google Scholar]
- 31.Laube S., Zotz G. 2006. Neither host-specific nor random: vascular epiphytes on three tree species in a Panamanian lowland forest. Ann. Bot. 97, 1103–1114 10.1093/aob/mcl067 (doi:10.1093/aob/mcl067) [DOI] [PMC free article] [PubMed] [Google Scholar]
- 32.Zimmerman J. K., Olmsted I. C. 1992. Host tree utilization by vascular epiphytes in a seasonally inundated forest (Tintal) in Mexico. Biotropica 24, 402–407 10.2307/2388610 (doi:10.2307/2388610) [DOI] [Google Scholar]
- 33.Rocas A. N. 2003. Brosimum alicastrum Sw. In Tropical tree seed manual: part II species descriptions, pp. 335–337 Washington, DC: USDA Forest Service [Google Scholar]
- 34.Chase M. W., Hills H. H. 1991. Silica gel: an ideal material for field preservation of leaf samples for DNA studies. Taxonomy 40, 215–220 10.2307/1222975 (doi:10.2307/1222975) [DOI] [Google Scholar]
- 35.Doyle J. J., Doyle J. L. 1987. A rapid DNA isolation procedure for small quantities of fresh leaf tissue. Phytochem. Bull. 19, 11–15 [Google Scholar]
- 36.Vos P., et al. 1995. AFLP: a new technique for DNA fingerprinting. Nucleic Acids Res. 23, 4407–4414 10.1093/nar/23.21.4407 (doi:10.1093/nar/23.21.4407) [DOI] [PMC free article] [PubMed] [Google Scholar]
- 37.Zuur A. F., Ieno E. N., Smith G. M. 2007. Analysing ecological data. New York, NY: Springer [Google Scholar]
- 38.Ramirez-Trejo M. R., Perez-Garcia B., Orozco-Segovia A. 2004. Analysis of fern spore banks from the soil of three vegetation types in the central region of Mexico. Am. J. Bot. 91, 682–688 10.3732/ajb.91.5.682 (doi:10.3732/ajb.91.5.682) [DOI] [PubMed] [Google Scholar]
- 39.Legendre P., Legendre L. 1998. Ecological resemblance. In Numerical ecology. Amsterdam, The Netherlands: Elsevier [Google Scholar]
- 40.Bridgewater S. G. M., et al. 2006. A preliminary checklist of the vascular plants of the Chiquibul Forest, Belize. Edin. J. Bot. 63, 269–321 10.1017/S0960428606000618 (doi:10.1017/S0960428606000618) [DOI] [Google Scholar]
- 41.Frei O. P., Dodson C. H. 1972. The chemical effect of certain bark substrates on the germination and early growth of epiphytic orchids. B. Torrey Bot. Club 99, 301–307 10.2307/2997072 (doi:10.2307/2997072) [DOI] [Google Scholar]
- 42.Arditti J. 1967. Factors affecting the germination of orchid seeds. Bot. Rev. 33, 1–97 10.1007/BF02858656 (doi:10.1007/BF02858656) [DOI] [Google Scholar]
- 43.Otero J., Ackerman J. D., Bayman P. 2002. Diversity and host specificity of endophytic Rhizoctonia-like fungi from tropical orchids. Am. J. Bot. 89, 1852–1858 10.3732/ajb.89.11.1852 (doi:10.3732/ajb.89.11.1852) [DOI] [PubMed] [Google Scholar]
- 44.Callaway R. M., Reinhart K. O., Tucker S. C., Pennings S. C. 2001. Effects of epiphytic lichens on host preference of the vascular epiphyte Tillandsia usneoides. Oikos 94, 433–441 10.1034/j.1600-0706.2001.940306.x (doi:10.1034/j.1600-0706.2001.940306.x) [DOI] [Google Scholar]
- 45.Zotz G., Vollrath B. 2003. The epiphyte vegetation of the palm Socratea exorrhiza—correlations with tree size, tree age and bryophyte cover. J. Trop. Ecol. 19, 81–90 10.1017/S0266467403003092 (doi:10.1017/S0266467403003092) [DOI] [Google Scholar]