Abstract
Theoretical studies of charge transport in deoxyribonucleic acid (DNA) and peptide nucleic acid (PNA) indicate that structure and dynamics modulate the charge transfer rates, and that different members of a structural ensemble support different charge transport mechanisms. Here, we review the influences of nucleobase geometry, electronic structure, solvent environment, and thermal conformational fluctuations on the charge transfer mechanism. We describe an emerging framework for understanding the diversity of charge transport mechanisms seen in nucleic acids.
Keywords: Charge Transfer Mechanism, Nucleic Acids, DNA, Peptide Nucleic Acid, Nucleic Acid Structure, Molecular Dynamics Simulations
1. Introduction
Understanding and controlling charge transfer (CT) in nucleic acids (NA) has far-reaching implications in biology and biotechnology [1, 2]. CT may influence protein-deoxyribonucleic acid (DNA) interactions in vivo [3] and certainly plays a central role in DNA damage and repair [4, 5]. The self-assembly properties of NAs can be used to build nanomechanical and potentially even nanoelectronic structures [6]. In addition, the CT properties of NAs can be exploited in biosensors and microarrays [7, 8].
Experimental and theoretical efforts of the last two decades indicate that electron/hole transport in DNA is mediated primarily by the stacked nucleobases [9–11]. Positive charges (holes) localize on the most easily oxidized guanine (G) bases, while negative charges (electrons) localize on the most easily reduced thymine (T) bases. Therefore, from the hole CT perspective, G:C(C represents cytosine) base pairs are hole traps while A:T stacks (A represents adenine) are barriers [4, 12]. For electron transport, A:T (G:C) base pairs are electron traps (barriers) [13]. In this review, we focus on NA hole transfer.
Many long-distance DNA CT experiments indicate weak distance dependence for the CT rate [1, 14–18]. NA CT at short distances shows an approximately exponential drop of rates with increasing donor-acceptor separation [19–21]. Electrical conductivity measurements also show a wide range of CT behavior in NAs [22], including the behavior characteristic of a conductor [23], a semiconductor [24, 25], or an insulator [26]. The source of this diversity of behavior remains a puzzle. Many DNA CT mechanisms have been proposed, including ballistic transfer [14], coherent single-step superexchange [27], incoherent multi-step hopping [28, 29], conformationally gated ballistic transfer [30], and polaronic transport [31, 32]. Transitions from superexchange to hopping in G-G hole transfer were predicted [33–36], and observed [21, 37], for donor-acceptor G pairs separated by A bridges. Most CT models assume hole tunneling over short distances and hopping over larger distances, typically above 3–4 base pairs, although the turnover distance depends on the energetics of the hole donor and acceptor [38]. Indeed, tunneling-hopping transitions are observed in conjugated polymers [39], and the crossover presumably arises when the propensity for carrier injection exceeds the tunneling probability. Seminal contributions of H. B. Gray and his group have recently shown that tunneling-hopping transitions can also be engineered into proteins [40], consistent with earlier indications of multi-step hopping pathways in proteins [41, 42]. Despite progress, attempts to establish quantitative descriptions of NA experimental data using superexchange and hopping models lead to significant contradictions and paradoxes. For example, fits of a detailed kinetic-quantum model of superexchange and thermally activated hopping [12] to experimental G to GGG charge transfer data of Giese [21] did reproduce the experimentally observed cross-over from exponential to soft distance dependence for the ratio of oxidative damage yields at G vs GGG (YGGG/YG). However, the experimentally observed soft distance dependence for YGGG/YG at large G to GGG separations could not be fit simultaneously with the relative values of experimental YGGG/YG measured at very short and very long G to GGG separations. Our studies show that CT in NAs is strongly coupled to non-equilibrium fluctuations that cause qualitative changes in hole localization. Explicit treatment of these fluctuations may resolve many of the paradoxes in NA CT.
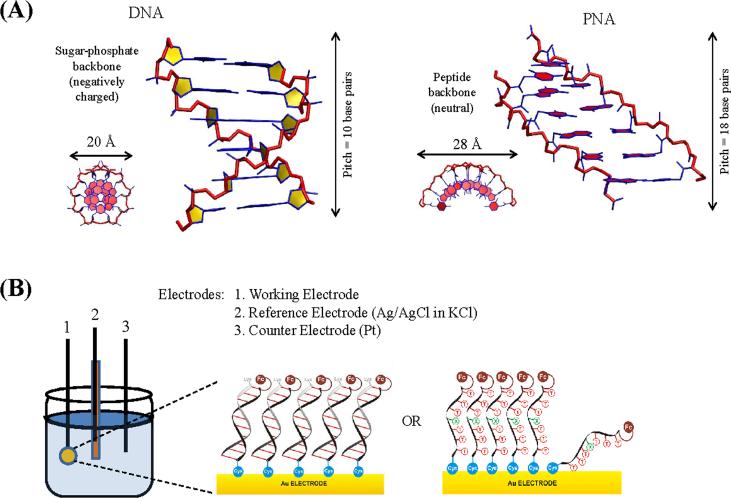
Like DNA, peptide nucleic acid (PNA) forms double stranded (ds) helices through Watson-Crick base-pairing [43–48]. The PNA duplex adopts a P-form geometry, (Figure 1A), whose achiral backbone can switch between right- and left-handed helical structures unless chemically locked [49]. PNA can also displace one strand in ds-DNA to form a high affinity PNA/DNA complex [50, 51]. Unlike DNA, the electrically neutral aminoethylglycine backbone allows PNA to form self-assembled monolayers (SAMs) (Figure 1B) with high surface coverage [52–55]. The PNA bases form a helical π stack similar to the one in DNA [45, 48, 56], suggesting that PNA may also support hole conduction. Indeed, recent experiments indicate that PNA CT is reminiscent of DNA CT [52–55]. The structural differences between PNA and DNA broaden the experimental and theoretical database for NA CT systems and provide a fresh perspective on CT mechanism. For example, PNA has a larger helical pitch and a smaller helical twist compared to DNA (Figure 1A), causing a larger π-overlap among neighboring bases.
Figure 1.
(A) Structures of DNA (idealized B-DNA constructed using model.it: http://hydra.icgeb.trieste.it/~kristian/dna/model_it.html) and PNA (X-ray structure [56], PDB ID 1PUP) with the sequence CGTACG. A side view and a top view are shown for each molecule. The quoted values of the helix diameter represent the diameter of the circular cross-section normal to the helix axis (B) Electrochemical setup for the ss- and ds-PNA charge transfer studies in references [52–55]. PNA monolayer cartoons have been adapted from references [53] and [54].
While DNA has been the subject of extensive theoretical investigations by several leading groups [10, 28, 29, 32, 38, 57–81], this review focuses on work in our group investigating CT mechanisms in both PNA and DNA. The influence of NA structure, NA conformational dynamics, and solvent on NA CT has been explored [53, 54, 61, 62, 82], and we describe our current perspective on how these various factors affect the mechanism and rate of NA CT. The general framework for analyzing charge transfer parameters described here could potentially be used to study NA systems, other than PNA and DNA, in which charge transfer is mediated by the nucleobases. Very recently, Maie et al. demonstrated ribose nucleic acid (RNA)-mediated charge transfer through U(Uracil)-A duplexes that exhibit a dual distance dependence for short and long NA bridge lengths, akin to PNA and DNA [83]. Other NA candidates include locked nucleic acid (LNA) [84], mixed DNA-PNA [51] or DNA-RNA [85] duplexes, and methylated PNA [49], although charge transfer through these NA has not yet been demonstrated.
2. Mechanisms of DNA CT
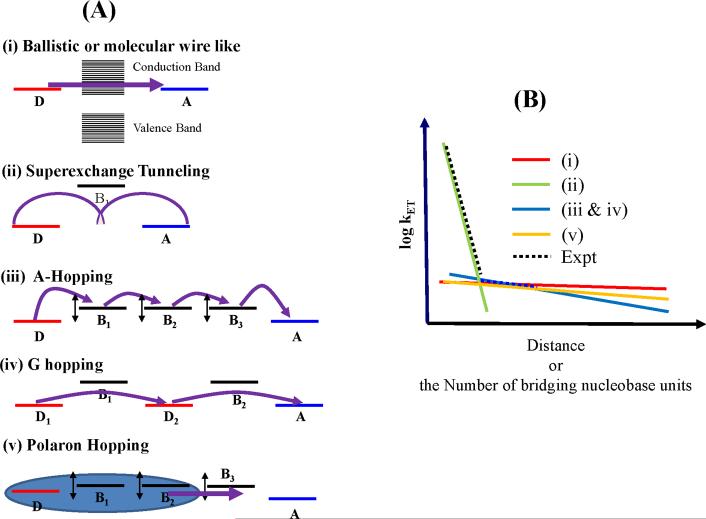
We now review some of the proposed CT mechanisms in NAs (see Figure 2A). We describe the earliest instances (to the best of our knowledge) where each mechanism was introduced for DNA along with experimental support for each mechanism. However, it is important to recognize that the significance of each specific mechanism is limited. Recent experiments [86, 87] and theoretical studies [53, 54, 61, 77, 82, 88, 89] show that NA structural flexibility and interactions with a dynamic solvent medium create significant modulation in NA electronic properties and CT mechanism. We show in this review (section 4), that a mixture of the mechanisms described below must be considered for any NA sequence.
Figure 2.
(A) Mechanisms of charge transfer in nucleic acids. (B) Distance dependence of charge transfer rates from various theoretical mechanisms and experiment (see references in the text).
2.1. Ballistic or wire-like charge transport with and without conformation gating
In the ballistic or wire-like CT mechanism [14], the stacked nucleobases create a delocalized -band through which injected charges can propagate. If the ballistic CT is conformationally gated [30, 90], then thermal fluctuations are required to establish the ballistic pathway. The ballistic mechanism was suggested by Barton and Turro [14] to rationalize observations of rapid (picoseconds timescale) photoinduced CT between rhodium and ruthenium metallo-complexes intercalated in a DNA stack. Friesner and coworkers suggested [33], using multilevel Redfield theory, that transport via a conduction band could thus be established in DNA. A conformationally-gated version of the ballistic transport model was proposed to account for multiple rates (5ps and 75 ps) of deazaguanine oxidation by ethidium bromide intercalated in DNA, measured using femtosecond transient absorption and fluorescence up-conversion spectroscopy. The longer 75 ps oxidation timescale was interpreted as the time required to form an ethidium bromide-DNA CT-active conformation [30].
2.2. Single-step superexchange
Superexchange CT [27, 91, 92] occurs when the donor/acceptor and bridge energies are separated by large energy gaps, so that the donor and acceptor states are well localized. Tunneling is assisted by D-A electronic mixing via the states of the intervening bridge. Superexchange CT in DNA finds support from theoretical calculations on short DNA sequences. Our early studies in the superexchange regime indicated that tunneling in DNA would be “protein-like”, with exponential decay constants ~ 1 Å−1. [27, 59, 93] Support for the superexchange mechanism comes from experiments that find exponential decay of the CT rate in short DNA sequences [19, 20].
2.3. Multistep A-hopping
In the A-hopping mechanism [28, 29] proposed for sequences with GC base pairs separated by AT base pairs, thermally-activated hole injection occurs from a donor G to a neighboring A nucleobase [28, 29]. Subsequently, the charge hops incoherently among A nucleobases to arrive at an acceptor G [28, 29]. The first charge transfer step from donor to bridge is rate limiting because it is endergonic. Once on the bridge, subsequent CT hops involve ΔG ~ 0 reactions among bases in contact. The A-hopping model predicts an approximately inverse relation between distance and CT rate. Experiments on DNA, PNA, and RNA fragments have found such an inverse relation between CT rate and distance for distances beyond ~3-5 AT base pair bridge in DNA, 4 AU base pair bridge in RNA, and 8 T nucleobase bridge in ss-PNA, and explained their data on the basis of hopping CT [37, 55, 83].
2.4.Multistep G hopping
In G-hopping [94, 95], a hole transits among G nucleobases, mediated by the intervening As. This model was used to rationalize the dramatic (orders of magnitude) increase in CT rates upon replacing AT base pairs with GCs for donor-acceptor pairs separated by an all-AT bridge [96]. The G–hopping model is also consistent with AFM and STM experiments on DNA fragments that find the resistance of DNA to decrease with an increase in the DNA G-content [97–99].
2.5.Variable-range hopping
Thermally-activated hopping among mixed localized and delocalized charge states is termed variable-range hopping [100, 101]. The extent of (de)localization of the charge across the sites is temperature-dependent [100, 101]. The probability of hopping between two sites is a product of an Arrhenius activation factor and a term that decays exponentially with increasing distance between the sites. The variable-range hopping model describes the experimentally observed [102] temperature dependence of conductance in λ-DNA [101]. This model also explains [100] the distance independence of CT yield through long AT bridges in G to GGG hole transfer experiments.
2.6.Phonon-assisted polaronic hopping
The hole and its polarization cloud is likely delocalized over several base pairs. Polarization arises due to electron density redistribution in the NA molecules themselves [31] and/or due to reorientation of the solvent molecules [32], with thermally activated polaronic motion. The polaron model was used to rationalize data from experiments [31], that show that the efficiency of radical cation migration through long (10–55 base pair) DNA sequences changes little with distance (independent of how frequently AT base pair runs are interrupted by GC pairs). It was proposed [31] that delocalization of charge over several bases causes “averaging” of the DNA structure, leading to strand-independent radical cation migration yields.
3. Distance dependence of the experimental CT rates and relation to CT mechanism
The numerous CT mechanisms predict different distance dependences (see Figure 2B) of the CT rate and the experimental distance dependence of CT rates is often used to support specific CT mechanisms [19, 21, 37, 55]. Experiments indicate that the CT rates in NAs often decrease rapidly with distance at short distances, and very weakly with distance at longer distances. The change in the rate of decrease occurs at 3–4 bridging AT bps in G to GGG hole transfer [21], 2 bridging AT bps for stilbene hole donor and acceptor [37], and 8 T bridging bases in ss-PNA meditating the CT between an electrode and the PNA-bound ferrocene [55]. The different superexchange to hopping cross-over bridge lengths seen in ss-PNA and ds-DNA are in accordance with a two-mechanism theory derived earlier [38], which predicts that two different mechanisms dominate NA CT at short and long distances and that the distance of transition from one mechanism to the other grows with the tunneling (or carrier injection) gap. While multiple mechanisms are needed to describe the transition from strong to weak distance dependence for the range of known experimental systems [33–36], a quantitative fit to experimental distance-dependent CT rates in NAs [21, 37, 55], even using combined mechanisms, is not available.
4.The effect of nucleobase structure, nucleobase conformational dynamics, and solvent on NA CT
The fit of a specific model to CT data depends on the choice of parameters, including the geometry and energetics of the donor, bridge and acceptor. Although early molecular dynamics and quantum chemical studies on oligo-peptides and proteins emphasized the effect of structural fluctuations on electronic coupling [103, 104], the computation of NA CT parameters was largely based upon idealized structures, until recently [10, 71–73], This approach has evolved over the last few years as atomistic simulations were adopted to sample NA geometries and to explore how fluctuations influence ensemble CT properties [53, 54, 57, 58, 69, 70, 74, 77–81, 89, 105, 106]. We highlight emerging views on NA-CT derived from such atomistic simulations coupled with electronic structure analysis.
4.1.Tunneling barriers for NA CT
Charge transfer may be adiabatic, nonadiabatic, gated, or relaxation limited [60, 107]. Nonadiabatic CT, which occurs for NA systems with well-separated (by one or more base pair) donor-acceptor traps is described by the high-temperature expression:
| (1) |
λ is the reorganization energy, Δ0 is the reaction free energy, kB is Boltzmann`s constant, T is the temperature and VDA is the electronic coupling between donor and acceptor which subsumes the description of the bridging medium for CT. The energy difference between the charge donor and bridge states (tunneling barrier) is a key parameter for NA CT and determines the extent to which activated (hopping or ballistic) CT mechanisms compete with superexchange tunneling CT. The most common approximation to the tunneling barrier height for hole transfer is the oxidation potential difference of the hole donor and the bridge. The barrier to tunneling (Δbarrier) is actually different from this redox gap. First, the medium polarization response to the extra charge on the bridge at equilibrium is different from that in the non-equilibrium virtual (superexchange) state. Second, thermal fluctuations of donor-bridge energies produce an ensemble of barrier heights. We examine these two issues below.
4.1.1.Bridge reorganization energy contributions to the tunneling barrier
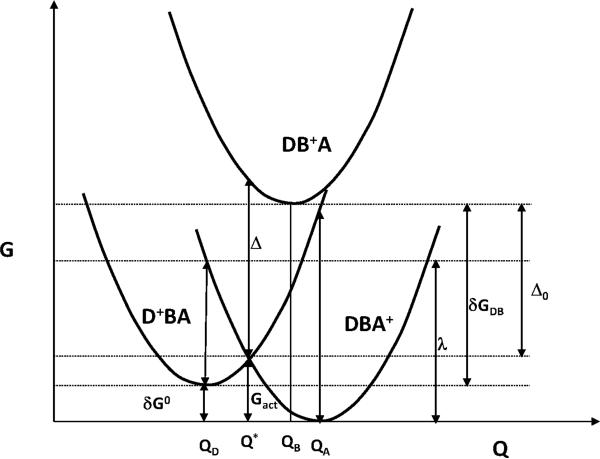
Figure 3 shows three Marcus free energy parabolas for hole donor (Gd), bridge (Gb), and acceptor (Ga) as a function of a generalized reaction coordinate.. The difference in oxidation potentials (expressed in eV) between donor and bridge states is the difference in the minimum energies of the hole states on the donor and bridge: Δdb(Ox) = Gd(Qd) – Gb(Qb). However, the tunneling barrier should be calculated at Q*, the value of the reaction coordinate where hole transfer occurs. Additionally, the minimum of the Gb curve need not occur at Q*. From geometric arguments, the averaged tunneling barrier (Figure 3) is
| (2) |
Here Λb = 0.5*kb(Q*-Qb)2 is the bridge reorganization energy for the hole to relax on the Gb surface after vertical excitation from the crossing point of Gd and Ga surfaces, and kb is the curvature of the Gb parabola. Thus, Δbarrier = Δdb(Ox) when.δg0 + Λb = Gact. If δG0 = 0 and curvatures of Gd and Ga parabola are equal: kd=ka (i.e donor and acceptor reorganization energies are equal: λd = λa = λ/2), then Gact = λ/4 and we find [53].
| (3) |
In reference 54, the measured CT rates across ss-PNA (TTTXTTT) SAMs correlate with the oxidation potential of the central nucleobase X (X=G,C,A or T). Eq. 3 was used within a superexchange model to estimate the value of the bridge reorganization energy b from fits to experimentally obtained electrochemical rates [53]. For oxidation potential values taken from the literature, a range of bridge reorganization energies Λ≈0–0.68 eV were found. Uncertainties in the estimate of Λb arose from: 1) uncertainties in the electrochemical rate data [53] and 2) uncertainties in nucleobase oxidation potentials [108, 109]. Using electrochemical data for nucleobase oxidation potentials from Seidel et al. [108] to fit the rate data [53] gave Λb 0–0.26 eV, while using the electrochemical data for nucleobase oxidation potentials reported by Boussicault and Robert [109] to fit the rate data [53] gave Λb 0.31–0.68 eV. The upper limit of 0.68 eV is comparable to the ferrocene donor-acceptor reorganization energy (λ~0.7 eV) and approximately doubles the tunneling barrier height estimated by oxidation potential differences between donor and bridge groups. Thus, bridge reorganization energy contributions can significantly increase the tunneling barrier heights.
Figure 3.
Marcus donor-bridge-acceptor parabolas for nonadiabatic hole transfer illustrate the profile of free energy G along the generalized CT reaction coordinate Q. The three parabolas do not have the same curvature (ka≠ ka≠ kb), in general.
4.1.2.Thermal fluctuations of electronic energy levels
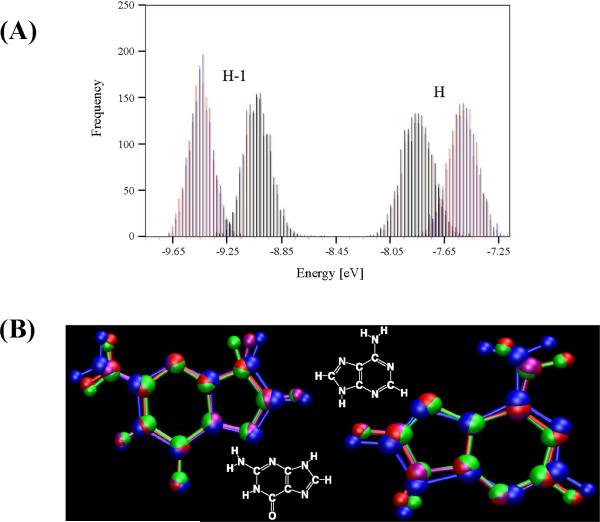
The tunneling energy gaps in D-B-A systems are proportional to the “vertical” differences in energies among the donor and bridge hole states. A Koopmans' theorem-like approximation [61, 70, 110] allows estimates of the hole state energy differences of nucleobases based on the difference in the highest occupied molecular orbital (HOMO) energies of the corresponding neutral systems. We analyzed the distribution of HOMO energies for G and A nucleobase geometries sampled in molecular dynamics (MD) simulations of single nucleobases [82] and from short DNA and PNA sequences (CATG) [61] in solution. The DNA simulations included counterions that balance the backbone charge to make the simulated systems neutral. In all of the simulations, the HOMO energy distribution for both G and A are nearly Gaussian, with standard deviation of ~0.1 eV (Figure 4A). The difference in HOMO energies of ~0.25 eV between isolated A and G bases extracted from the CATG sequence was slightly lower than that obtained from simulations of single nucleobases in solution (~0.33 eV). The widths of the G and A HOMO energy distributions (~0.1 eV) are comparable to the average HOMO energy separation between G and A nucleobases (0.25–0.33 eV), suggesting that thermal fluctuations bring the energies into frequent resonance, producing structures with electronic orbital delocalization. Indeed, in our computations ~1% of structures are near degenerate with an energy gap ΔE(G-A) = EHOMO,G - EHOMO,A < 0.1 eV. We note that the electronic structure calculations above do not include the solvent. It is known [74, 77, 82, 111] that solvent effects can further broaden the nucleobase energy distributions to standard deviations of about 0.3–0.4 eV. The solvent effect is discussed in section 4.5 below. The combined effects of solvent and NA structural fluctuations allow for more instances of a vanishing tunneling energy gap than either effect would produce alone.
Figure 4.
(A) HOMO/HOMO-1 energy fluctuations from a classical MD+QM simulation (adapted from reference [61]). (B) Average G (left) and A (right) geometries from QM/MM (purple), QM/MM doublet cation (red), MM (green) and MM frozen-charge cation (blue) simulations (adapted from reference [82]).
The validity of using neutral structures with a Koopmans' framework may be limited because: (i) the geometry of the doublet cations (DC) G•+ and A•+ is approximated by the geometry of the neutral nucleobases and (ii) the interactions of the DC with the surrounding solvent is assumed to be the same as for the neutral nucleobase. The second assumption is particularly troubling, since charge polarizes the solvent. We discuss the validity of assumption (ii) in section 4.5. The validity of assumption (i) was tested in combined quantum mechanics/molecular mechanics (QM/MM) simulations of neutral G and A, and of DCs G•+ and A•+ nucleobases [82]. The nucleobases were treated quantum mechanically, while the solvent was treated classically. The results show (Figure 4B) that oxidation does not significantly change the average nucleobase geometries. However, the structural fluctuations around the average geometries do change upon oxidation. The root mean square deviation (RMSD) of the structure over 800 snapshots for the G base obtained from MM, QM/MM and QM/MM DC simulations are 0.16 Å, 0.13 Å and 0.03Å, respectively. Thus, the charged species show smaller geometrical fluctuations than do their neutral counterparts.
What implications do these results have for the hole tunneling energy gap? The average energy gap for the DC bases, is ESOMO,G – ESOMO,A = 0.33 eV (SOMO = singly occupied molecular orbital) and that derived from the Koopmans' theorem-like approximations for the neutral system is EHOMO,G – EHOMO,A = 0.25 eV. Notably, these numbers are in agreement, as are the standard deviations of the energy gap distribution (~0.1 eV in all cases). These results support approximation (i)
4.2. Effects of structural diversity on NA CT
Structural diversity arises from non-equilibrium fluctuations around an average. Atomistic MD simulations allow sampling this diversity in environments of experimental relevance [53, 61, 69, 70, 77, 78, 81, 89]. Next, we review how fluctuations in nucleobase geometries and more global fluctuations in the nucleobase helicoidal parameters create a structurally diverse ensemble to modulate NA-CT properties.
4.2.1. Changes in nucleobase geometry
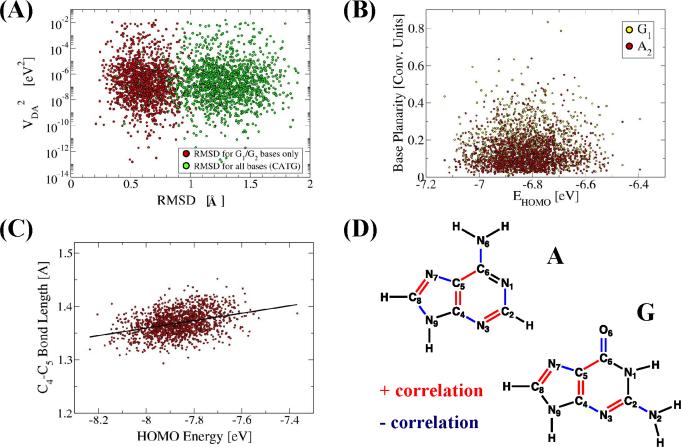
Subsection 4.1.2 examined the effect of thermal fluctuations on energy gaps. We now show that fluctuations in nucleobase energies correlate with fluctuations in nucleobase geometries. Figure 5 shows the correlation of nucleobase geometry metrics with the nucleobase HOMO energy [61]. The HOMO energies of the isolated bases showed no correlation with the “global” changes in the base structure. For example, neither the base planarity (as measured by the program mir [112]) nor the RMSD of the base structure from equilibrium correlate with the HOMO energy (Figures 5A and 5B). However, a substantial correlation is seen between the HOMO energies and the lengths of chemical bonds of the nucleobase (Figures 5C and 5D). Both G and A nucleobases showed a pattern (Figure 5D) of alternating chemical bond lengths, that correlated positively (red in Figure 5D) and negatively (blue in Figure 5D) with the HOMO energy. The bond fluctuations were uncorrelated with each other [61]. Presumably, bond fluctuations affect conjugations to modulate the HOMO energies. The HOMO energy fluctuations of the nucleobases that constitute the donor, acceptor, and bridge directly affect the CT rate and mechanism. For example, fluctuations of donor and bridge energy levels by ~0.1 eV, for donor bridge average energy separations of ~0.3 eV speed up the D-A tunneling rate by several orders of magnitude; a fluctuation that brings the donor and the bridge into resonance may result in charge injection into the bridge, launching a hopping CT process.
Figure 5.
Dependence of nucleobase electronic properties on geometry (adapted from Supplementary Information in reference [61]) (A) Donor-acceptor coupling VDA shows no correlation with the DNA structural fluctuations as measured by the RMSD of the DNA instantaneous structure from the highest-VDA structure. (B) HOMO energy of a nucleobase shows no correlation with the nucleobase planarity as measured by the program mir [112]. (C) HOMO energy of a nucleobase shows a weak correlation with specific C-C bond lengths, e.g., the Ade C4-C5 bond length shown here. (D) Nucleobase chemical bonds whose length vibrations correlate with the nucleobase HOMO energies.
The view that CT in DNA/PNA is gated by local conformational fluctuations complements simulations of Barnett et al. that predict an ion-gating mechanism for hole transport in a “frozen” DNA structure [76]. Voityuk and co-workers [88] showed that the oscillations of hydrogen atoms within the Watson-Crick hydrogen bonds significantly influence the electronic structure of the DNA base pairs. All of these factors: bond length fluctuations, hydrogen bonding fluctuations, and ionic motion, have similar magnitude effects on the D-B-A energy levels. Thus, an accurate description of electronic structure correlation with CT mechanism in NAs requires including all three effects discussed above. The effect of counterions is absent in PNA due to its neutral backbone.
4.2.2. Changes in helicoidal base step geometries
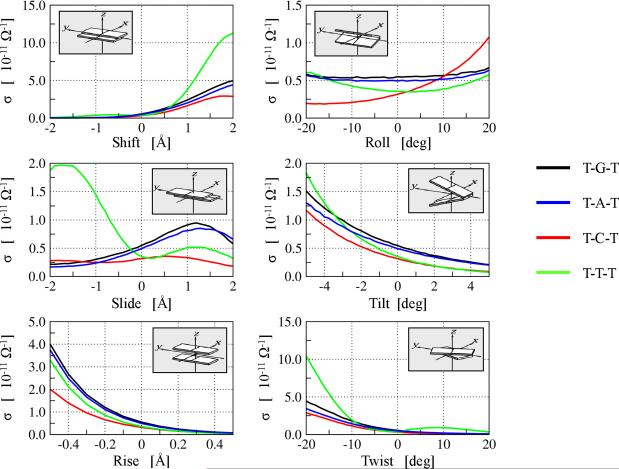
Nucleobase helicoidal parameters - shift, slide, rise, roll, tilt, and twist - modulate the distances among nucleobases as well as the base-base orbital overlap [113] (Figure 6). We have calculated the near zero bias conductance for the three ss-PNA base systems with the sequence T-X-T, where X=A,C,G, or T as a function of the nucleobase helicoidal parameters [53]. The near zero-bias conductance is known from theory to be related linearly to CT rates [114, 115]. We have scanned PNA nucleobase helicoidal step parameters and calculated the conductance for each snapshot. Figure 6 shows that the conductance is indeed sensitive to the helicoidal parameters with changes in rise, twist, and shift producing the largest changes in conductance. From basic theoretical considerations, CT in ss-PNA should depend on the energies of the individual nucleobases as well as on the coupling among nucleobases. Since the electronic energies of individual nucleobases are determined primarily by intra-base geometry (vide supra) and weakly sensitive to interbase separation, we conclude that changes in conductance with nucleobase helicoidal parameters arise from changes in nearest neighbor interbase couplings. Indeed, Troisi and co-workers reached similar conclusions from computational studies of DNA fragments [57].
Figure 6.
Variation of PNA conductance σ with the change in standard nucleobase step parameters [113]. The Slide, Shift, and Twist parameters affect the aromatic rings' overlap on adjacent nucleobases while the Rise parameter affects the plane-to-plane distance between the nucleobases. The Roll and Tilt parameters affect both the overlap and the interbase distance simultaneously. Figure adapted from Supplementary Information in reference [53].
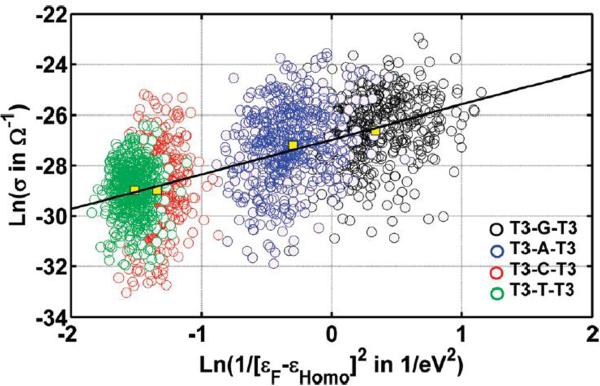
Conductance (or CT rate) sensitivity to nucleobase geometry is ensemble or time averaged in most experiments. Thus, correlating experimental CT rates with NA sequence or structural properties is a challenge [53]. Recent studies of four ss-PNA fragments (T-T-T-X-T-T-T; X=G, A, C or T), showed a correlation between measured charge transfer rates and the oxidation potential of base X. A superexchange model [91, 92] assuming fixed interbase couplings, with variable tunneling energy gaps set by X, provides a satisfactory description. However, theoretical analysis shows that conductances sampled from nucleobase geometry snapshots of the core T-XT structure, revealed a more involved microscopic picture. Figure 7 shows the calculated conductance (σ) versus the energy gap parameter DSF = 1/(εF − εm=HOMO)2 for each T-X-T system. A strong correlation is seen between the averages <σ> and <DSF> for the four systems (correlation coefficient of 0.95). Applying Koopmans' theorem, differences in the ensemble averaged HOMO energy of the four T-X-T systems are approximately equal to differences in oxidation potentials of the four X nucleobases (A,G,C and T). The simple linear correlation between <σ> and <DSF> thus indicates that the average coupling of X with its neighboring Ts is similar, independent of the identity of X, which explains the simple linear dependence of conductance on the energy gap in Figure 7. the considerable scatter in the conductance values for specific snapshots arises from molecular conformations with similar energy gaps, but different interbase couplings. Figure 7 shows a weak correlation between the calculated conductance and DSF for each specific T-X-T fragment. Thus, the nearest neighbor couplings vary considerably for each T-X-T system: σ is modulated more strongly by nearest neighbor coupling fluctuations than by orbital energy fluctuations. Indeed, averaged measurements mask the interplay between these two kinds of fluctuations. In a recent theoretical study, Voityuk proposed a model for DNA where averaging of the electronic coupling reduces the dependence of the CT rate on specific NA conformations that differ in their helicoidal parameters [68].
Figure 7.
Calculated conductance for four ss-PNA fragments T-X-T (X=A, C, G, T) vs. the inverse square of the energy gap: 1/(εF - εHOMO)2 (adapted from reference [53]). The data points are from an ensemble of 500 PNA structures generated for each PNA sequence by classical MD. Despite the absence of any correlation between the conductance and the tunneling barrier for each sequence, the averages correlate extremely well between the four sequences.
4.3. Diversity of donor-acceptor hole state localization
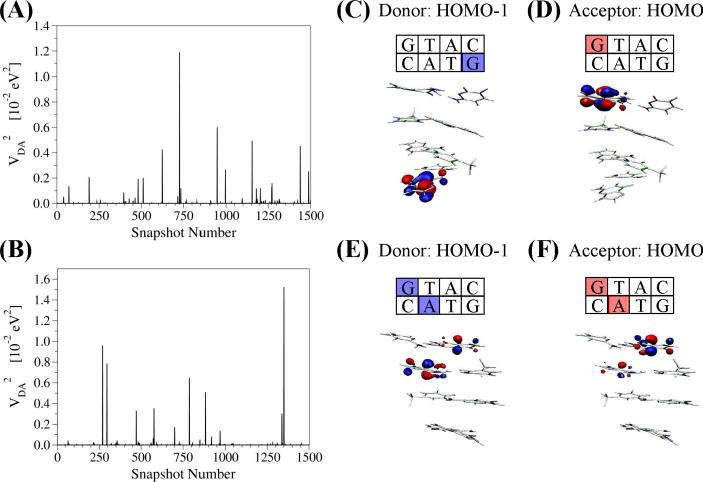
The structural variability of nucleobase energies and nearest neighbor base-base couplings causes large fluctuations in the donor and acceptor state localization. For instance, CT through the model DNA sequence GAAAGGG, is often used to study G to GGG CT [12, 38, 95]. Non-equilibrium NA conformations exist where the left terminal G and the neighboring As are momentarily isoenergetic and strongly coupled so that the hole state (donor) is delocalized [61]. In the application of the generalized Mulliken-Hush (GMH) scheme to compute superexchange electronic couplings the donor, acceptor and bridge states are approximated by the HOMO, HOMO-1 and HOMO-2 of the sequence, respectively [70, 110]. Fluctuations in the squared electronic couplings computed for an MD trajectory are shown in Figure 8 for DNA and PNA. The values of <VDA2> were calculated to be ~4 × 10⁻⁵ eV2 in both cases. However, these averages were significantly influenced by several MD snapshots with VDA2 values several orders of magnitude larger than the average, up to ~1 × 10⁻² eV2. Excluding the single largest peak from the statistics changes the mean squared coupling by ~20% for both DNA and PNA. As we show below, the large values of the electronic coupling (several orders of magnitude larger than the mean squared values) arise from snapshots where the donor/acceptor states mix strongly with the bridge. In such cases, CT from G to GGG does not take place via superexchange and cannot be described within a GMH framework.
Figure 8.
Fluctuations of the hole donor-acceptor electronic coupling for (A) DNA and (B) PNA. (C, D) Snapshots with HOMO (hole donor) and HOMO-1 (hole acceptor) well-localized on the donor and acceptor G bases indicate superexchange CT mechanism. (E, F) Snapshots with HOMO and HOMO-1 delocalized between the donor (acceptor) G and the A bridge indicate hopping CT mechanism. The figure is adapted from reference [61].
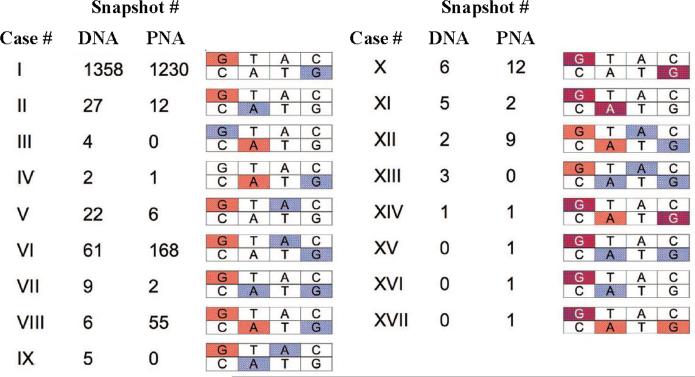
In order to explore the structural origins of the large coupling snapshot values, the highest lying molecular orbitals of the core segment (HOMO through HOMO-2) were analyzed. Figure 8 shows the spatial distribution of those orbitals for two DNA snapshots (the results are similar for PNA), for structures with typically small |VDA| values (Figure 8C and 8D), and for structures with the largest |VDA| values (Figure 8E and 8F). The structures with small |VDA| have HOMO density localized predominantly on one G, HOMO-1 density on the other G, and HOMO-2 density on one of the bridging As (not shown) in accordance with CT across a G(A)nG. framework. In contrast, the large |VDA| structures (Figure 8E and 8F) have a significant amount (≥10 %) of HOMO and HOMO-1 amplitude on the bridging bases. The bridging states come into resonance with the donor or acceptor, thereby violating the basic superexchange and GMH assumptions that the bridge is energetically separated from the donor and acceptor. Conversely, each occurrence of a HOMO/HOMO-1 with bridge delocalization resulted in a large GMH calculated |VDA| value. CT in these special structures with significant charge density on the bridge would not correspond to pure G-to-G superexchange; rather, the hole is delocalized onto the bridge, initiating CT via a hopping or resonant mechanism. As such, the electronic coupling between terminal Gs cannot be computed for these structures within a GMH framework. Figure 9 shows the HOMO and HOMO-1 computed for PNA and DNA. Overall, 17 localization patterns were found, and the frequency of occurrence is somewhat different for DNA versus PNA. In a few snapshots, HOMO & HOMO-1 were delocalized over three bases, spanning the entire NA sequence (e.g., cases XIV and XV in Figure 9). To summarize, the location of the donor, bridge and acceptor states are strongly dependent on the NA conformation and have to be determined, before specifying a CT mechanism.
Figure 9.
Distribution of the DNA and PNA MD structures of the CATG segment according to the HOMO and HOMO-1 localization. Color of a given nucleobase indicates significant amplitude of HOMO (red), HOMO-1 (blue) or both (purple) on that nucleobase. The amplitude of an orbital on a given base is considered to be significant if at least 10% of the charge density of that orbital is present on that base. The figure is adapted from reference [61].
4.4. How many bridge states mediate charge transfer?
In D-B-A calculations of CT through NAs, a single molecular orbital per base model is often used. Is this model sufficient? We have addressed this question by including the full electronic structure of the NA bridge (INDO/s level on nucleobases only) to calculate the tunneling conductance of four T-X-T (X=G, C, A or T) ss-PNA fragments [53].
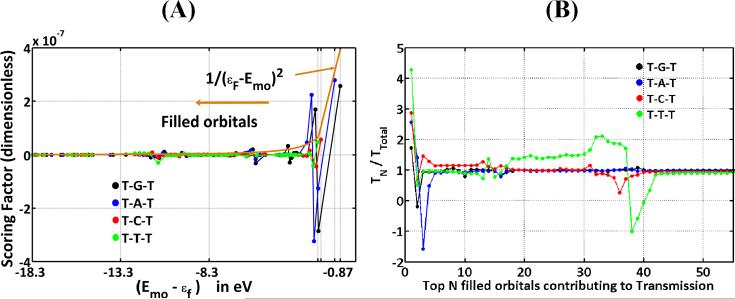
The coherent transmission T(εf) through a short ss-PNA fragment, at tunneling energy εf, was decomposed into a sum of contributions from each molecular orbital (MO): T(εf) = ΣiSFi(εf). The sum runs over all filled and empty MOs of the ss-PNA, and the scoring factor SFi(εf) gives the contribution of the ith MO to the transmission at energy εf [53]. Figure 10A shows the average contribution of filled and empty MOs to the conductance. For all four T-X-T systems, the highest-filled orbitals have the largest computed contribution to hole transfer, and the scoring factor drops rapidly as the MO energy gap to εF grows. However, the number of orbitals with significant contributions to the total transmission Ttot varies, depending on the identity of base X. By switching off contributions in the transmission expression from individual orbitals, MO contributions to the conductance were assessed (see Figure 10B). The top 3 (T-G-T), 5 (T-A-T), 38 (T-C-T), and 42 (T-T-T) filled orbitals are required for the sum to converge to 80% of the total conductance.
Figure 10.
(A) Contribution of the filled MOs to a T-X-T (X=G, A, C, T) ss-PNA segment conductance (adapted from reference [53]). (B) The ratio of the transmission TN through the top N filled MOs to the total transmission TTotal through all MOs, including the unfilled ones (adapted from Supplementary Information in reference [53]).
The dramatic difference in the number of orbitals that contributes to the conductance of T-X-T sequences with purine vs pyrimidine X, is rationalized on energetic grounds. A purine at X places the bridge HOMO ~ 1 eV closer to εF than would a pyrimidine at X (since the oxidation potential of purines is ~ 1eV lower than that of pyrimidines). This difference results in a smaller scoring factor for the pyrimidine HOMO than for the purine HOMO (Figure 10B). Since the contacts between the TXT bridge with the donor and acceptor induce a coupling, the scaling of the HOMO energy also affects other filled orbitals coupled to the HOMO. For purine-containing PNAs, the contribution from these few highest-filled orbitals dominates the conductance. However, for pyrimidine-containing systems, the relative contribution of the highest filled orbitals is weaker, and the relative contribution of the lower-lying orbitals is larger.
The number of bridge MOs mediating CT in the above T-X-T systems can be significantly larger than the number of bridging nucleobases, particularly when the nucleobases are the same (e.g. the T-T-T case, discussed above). The observation that a large number of bridging MOs is required to describe CT when the tunneling energy gap is large is particularly relevant for describing transport across isoenergetic bridging units, as in the case of systems with identical AT bridges [21, 37].
When one or more bridging MOs are resonant with the donor, relaxation effects need to be included in modeling the kinetics and mechanism. If bridge relaxation rates are much lower than the CT timescale, resonant MOs will dominate the transmission [116] and a single bridge orbital is sufficient to describe CT. On the other hand, if bridge relaxation rates are comparable to the CT timescale, hole relaxation on the bridge would lower the resonant CT rate and lower energy MOs could contribute to hole transport.
4.5. Participation of solvent in NA CT
Solvent can hydrogen bond with nucleobases, participate in proton coupled redox reactions, screen charges, localize charged states, and contribute to reorganization energies [1, 62, 76, 117–121]. Solvent reorganization is especially important when polaron transport [1] and charge delocalization [120, 122] mechanisms are operative. Modeling the structure and fluctuations of the solvent around a nucleobase is therefore of great relevance to NA-CT.
We have examined how water influences the structure and energetics of free G and A nucleobases in solution and modulates NA-CT.[82] Classical MD and mixed QM/MM simulations were used to model neutral G and A as well as DC G•+ and A•+ in solution. We compared the electronic structure and geometry of neutral and charged nucleobases in solution and evaluated the structure of the solvent needed for the HOMO/SOMO (the MOs most relevant to NA-CT) energies to converge. The orbital energies of G and A (and of G•+ and A•+) are shown in Figure 11 to depend on the radius of the water sphere. The energies do not converge until the radius exceeds 20 Å (30Å). Convergence is much slower for the SOMO energies of charged species (G•+ and A•+) than for the HOMO of neutral G and A. However, the energy gap between the A and G (and between G•+ and A•+) orbitals converges at a solvent radius of ~15Å, a radius much smaller than is required for convergence of the orbital energies.
Figure 11.
(A) HOMO energy of neutral G (blue) and A (red) vs. the radius of the surrounding water bath included in QM calculations on MD structures. The horizontal lines indicate the baseline HOMO energies for “dry” G (green) and A (orange). (B) SOMO energy of doublet cation G•+ (blue circles) and A•+ (red circles) vs. the radius of the surrounding water bath included in the QM calculations. All energy values are averaged over the last 100 snapshots of the MD run. The figure is adapted from reference [82].
The radius of the water shell also has a profound effect on the tunneling energy gap Edb between the donor G and bridging A for NA hole transfer. Including solvent and base structural fluctuations, as well as explicit water, lowers Edb from 0.33eV (MM G to A HOMOs with no water) to 0.2eV (MM or QM/MM G to A HOMOs with water). Interestingly, the energy gap between G and A (computed using the Koopmans' theorem-like approximation) differs from the gap calculated for the doublet cation radicals G•+ and A•+. The radical cation energy gap is smaller (~0.13 eV) when water is included as point charges in the electronic structure calculations. The radical cation energy gap decreases further to ~0.08 eV when the waters closest to the base are included explicitly in the electronic structure calculations (waters further away are treated as point charges). These calculations address approximation (ii) of section 3.1.3 associated with the Koopmans' theorem-like approximation for determining hole state energies with electronic structure calculations of the corresponding neutral systems. We conclude that, in order to obtain accurate energies, it is necessary to include the solvent not just in the MD simulations of charged DC species but also in the subsequent electronic structure analysis as well. Including water in the electronic structure calculations also increases the width of the HOMO (SOMO) energy distribution arising from solvent fluctuations, for both neutral and charged species, from ~0.1 eV to ~0.3 eV respectively (explicit and implicit descriptions of solvent give the same widths).
4.6. Role of NA structure in CT
Many early studies of CT in DNA were motivated by the stacked aromatic nucleobase structure [123]. The relevance of other aspects of NA structure (e.g., backbone, double helix, and ionic condensation) to CT, remain under intensive study. In this context, studies on DNA synthetic analogs, which retain some structural aspects of DNA while excluding others, present an exciting opportunity. Indeed, the neutral pseudo-peptidic backbone of PNA enables a stronger binding of the double helix relative to DNA while retaining the aromatic stacking and eliminating counterions. A larger π-overlap among neighboring bases is expected in PNA due to the larger helical pitch and a smaller helical twist compared to DNA (Figure 1A),
4.6.1. PNA vs DNA in solution
MD simulations of CATG sequences show PNA to be more flexible than DNA. This difference was attributed to the neutral backbone in PNA [61]. To assess the influence of PNA flexibility on CT rates [61], we divided the MD generated ensemble of structures into two classes: superexchange snapshots and hopping snapshots. CT for the superexchange snapshots occurs between the terminal Gs. These snapshots are characterized by well-localized (> 90% amplitude) HOMO/HOMO-1 on the terminal Gs (see Figure 8C and 8D). The hopping snapshots have charge delocalization (> 10% of HOMO/HOMO-1 amplitude) on the bridge (see Figures 8E, 8F and 9). The hopping snapshots have much larger donor-acceptor electronic couplings relative to the superexchange snapshots, since the hopping snapshots have a much shorter distance between the bridge localized states and the donor (see also subsection 3.2.3) compared to the G to G distance. In the case of superexchange snapshots, the calculated value of <VDA2> for PNA was ~3–4 times larger than for DNA. This difference in mean squared VDA values arises largely from the enhanced geometric overlap between the neighboring Gs and As (8.59 Å2 for PNA vs 0.65 Å2 for DNA based on simple geometric projection). The large spatial overlap of PNA nearest neighbor nucleobases arises from the smaller helical twist in PNA relative to DNA (Figure 1A). The difference in <VDA2> values produces hole superexchange rates in PNA that are likely to be several times larger than in DNA for fixed base pair separation distance, provided solvent reorganization energies are about the same. PNA is also expected to show larger hopping or resonant charge transfer rates than DNA. Structural snapshots with significant charge density on the bridge (Figure 8E and 8F) occurred more frequently in PNA than in DNA (~18% of the snapshots in PNA vs ~ 9% of the snapshots in DNA as shown in Figure 8A and 8B). We attribute this effect to the larger structural flexibility of PNA, which modulates the interbase couplings that enhance the frequency of bringing the bridge into resonance with the donor and acceptor states. In summary, CT rates in both hopping and superexchange regimes are expected to be larger in PNA than in DNA because of the greater structural flexibility of PNA and enhanced π-π overlap.
4.6.2. Rigid vs floppy ss-PNA
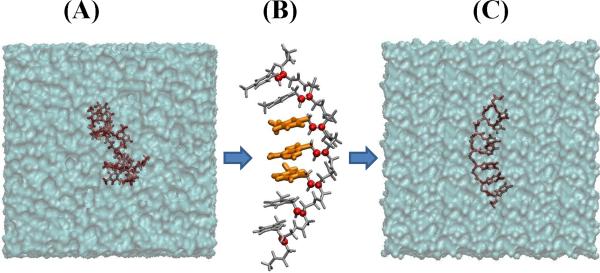
Evidence from MD simulations indicates that ss-PNA fragments have a propensity to collapse with loss of base stacking [53]. Simulations of seven nucleobase ssPNA fragments TTTXTTT (X=G, A, C or T), indicate that the flexible PNA backbone produces a variety of bent conformations, where the stacking of nucleobases is disrupted. Conductance values calculated for the central T-X-T fragment are small and do not correlate with the identity of the central base X. A second simulation on PNA constrained to near its initial well-stacked structure (extracted from PDB ID 1PUP [56]) freezes the global conformation of the PNA backbone to the 1PUP structure, while providing the nucleobases with rotational mobility around the unrestrained C7′–C8′ and C8′-N1/N9 bonds (Figure 12). In the constrained ss-PNA structures, the calculated conductance values of the T-X-T fragments are orders of magnitude larger than in the unconstrained case and correlate with experimental redox potentials of the central base pair, consistent with electrochemically measured kinetics. This trend indicates efficient tunneling mediated by the nucleobases [53]. For the surface coverage in electrochemical experiments, the molecules are expected to be “standing up” on the metal surface (Figure 1B) and it is conceivable that stacked nucleobases mediate CT. Extension of the theoretical analysis to floppier ss-PNA systems may come from experiments on ss-PNA SAMs with low PNA coverage [124].
Figure 12.
(A) Final structure of a ss-PNA T7 fragment obtained after a 1 ns unconstrained classical MD simulation. The simulation led to a significant amount of PNA “folding” and a loss of the helical conformation. (B) Harmonic restraints applied to certain atoms of the PNA backbone (red spheres) preserve the PNA helical conformation. (C) Final structure of the T7 PNA obtained after a 0.5 ns MD simulation employing the backbone restraints indicated in (B).
4.6.3. Interstrand and Intrastrand charge transport in ds-PNA
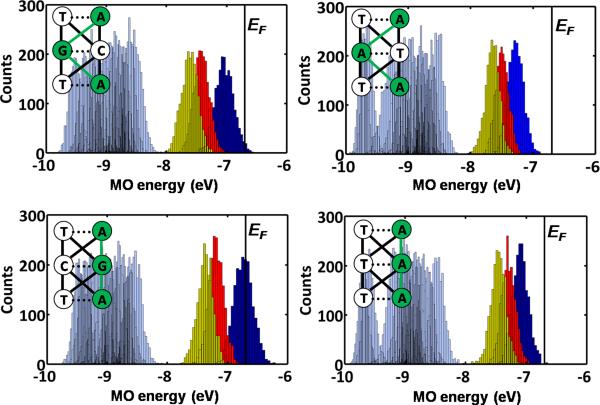
In double stranded NA systems, the nucleobases mediating CT can reside on the same strand (intrastrand CT) or both strands (interstrand CT). Experiments on short DNA demonstrate that interstrand coupling and CT are weaker than intrastrand coupling and CT [125]. Calculations on short ds-PNA TA-XY-TA (where XY=GC, CG, AT or TA) fragments were used to assess the nature of intrastrand and interstrand coupling. Electronic structure calculations were performed on ensembles of short double stranded PNA fragments generated by MD simulation. The computations suggest that, as with DNA, a penalty for interstrand crossing exists for PNA in solution compared to intrastrand transport. Figure 13 shows the computed energy distribution of filled MOs for an ensemble of ds PNA structures. The three highest lying MOs (blue, red and yellow distributions) are energetically well separated from the other MOs (gray distributions) for all systems. These top three orbitals, which are localized primarily on the purines, provide dominant channels for charge transport in these PNA systems. The three highest lying filled orbitals for systems with dominant interstrand pathways (Figure 13 top row) are energetically lower, on average, than the corresponding orbitals in systems with dominant intrastrand pathways (Figure 13 bottom row). This is the case since purines placed on the same strand have the highest filled orbitals with less delocalization on the pyrimidines (compared to the case of purines distributed over both strands). We have found that the strong intrastrand coupling among purines in TA-TA-TA or TA-CG-TA systems allows at most 1% (average 0.2%) or less of the HOMO amplitude to mix onto the T bases. In contrast, the weaker interstrand purine coupling in the TA-AT-TA or TA-GC-TA systems allows as much as 15% (average 1%) of the HOMO amplitude to mix onto the T bases. The lower energy of the HOMO for the TA-AT-TA or TA-GC-TA systems relative to the TA-TA-TA or TA-CG-TA systems thus arises from the larger contribution of the T bases in the former structure. The same trends, i.e. greater localization of the MO on the purines for intrastrand coupling relative to purines with interstrand coupling, are seen for the HOMO-1 and HOMO-2 orbitals.
Figure 13.
Distribution of MO energies for four TA-XY-TA systems (XY = GC, CG, AT, TA) generated by classical MD simulations for the top filled MOs. The top three MOs, shown in dark blue, red and yellow colors, are energetically well separated from the rest of the MO manifold (light blue). EF denotes the Fermi level. The insets show a schematic view of different CT pathways. The dominant pathway (green) involves the top three filled MOs that are mostly localized on the purine bases (green circles). The figure is adapted from reference [54].
Intrastrand nucleobase couplings were found experimentally [125] and computationally [126] to be stronger than interstrand couplings in DNA. The analysis in this section indicates that, as with DNA, intrastrand CT rates are expected to be larger than interstrand rates in PNA as well.
Furthermore, the smaller helical twist of PNA compared to DNA increases the intrastrand base-base overlaps and couplings. Thus, the contrast between inter- and intrastrand CT rates is predicted to be larger in PNA than in DNA.
5. Conclusions
Exploring NA-CT requires knowledge of donor to bridge energy gaps as well as donor-bridge, acceptor-bridge, and bridge-bridge electronic couplings. Our studies, which involve simulations of solvated NAs, establish a framework for evaluating these CT properties and their modulation by the environment. We have shown (subsections 4.1, 4.3, and 4.4) that the bridge participates in hole transfer to a greater extent than was previously appreciated. The average donor (G) to bridge (A) energy gaps found in our studies are on the scale of tenths of eV. Since this is comparable to the donor-bridge electronic coupling as well as thermal fluctuations of the donor and bridge hole state energies seen in our studies, there is significant flickering delocalization of donor charge onto the bridge. This theoretical observation has serious consequences when assigning CT mechanisms to NAs. Based on our simulations, mixed CT mechanisms (see section 2) co-exist in NAs. Quantitative interpretations of experimental distance dependent data of the type shown in Figure 2B require appropriate weighting of accessible mechanisms. We have shown (section 4.2.2) that average CT rates obtained from experiments can mask large variations in the CT interactions arising from structural dynamics even in the pure superexchange regime. We have described evidence (subsections 4.1.2 and 4.5) for the participation of solvent in the shifting and broadening the NA electronic structure. Finally we have described CT studies of PNA which are proving to be valuable for understanding structural effects in NA-CT processes in general.
Acknowledgements
We thank Prof. H. B. Gray for 30 years of invaluable interaction and collaboration. Support from NIH (GM048043) and NSF (CHE-1041040) is gratefully acknowledged. We thank Profs. C. Achim, E. Borguet, M. Madrid, and D. H. Waldeck for their collaboration on the PNA project. We also thank Profs R. J. Cave and A. A. Voityuk for very helpful discussions on the GMH calculations for nucleic acid structures. We thank J. R. Reimers for the CNDO computer code.
Footnotes
Publisher's Disclaimer: This is a PDF file of an unedited manuscript that has been accepted for publication. As a service to our customers we are providing this early version of the manuscript. The manuscript will undergo copyediting, typesetting, and review of the resulting proof before it is published in its final citable form. Please note that during the production process errors may be discovered which could affect the content, and all legal disclaimers that apply to the journal pertain.
References
- [1].Schuster GB, editor. Top. Curr. Chem. Vol. 236–237. Springer; Berlin: 2004. Long-Range Charge Transfer in DNA I and II. [Google Scholar]
- [2].Genereux JC, Boal AK, Barton JK. J. Am. Chem. Soc. 2010;132:891–905. doi: 10.1021/ja907669c. [DOI] [PMC free article] [PubMed] [Google Scholar]
- [3].Boon EM, Livingston AL, Chmiel NH, David SS, Barton JK. Proc. Natl. Acad. Sci. U. S. A. 2003;100:12543–12547. doi: 10.1073/pnas.2035257100. [DOI] [PMC free article] [PubMed] [Google Scholar]
- [4].Giese B. Bioorg. Med. Chem. 2006;14:6139–6143. doi: 10.1016/j.bmc.2006.05.067. [DOI] [PubMed] [Google Scholar]
- [5].O'Neill MA, Barton JK. In: Long-Range Charge Transfer in DNA. Schuster GB, editor. Springer; Berlin/Heidelberg: 2004. pp. 67–114. [Google Scholar]
- [6].Mirkin CA. MRS Bull. 2010;35:532–539. doi: 10.1557/mrs2010.602. [DOI] [PMC free article] [PubMed] [Google Scholar]
- [7].Drummond TG, Hill MG, Barton JK. Nat. Biotechnol. 2003;21:1192–1199. doi: 10.1038/nbt873. [DOI] [PubMed] [Google Scholar]
- [8].Sassolas A, Leca-Bouvier BD, Blum LJ. Chem. Rev. 2008;108:109–139. doi: 10.1021/cr0684467. [DOI] [PubMed] [Google Scholar]
- [9].Endres RG, Cox DL, Singh RRP. Rev. Mod. Phys. 2004;76:195–214. [Google Scholar]
- [10].Priyadarshy S, Risser SM, Beratan DN. J. Biol. Inorg. Chem. 1998;3:196–200. doi: 10.1016/s1074-5521(97)90230-1. [DOI] [PubMed] [Google Scholar]
- [11].Kelley SO, Boon EM, Barton JK, Jackson NM, Hill MG. Nucleic Acids Res. 1999;27:4830–4837. doi: 10.1093/nar/27.24.4830. [DOI] [PMC free article] [PubMed] [Google Scholar]
- [12].Bixon M, Jortner J. Chem. Phys. 2002;281:393–408. [Google Scholar]
- [13].Wagenknecht HA. Angew. Chem., Int. Ed. 2003;42:2454–2460. doi: 10.1002/anie.200301629. [DOI] [PubMed] [Google Scholar]
- [14].Murphy CJ, Arkin MR, Jenkins Y, Ghatlia ND, Bossmann SH, Turro NJ, Barton JK. Science. 1993;262:1025–1029. doi: 10.1126/science.7802858. [DOI] [PubMed] [Google Scholar]
- [15].Kelley SO, Jackson NM, Hill MG, Barton JK. Angew. Chem., Int. Ed. 1999;38:941–945. doi: 10.1002/(SICI)1521-3773(19990401)38:7<941::AID-ANIE941>3.0.CO;2-7. [DOI] [PubMed] [Google Scholar]
- [16].Shao FW, Barton JK. J. Am. Chem. Soc. 2007;129:14733–14738. doi: 10.1021/ja0752437. [DOI] [PubMed] [Google Scholar]
- [17].Joseph J, Schuster GB. Org. Lett. 2007;9:1843–1846. doi: 10.1021/ol070135a. [DOI] [PubMed] [Google Scholar]
- [18].Ly D, Sanii L, Schuster GB. J. Am. Chem. Soc. 1999;121:9400–9410. [Google Scholar]
- [19].Lewis FD, Wu TF, Zhang YF, Letsinger RL, Greenfield SR, Wasielewski MR. Science. 1997;277:673–676. doi: 10.1126/science.277.5326.673. [DOI] [PubMed] [Google Scholar]
- [20].Meggers E, Kusch D, Spichty M, Wille U, Giese B. Angew. Chem., Intl. Ed. 1998;37:460–462. doi: 10.1002/(SICI)1521-3773(19980302)37:4<460::AID-ANIE460>3.0.CO;2-U. [DOI] [PubMed] [Google Scholar]
- [21].Giese B, Amaudrut J, Kohler AK, Spormann M, Wessely S. Nature. 2001;412:318–320. doi: 10.1038/35085542. [DOI] [PubMed] [Google Scholar]
- [22].Porath D, Cuniberti G, Di Felice R. Long-Range Charge Transfer in DNA Ii. 2004;237:183–227. [Google Scholar]
- [23].Fink HW, Schonenberger C. Nature. 1999;398:407–410. doi: 10.1038/18855. [DOI] [PubMed] [Google Scholar]
- [24].Yoo KH, Ha DH, Lee JO, Park JW, Kim J, Kim JJ, Lee HY, Kawai T, Choi HY. Phys. Rev. Lett. 2001;8719 doi: 10.1103/PhysRevLett.87.198102. [DOI] [PubMed] [Google Scholar]
- [25].Porath D, Bezryadin A, de Vries S, Dekker C. Nature. 2000;403:635–638. doi: 10.1038/35001029. [DOI] [PubMed] [Google Scholar]
- [26].Storm AJ, van Noort J, de Vries S, Dekker C. Appl. Phys. Lett. 2001;79:3881–3883. [Google Scholar]
- [27].Priyadarshy S, Risser SM, Beratan DN. J. Phys. Chem. 1996;100:17678–17682. [Google Scholar]
- [28].Jortner J, Bixon M, Langenbacher T, Michel-Beyerle ME. Proc. Natl. Acad. Sci. U. S. A. 1998;95:12759–12765. doi: 10.1073/pnas.95.22.12759. [DOI] [PMC free article] [PubMed] [Google Scholar]
- [29].Jortner J, Bixon M, Langenbacher T, Michel-Beyerle ME. Biophys. J. 1999;76:A263–A263. [Google Scholar]
- [30].Wan CZ, Fiebig T, Kelley SO, Treadway CR, Barton JK, Zewail AH. Proc. Natl. Acad. Sci. U. S. A. 1999;96:6014–6019. doi: 10.1073/pnas.96.11.6014. [DOI] [PMC free article] [PubMed] [Google Scholar]
- [31].Henderson PT, Jones D, Hampikian G, Kan YZ, Schuster GB. Proc. Natl. Acad. Sci. U. S. A. 1999;96:8353–8358. doi: 10.1073/pnas.96.15.8353. [DOI] [PMC free article] [PubMed] [Google Scholar]
- [32].Conwell EM. Proc. Natl. Acad. Sci. U. S. A. 2005;102:8795–8799. doi: 10.1073/pnas.0501406102. [DOI] [PMC free article] [PubMed] [Google Scholar]
- [33].Felts AK, Pollard WT, Friesner RA. J. Phys. Chem. 1995;99:2929–2940. [Google Scholar]
- [34].Okada A, Chernyak V, Mukamel S. J. Phys. Chem. A. 1998;102:1241–1251. [Google Scholar]
- [35].Segal D, Nitzan A, Davis WB, Wasielewski MR, Ratner MA. J. Phys. Chem. B. 2000;104:3817–3829. [Google Scholar]
- [36].Grozema FC, Berlin YA, Siebbeles LDA. J. Am. Chem. Soc. 2000;122:10903–10909. [Google Scholar]
- [37].Lewis FD, Zhu HH, Daublain P, Fiebig T, Raytchev M, Wang Q, Shafirovich V. J. Am. Chem. Soc. 2006;128:791–800. doi: 10.1021/ja0540831. [DOI] [PubMed] [Google Scholar]
- [38].Berlin YA, Burin AL, Ratner MA. Chem. Phys. 2002;275:61–74. [Google Scholar]
- [39].Davis WB, Svec WA, Ratner MA, Wasielewski MR. Nature. 1998;396:60–63. [Google Scholar]
- [40].Shih C, Museth AK, Abrahamsson M, Blanco-Rodriguez AM, Di Bilio AJ, Sudhamsu J, Crane BR, Ronayne KL, Towrie M, Vlcek A, Richards JH, Winkler JR, Gray HB. Science. 2008;320:1760–1762. doi: 10.1126/science.1158241. [DOI] [PubMed] [Google Scholar]
- [41].Chang MCY, Yee CS, Nocera DG, Stubbe J. J. Am. Chem. Soc. 2004;126:16702–16703. doi: 10.1021/ja044124d. [DOI] [PubMed] [Google Scholar]
- [42].Stubbe J, Nocera DG, Yee CS, Chang MCY. Chem. Rev. 2003;103:2167–2201. doi: 10.1021/cr020421u. [DOI] [PubMed] [Google Scholar]
- [43].Egholm M, Buchardt O, Christensen L, Behrens C, Freier SM, Driver DA, Berg RH, Kim SK, Norden B, Nielsen PE. Nature. 1993;365:566–568. doi: 10.1038/365566a0. [DOI] [PubMed] [Google Scholar]
- [44].Nielsen PE. Peptide Nucleic Acids: Protocols and Applications. Horizon Bioscience; Wyndmondham: 2004. [Google Scholar]
- [45].Petersson B, Nielsen BB, Rasmussen H, Larsen IK, Gajhede M, Nielsen PE, Kastrup JS. J. Am. Chem. Soc. 2005;127:1424–1430. doi: 10.1021/ja0458726. [DOI] [PubMed] [Google Scholar]
- [46].Rasmussen H, Kastrup JS, Nielsen JN, Nielsen JM, Nielsen PE. Nat. Struct. Biol. 1997;4:98–101. doi: 10.1038/nsb0297-98. [DOI] [PubMed] [Google Scholar]
- [47].Rasmussen H, Liljefors T, Petersson B, Nielsen PE, Kastrum JS. J. Biomol. Struct. Dyn. 2004;21:495–502. doi: 10.1080/07391102.2004.10506943. [DOI] [PubMed] [Google Scholar]
- [48].He W, Hatcher E, Balaeff A, Beratan DN, Gil RR, Madrid M, Achim C. J. Am. Chem. Soc. 2008;130:13264–13273. doi: 10.1021/ja800652h. [DOI] [PubMed] [Google Scholar]
- [49].He W, Crawford MJ, Rapireddy S, Madrid M, Gil RR, Ly DH, Achim C. Mol. BioSyst. 2010;6:1619–1629. doi: 10.1039/c002254c. [DOI] [PubMed] [Google Scholar]
- [50].Lutz MJ, Benner SA, Hein S, Breipohl G, Uhlmann E. J. Am. Chem. Soc. 1997;119:3177–3178. [Google Scholar]
- [51].Uhlmann E. Biol. Chem. 1998;379:1045–1052. [PubMed] [Google Scholar]
- [52].Paul A, Watson RM, Lund P, Xing YJ, Burke K, He YF, Borguet E, Achim C, Waldeck DH. J. Phys. Chem. C. 2008;112:7233–7240. [Google Scholar]
- [53].Paul A, Bezer S, Venkatramani R, Kocsis L, Wierzbinski E, Balaeff A, Keinan S, Beratan DN, Achim C, Waldeck DH. J. Am. Chem. Soc. 2009;131:6498–6507. doi: 10.1021/ja9000163. [DOI] [PubMed] [Google Scholar]
- [54].Venkatramani R, Davis KL, Wierzbinski E, Bezer S, Balaeff A, Keinan S, Paul A, Kocsis L, Beratan DN, Achim C, Waldeck DH. J. Am. Chem. Soc. 2010 doi: 10.1021/ja107622m. In Press. [DOI] [PubMed] [Google Scholar]
- [55].Paul A, Watson RM, Wierzbinski E, Davis KL, Sha A, Achim C, Waldeck DH. J. Phys. Chem. B. 2009 doi: 10.1021/jp906910h. ASAP article. [DOI] [PubMed] [Google Scholar]
- [56].Rasmussen H, Kastrup JS, Nielsen JN, Nielsen JM, Nielsen PE. Nat. Struct. Biol. 1997;4:98–101. doi: 10.1038/nsb0297-98. [DOI] [PubMed] [Google Scholar]
- [57].Troisi A, Orlandi G. J. Phys. Chem. B. 2002;106:2093–2101. [Google Scholar]
- [58].Troisi A, Orlandi G. Chem. Phys. Lett. 2001;344:509–518. [Google Scholar]
- [59].Beratan DN, Priyadarshy S, Risser SM. Chem. Biol. 1997;4:3–8. doi: 10.1016/s1074-5521(97)90230-1. [DOI] [PubMed] [Google Scholar]
- [60].Berlin YA, Kurnikov IV, Beratan D, Ratner MA, Burin AL. Long-Range Charge Transfer in DNA Ii. Springer-Verlag Berlin; Berlin: 2004. pp. 1–36. [Google Scholar]
- [61].Hatcher E, Balaeff A, Keinan S, Venkatramani R, Beratan DN. J. Am. Chem. Soc. 2008;130:11752–11761. doi: 10.1021/ja802541e. [DOI] [PubMed] [Google Scholar]
- [62].Kurnikov IV, Tong GSM, Madrid M, Beratan DN. J. Phys. Chem. B. 2002;106:7–10. [Google Scholar]
- [63].Grozema FC, Tonzani S, Berlin YA, Schatz GC, Siebbeles LDA, Ratner MA. J. Am. Chem. Soc. 2009;131:14204–+. doi: 10.1021/ja906863k. [DOI] [PubMed] [Google Scholar]
- [64].Grozema FC, Tonzani S, Berlin YA, Schatz GC, Siebbeles LDA, Ratner MA. J. Am. Chem. Soc. 2008;130:5157–5166. doi: 10.1021/ja078162j. [DOI] [PubMed] [Google Scholar]
- [65].Senthilkumar K, Grozema FC, Guerra CF, Bickelhaupt FM, Lewis FD, Berlin YA, Ratner MA, Siebbeles LDA. J. Am. Chem. Soc. 2005;127:14894–14903. doi: 10.1021/ja054257e. [DOI] [PubMed] [Google Scholar]
- [66].Beljonne D, Pourtois G, Ratner MA, Bredas JL. J. Am. Chem. Soc. 2003;125:14510–14517. doi: 10.1021/ja035596f. [DOI] [PubMed] [Google Scholar]
- [67].Grozema FC, Siebbeles LDA, Berlin YA, Ratner MA. ChemPhysChem. 2002;3:536–+. doi: 10.1002/1439-7641(20020617)3:6<536::AID-CPHC536>3.0.CO;2-6. [DOI] [PubMed] [Google Scholar]
- [68].Voityuk AA. J. Phys. Chem. B. 2009;113:14365–14368. doi: 10.1021/jp908603w. [DOI] [PubMed] [Google Scholar]
- [69].Voityuk AA. J. Chem. Phys. 2008;128:115101. doi: 10.1063/1.2841421. [DOI] [PubMed] [Google Scholar]
- [70].Voityuk AA. Chem. Phys. Lett. 2007;439:162–165. [Google Scholar]
- [71].Voityuk AA, Jortner J, Bixon M, Rosch N. J. Chem. Phys. 2001;114:5614–5620. [Google Scholar]
- [72].Voityuk AA, Jortner J, Bixon M, Rosch N. Chem. Phys. Lett. 2000;324:430–434. [Google Scholar]
- [73].Voityuk AA, Rosch N, Bixon M, Jortner J. J. Phys. Chem. B. 2000;104:9740–9745. [Google Scholar]
- [74].Voityuk AA, Siriwong K, Rosch N. Angew. Chem. 2004;43:624–627. doi: 10.1002/anie.200352824. [DOI] [PubMed] [Google Scholar]
- [75].Jortner J, Bixon M, Voityuk AA, Rosch N. J. Phys. Chem. A. 2002;106:7599–7606. [Google Scholar]
- [76].Barnett RN, Cleveland CL, Joy A, Landman U, Schuster GB. Science. 2001;294:567–571. doi: 10.1126/science.1062864. [DOI] [PubMed] [Google Scholar]
- [77].Kubar T, Elstner M. J. Phys. Chem. B. 2008;112:8788–8798. doi: 10.1021/jp803661f. [DOI] [PubMed] [Google Scholar]
- [78].Kubar T, Elstner M. J. Phys. Chem. B. 2009;113:5653–5656. doi: 10.1021/jp901888r. [DOI] [PubMed] [Google Scholar]
- [79].Kubar T, Elstner M. J. Phys. Chem. B. 2010;114:11221–11240. doi: 10.1021/jp102814p. [DOI] [PubMed] [Google Scholar]
- [80].Kubar T, Kleinekathofer U, Elstner M. J. Phys. Chem. B. 2009;113:13107–13117. doi: 10.1021/jp9073587. [DOI] [PubMed] [Google Scholar]
- [81].Kubar T, Woiczikowski PB, Cuniberti G, Elstner M. J. Phys. Chem. B. 2008;112:7937–7947. doi: 10.1021/jp801486d. [DOI] [PubMed] [Google Scholar]
- [82].Keinan S, Venkatramani R, Balaeff A, Beratan DN. J. Phys. Chem. C. 2010. ASAP, DOI: 10.1021/jp104919g, Publication Date (Web): August 9, 2010.
- [83].Maie K, Miyagi K, Takada T, Nakamura M, Yamana K. J. Am. Chem. Soc. 2009;131:13188. doi: 10.1021/ja902647j. [DOI] [PubMed] [Google Scholar]
- [84].Wengel J, Koshkin A, Singh SK, Nielsen P, Meldgaard M, Rajwanshi VK, Kumar R, Skouv J, Nielsen CB, Jacobsen JP, Jacobsen N, Olsen CE. Nucleosides Nucleotides & Nucleic Acids. 1999;18:1365–1370. [Google Scholar]
- [85].Egli M, Usman N, Rich A. Biochemistry. 1993;32:3221–3237. [PubMed] [Google Scholar]
- [86].Lewis FD, Zhu H, Daublain P, Sigmund K, Fiebig T, Raytchev M, Wang Q, Shafirovich V. Photochem. Photobiol. Sci. 2008;7:534–539. doi: 10.1039/b719715b. [DOI] [PubMed] [Google Scholar]
- [87].Valis L, Wang Q, Raytchev M, Buchvarov I, Wagenknecht HA, Fiebig T. Proc. Natl. Acad. Sci. U. S. A. 2006;103:10192–10195. doi: 10.1073/pnas.0600957103. [DOI] [PMC free article] [PubMed] [Google Scholar]
- [88].Rak J, Makowska J, Voityuk AA. Chem. Phys. 2006;325:567–574. [Google Scholar]
- [89].Siriwong K, Voityuk AA. J. Phys. Chem. B. 2008;112:8181–8187. doi: 10.1021/jp802222e. [DOI] [PubMed] [Google Scholar]
- [90].Genereux JC, Barton JK. Chem. Rev. 2010;110:1642–1662. doi: 10.1021/cr900228f. [DOI] [PMC free article] [PubMed] [Google Scholar]
- [91].McConnell H. J. Chem. Phys. 1961;35:508–515. [Google Scholar]
- [92].Larsson S. J. Am. Chem. Soc. 1981;103:4034–4040. [Google Scholar]
- [93].Tong GSM, Kurnikov IV, Beratan DN. J. Phys. Chem. B. 2002;106:2381–2392. [Google Scholar]
- [94].Meggers E, Giese B. Nucleosides Nucleotides. 1999;18:1317–1318. [Google Scholar]
- [95].Giese B. Curr. Opin. Chem. Biol. 2002;6:612–618. doi: 10.1016/s1367-5931(02)00364-2. [DOI] [PubMed] [Google Scholar]
- [96].Meggers E, Michel-Beyerle ME, Giese B. J. Am. Chem. Soc. 1998;120:12950–12955. [Google Scholar]
- [97].Iqbal SM, Balasundaram G, Ghosh S, Bergstrom DE, Bashir R. Appl. Phys. Lett. 2005;86:153901. [Google Scholar]
- [98].Xu BQ, Zhang PM, Li XL, Tao NJ. Nano Lett. 2004;4:1105–1108. [Google Scholar]
- [99].Nogues C, Cohen SR, Daube S, Apter N, Naaman R. J. Phys. Chem. B. 2006;110:8910–8913. doi: 10.1021/jp060870o. [DOI] [PubMed] [Google Scholar]
- [100].Renger T, Marcus RA. J. Phys. Chem. A. 2003;107:8404–8419. [Google Scholar]
- [101].Yu ZG, Song XY. Phys. Rev. Lett. 2001;86:6018–6021. doi: 10.1103/PhysRevLett.86.6018. [DOI] [PubMed] [Google Scholar]
- [102].Tran P, Alavi B, Gruner G. Phys. Rev. Lett. 2000;85:1564–1567. doi: 10.1103/PhysRevLett.85.1564. [DOI] [PubMed] [Google Scholar]
- [103].Wolfgang J, Risser SM, Priyadarshy S, Beratan DN. J. Phys. Chem. B. 1997;101:2986–2991. [Google Scholar]
- [104].Daizadeh I, Medvedev ES, Stuchebrukhov AA. Proc. Natl. Acad. Sci. U. S. A. 1997;94:3703–3708. doi: 10.1073/pnas.94.8.3703. [DOI] [PMC free article] [PubMed] [Google Scholar]
- [105].Beratan DN, Skourtis SS, Balabin IA, Balaeff A, Keinan S, Venkatramani R, Xiao DQ. Acc. Chem. Res. 2009;42:1669–1678. doi: 10.1021/ar900123t. [DOI] [PMC free article] [PubMed] [Google Scholar]
- [106].Andrews DQ, Van Duyne RP, Ratner MA. Nano Lett. 2008;8:1120–1126. doi: 10.1021/nl073265l. [DOI] [PubMed] [Google Scholar]
- [107].Skourtis SS, Waldeck DH, Beratan DN. Annu. Rev. Phys. Chem. 2010;61:461–485. doi: 10.1146/annurev.physchem.012809.103436. [DOI] [PMC free article] [PubMed] [Google Scholar]
- [108].Seidel CAM, Schulz A, Sauer MHM. J. Phys. Chem. 1996;100:5541–5553. [Google Scholar]
- [109].Boussicault F, Robert M. Chem. Rev. 2008;108:2622–2645. doi: 10.1021/cr0680787. [DOI] [PubMed] [Google Scholar]
- [110].Voityuk AA. Chem. Phys. Lett. 2006;427:177–180. [Google Scholar]
- [111].Steinbrecher T, Koslowski T, Case DA. J. Phys. Chem. B. 2008;112:16935–16944. doi: 10.1021/jp8076134. [DOI] [PMC free article] [PubMed] [Google Scholar]
- [112].Zabrodsky H, Avnir D. J. Am. Chem. Soc. 1995;117:462–473. [Google Scholar]
- [113].Olson WK, Bansal M, Burley SK, Dickerson RE, Gerstein M, Harvey SC, Heinemann U, Lu XJ, Neidle S, Shakked Z, Sklenar H, Suzuki M, Tung CS, Westhof E, Wolberger C, Berman HM. (J. Mol. Biol).2001;313:229–237. doi: 10.1006/jmbi.2001.4987. [DOI] [PubMed] [Google Scholar]
- [114].Nitzan A. Isr. J. Chem. 2002;42:163–166. [Google Scholar]
- [115].Nitzan A. J. Phys. Chem. A. 2001;105:2677–2679. [Google Scholar]
- [116].Xing YJ, Park TH, Venkatramani R, Keinan S, Beratan DN, Therien MJ, Borguet E. J. Am. Chem. Soc. 2010;132:7946–7956. doi: 10.1021/ja909559m. [DOI] [PubMed] [Google Scholar]
- [117].LeBard DN, Lilichenko M, Matyushov DV, Berlin YA, Ratner MA. J. Phys. Chem. B. 2003;107:14509–14520. [Google Scholar]
- [118].Aidas K, Kongsted J, Sabin JR, Oddershede J, Mikkelsen KV, Sauer SPA. J. Phys. Chem. Lett. 2010;1:242–245. [Google Scholar]
- [119].Olsen JM, Aidas K, Mikkelsen KV, Kongsted J. J. Chem. Theory Comput. 2010;6:249–256. doi: 10.1021/ct900502s. [DOI] [PubMed] [Google Scholar]
- [120].Burin AL, Uskov DB. J. Chem. Phys. 2008;129:025101. doi: 10.1063/1.2953693. [DOI] [PubMed] [Google Scholar]
- [121].Weatherly SC, Yang IV, Armistead PA, Thorp HH. J. Phys. Chem. B. 2003;107:372–378. [Google Scholar]
- [122].Mantz YA, Gervasio FL, Laino T, Parrinello M. Phys. Rev. Lett. 2007;99:058104. doi: 10.1103/PhysRevLett.99.058104. [DOI] [PubMed] [Google Scholar]
- [123].Eley DD, Spivey DI. Transactions of the Faraday Society. 1962;58:411–415. [Google Scholar]
- [124].Venkatramani R, Xing YJ, Balaeff A, Keinan S, Borguet E, Beratan DN. 2010. (to be submitted)
- [125].Kelley SO, Barton JK. Science. 1999;283:375–381. doi: 10.1126/science.283.5400.375. [DOI] [PubMed] [Google Scholar]
- [126].Mehrez H, Anantram MP. Physical Review B. 2005;71:115405. [Google Scholar]


