Abstract
There is virtually no effective treatment for advanced hepatocellular carcinoma (HCC) and novel targets need to be identified to develop effective treatment. We recently documented that the oncogene Astrocyte elevated gene-1 (AEG-1) plays a seminal role in hepatocarcinogenesis. Employing yeast two-hybrid assay and co-immunoprecipitation followed by mass spectrometry we identified Staphylococcal nuclease domain containing 1 (SND1), a nuclease in the RNA-induced silencing complex (RISC) facilitating RNAi-mediated gene silencing, as an AEG-1 interacting protein. Co-immunoprecipitation and co-localization studies confirmed that AEG-1 is also a component of RISC and both AEG-1 and SND1 are required for optimum RISC activity facilitating siRNA and miRNA-mediated silencing of luciferase reporter gene. In 109 human HCC samples SND1 was overexpressed in ∼74% cases compared to normal liver. Correspondingly, significantly higher RISC activity was observed in human HCC cells compared to immortal normal hepatocytes. Increased RISC activity, conferred by AEG-1 or SND1, resulted in increased degradation of tumor suppressor mRNAs that are target of oncomiRs. Inhibition of enzymatic activity of SND1 significantly inhibited proliferation of human HCC cells. As a corollary, stable overexpression of SND1 augmented and siRNA-mediated inhibition of SND1 abrogated growth of human HCC cells in vitro and in vivo thus revealing a potential role of SND1 in hepatocarcinogenesis.
Conclusion
We unravel a novel mechanism that overexpression of AEG-1 and SND1 leading to increased RISC activity might contribute to hepatocarcinogenesis. Targeted inhibition of SND1 enzymatic activity might be developed as an effective therapy for HCC.
Keywords: AEG-1, SND1, protein-protein interaction, RNAi, hepatocarcinogenesis
Astrocyte elevated gene-1 (AEG-1), also known as metadherin (MTDH), lyric and 3D3, plays an important role in regulating carcinogenesis (1). Analysis of a large group of patient cohorts and cancer cell lines has established that AEG-1 is overexpressed in a diverse array of cancers, including HCC, and there is an inverse statistical correlation between AEG-1 expression level versus poor prognosis and reduced patient survival (1). In all of the cancer indications studied, overexpression of AEG-1 confers a highly aggressive, angiogenic and metastatic phenotype while siRNA inhibition reverses these phenotypes in nude mice xenograft models (1). AEG-1 activates multiple pro-tumorigenic signaling pathways, profoundly modulates global gene expression patterns that contribute to invasion, metastasis and chemoresistance and promotes transformation and angiogenesis (1-4). However, how exactly AEG-1 induces all these events still remains to be elucidated.
Staphylococcal nuclease domain containing 1 (SND1), also known as p100 co-activator or Tudor-SN, is a multifunctional protein modulating transcription, mRNA splicing, RNAi function and mRNA stability (5-10). In the cytoplasm, SND1 functions as a nuclease in the RNA-induced silencing complex (RISC) in which small RNAs (such as siRNAs or miRNAs) are complexed with ribonucleoproteins to ensue RNAi-mediated gene silencing (10). Little information is available on the role of SND1 in tumorigenesis. Antisense inhibition of SND1 in B lymphoblasts results in cell death indicating that SND1 is required for cell survival (11). Proteomic profiling identified high SND1 expression in metastatic breast cancer cells and also in tumor samples of metastatic breast cancer patients (12). A recent study shows that SND1 is one of the highly overrexpressed genes in human colon cancers, both in patient samples and in cell lines (13). Overexpression of SND1 in rat intestinal epithelial cells resulted in loss of contact inhibition and promoted cell proliferation (13). As yet, there are no reports of SND1 involvement in hepatocellular carcinoma (HCC).
In the present manuscript we identify SND1 as an AEG-1 interacting protein in RISC facilitating RISC activity. Inhibition of SND1 abrogates oncogenic functions of AEG-1 and SND1 expression itself is increased in human HCC. Overexpression and inhibition studies revealed the importance of SND1 in mediating hepatocarcinogenesis. These findings reveal a novel interplay between RISC components in promoting hepatocarcinogenesis.
Experimental procedures
Cell lines, culture condition, viability and clonogenic assays
HepG3, QGY-7703, Hep3B and Huh7 human HCC cells and human embryonic kidney 293 (HEK293) cells were cultured as described (2). Generation of Hep-AEG-1-14 clone, HepG3 cells stably expressing AEG-1, and Hep-pc-4, HepG3 cells stably transduced with empty pcDNA3.1 vector, has been described previously (2). HepG3 cells were transfected with control or AEG-1 siRNA expression plasmid and individual clones were selected for 2 weeks in 250 μg/ml hygromycin. QGY-7703 cells were transduced with a pool of three to five lentiviral vector plasmids, each encoding target-specific 19-25 nt (plus hairpin) SND1 shRNA (Santa Cruz Biotechnology) and were selected for 2 weeks in 1μg/ml puromycin. Hep3B cells were transfected with SND1-Myc-FLAG expression construct and the individual clones were selected in 800 μg/ml G418 for two weeks. Cell viability was determined by standard MTT assays as described (2). 3′, 5′-Deoxythymidine bisphosphate (pdTp) was used at a dose of 50, 100 and 200 μM (10). For colony formation assay, cells (500) were plated in 6-cm dishes and colonies > 50 cells were counted after 2 weeks.
Tissue microarray and immunostaining
Human HCC tissue microarrays were obtained from Imgenex Corp. Two tissue microarrays were used: one containing 40 primary HCC, 10 metastatic HCC and 9 normal adjacent liver samples (Imgenex; IMH-360), the other containing 46 primary HCC and 13 metastatic HCC (Imgenex; IMH-318). Immunostaining was performed using anti-SND1 antibody (rabbit polyclonal; 1:100; Prestige Antibodies® Powered by Atlas Antibodies from Sigma) that has been validated by immunohistochemistry against hundreds of normal and diseased tissues as described (2).
Co-immunoprecipitation and Western blot analyses
Cells were harvested in 1× cell lysis buffer (Cell signaling) containing protease and phosphatase inhibitor cocktails (Roche). Cell lysates were pre-cleared by incubation with protein A agarose for 1 h at 4°C. The agarose beads were removed by centrifugation and the supernatant was incubated with the primary antibody overnight at 4°C. The antigen-antibody conjugates were incubated with protein A agarose for 2 h at 4°C and washed four times with 1× cell lysis buffer. Agorse beads were suspended in 1× SDS-PAGE loading buffer, boiled and then subjected to Western blot analyses.
Nude mice xenograft studies
Subcutaneous xenografts were established in the flanks of athymic nude mice using 1×10⁶ different clones of HCC cells. Tumor volume was measured twice weekly with a caliper and calculated using the formula π/6 × larger diameter × (smaller diameter)2. All experiments were performed with at least 5 mice in each group and all the experiments were repeated 3 times.
Statistical analysis
Data were represented as the mean ± Standard Error of Mean (S.E.M) and analyzed for statistical significance using one-way analysis of variance (ANOVA) followed by Newman-Keuls test as a post hoc test. A P value of < 0.05 was considered as significant.
Results
AEG-1 interacts with SND1
To identify AEG-1 interacting proteins we first employed yeast two-hybrid (Y2H) screening. We used as baits the N-terminal (a.a. 1-57) and C-terminal (a.a. 68-582) regions of AEG-1 that precedes and follows the transmembrane domain, respectively, to separately screen a human liver cDNA library using the technology of Hybrigenics (http://www.hybrigenics-services.com). The C-terminal region showed autoactivator function thereby complicating the assay. However, using selective medium containing 20 mM of 3-aminotriazole (3-AT), the inhibitor of the reporter gene product, the assay could be optimized. Despite these efforts only five known proteins with moderate confidence in the interaction were identified (Table S1). One of these proteins was staphylococcal nuclease domain containing 1 (SND1).
The relatively modest result of the Y2H screening prompted us to employ alternative strategy of co-immunoprecipitation coupled with mass spectrometry. We have already established stable clones of HepG3 cells expressing HA-tagged AEG-1 (Hep-AEG-1-14) (2). Cell lysates from Hep-AEG-1-14 and Hep-pc-4 cells (control hygromycin-resistant clone of HepG3 cells) were subjected to immunoprecipitation using protein A agarose conjugated with anti-HA antibody (anti-HA agarose). The immunoprecipitates were eluted using HA peptide and were run in a SDS-PAGE gel (Fig. S1). The gel was stained with Coommassie blue and the stained bands, that were present only in Hep-AEG-1-14 immunoprecipitates but not in Hep-pc-4 immunoprecipitates, were cut and were subjected to LC-MS/MS analysis after in-gel trypsin digestion. A total of 182 potential AEG-1-interacting proteins were thus identified. However, the most represented proteins were AEG-1 and SND1 (#33 and #174 in Table S2, respectively).
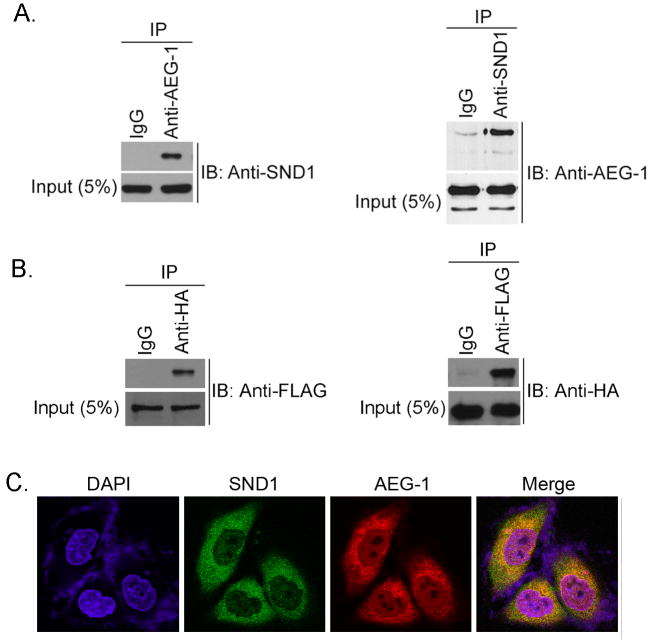
The interaction between SND1 and AEG-1 was confirmed by co-immunoprecipitation analysis using lysates from QGY-7703 human HCC cell that expresses abundant AEG-1 and SND1. Anti-SND1 antibody pulled down AEG-1 and vice versa demonstrating the interaction (Fig 1A). To confirm these findings, we transfected an HA-tagged AEG-1 expression construct and a FLAG-Myc-tagged SND1 expression construct into HEK-293 cells and performed co-immunoprecipitation analysis. Anti-HA antibody pulled down FLAG-tagged SND1 while anti-FLAG antibody pulled down HA-tagged AEG-1 thus documenting the interaction (Fig. 1B). To determine in which intracellular compartment AEG-1 and SND1 interact double immunofluorescence analysis was performed. QGY-7703 cells were stained with chicken anti-AEG-1 antibody and Alexa Fluor 546-conjugated anti-chicken secondary antibody and with rabbit anti-SND1 antibody and Alexa Fluor 488-conjugated anti-rabbit secondary antibody. The images were analyzed using a confocal Laser scanning microscope. The co-localization of AEG-1 and SND1 was determined by yellow staining in the merged image. AEG-1 and SND1 were detected predominantly in the cytoplasm although low-level of punctate staining for both was also detected in the nucleus (Fig. 1C and S2). However, the co-localization of AEG-1 and SND1 was observed only in the cytoplasm and not in the nucleus (Fig. 1C and S2). Cytoplasmic co-localization of AEG-1 and SND1 was also observed when human HCC sections were analyzed in a similar method (Fig. S3A). HEK-293 cells were transfected with AEG-1-HA and SND1-FLAG-Myc constructs and double immunofluorescence analysis using anti-HA and anti-FLAG antibodies also detected cytoplasmic co-localization of AEG-1 and SND1 (Fig. S3B).
Fig. 1.
AEG-1 interacts with SND1. A. Left panel, lysates from QGY-7703 cells were subjected to immunoprecipitation (IP) using normal rabbit serum (IgG) or rabbit anti-AEG-1 antibody and immunoblotting (IB) was performed with goat anti-SND1 antibody. Right panel, lysates from QGY-7703 cells were subjected to IP using normal mouse serum (IgG) or mouse anti-SND1 antibody and IB was performed with chicken anti-AEG-1 antibody. Five per cent of total cell lysate was used as input. B. HEK-293 cells were transfected with AEG-1-HA and SND1-Myc-FLAG constructs. Cell lysates were subjected to immunoprecipitation (IP) with anti-HA antibody and immunoblotting (IB) with anti-FLAG antibody (left panel) and vice versa (right panel). C. Double immunofluorescence analysis for AEG-1 and SND1 co-localization in QGY-7703 cells.
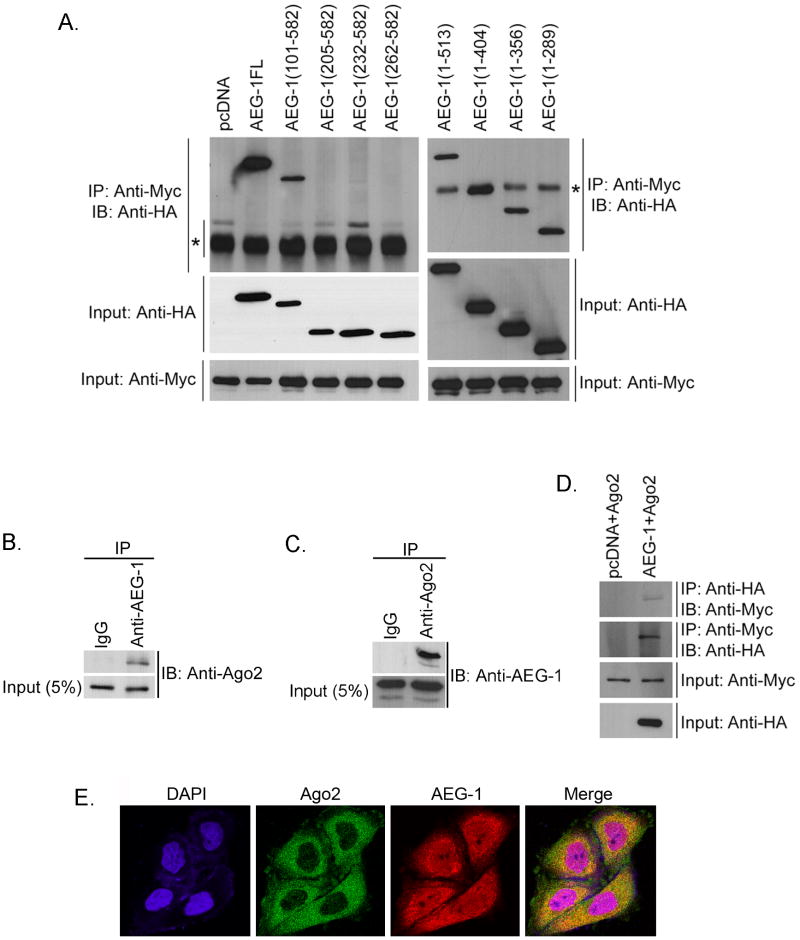
To check which region of AEG-1 interacts with SND1, HEK-293 cells were transfected with a series of N-terminal and C-terminal deletion mutants of AEG-1, all with HA-tag, and a FLAG-Myc-tagged SND1 expression construct (Fig. 2A) (14). Immunoprecipitation was performed with anti-Myc antibody and immunoblotting was performed with anti-HA antibody. SND1 interacted with all the C-terminal deletion mutants of AEG-1, the smallest containing a.a. 1-289 (Fig. 2A). Deletion of the first 101 a.a. residues of AEG-1 maintained AEG-1/SND1 interaction. However, deletion to a.a. 205 residues prevented the interaction (Fig. 2A). Thus a.a. 101-205 residues of AEG-1 interact with SND1.
Fig. 2.
AEG-1 is a component of RISC. A. HEK-293 cells were transfected with empty pcDNA3.1 vector or HA-tagged full length (FL) AEG-1 or its indicated deletion mutants along with SND1-Myc-FLAG expression construct. IP and IB were performed using rabbit anti-Myc antibody and chicken anti-HA antibody, respectively. Five per cent of total cell lysate was used for IB as input using anti-HA and anti-Myc antibodies. The asterisks indicate non-specific bands. The numbers in parentheses indicate amino acid numbers relative to full-length AEG-1 molecule. B. Cell lysates from QGY-7703 cells were subjected to immunoprecipitation (IP) using normal rabbit serum (IgG) or rabbit anti-AEG-1 antibody and immunoblotting (IB) was performed with mouse anti-Ago2 antibody. C. Cell lysates from QGY-7703 cells were subjected to IP using normal mouse serum (IgG) or mouse anti-Ago2 antibody and IB was performed with chicken anti-AEG-1 antibody. Five per cent of total cell lysate was used as input. D. HEK-293 cells were transfected with either empty pcDNA3.1 or AEG-1-HA expression construct along with Myc-Ago2 expression construct. IP and IB were performed with mouse anti-HA and rabbit anti-Myc antibody, respectively, and vice versa. Five per cent of total cell lysate was used for IB as input using anti-HA and anti-Myc antibodies. E. Double immunofluorescence analysis for AEG-1 and Ago2 co-localization in QGY-7703 cells.
AEG-1 is a component of the RNA-induced silencing complex (RISC)
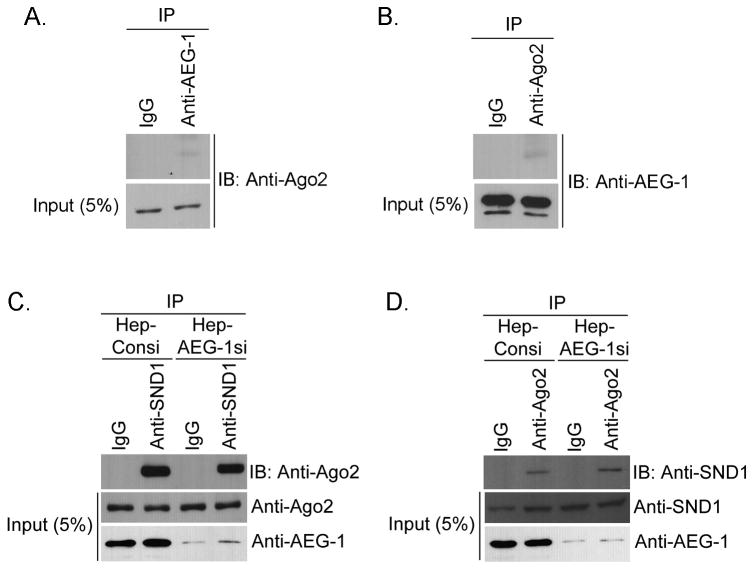
Cytoplasmic SND1 has been shown to function as the nuclease in RISC (10). To check whether AEG-1 is also a component of RISC, we analyzed interaction between AEG-1 and another major component of RISC, Ago2 (15), by co-immunoprecipitation analysis using lysates from QGY-7703 cells. Anti-AEG-1 antibody pulled down Ago2 and vice versa demonstrating the interaction (Fig 2B and 2C). To confirm these findings further, we transfected HEK-293 cells with a Myc-tagged Ago2 expression construct and with either an empty pcDNA3.1 vector or an HA-tagged AEG-1 expression construct. Immunoprecipitation with anti-HA antibody followed by immunoblotting with anti-Myc antibody detected a band representative of Ago2 only in AEG-1-transfected cells but not in pcDNA3.1-transfected cells (Fig. 2D). Similarly, immunoprecipitation with anti-Myc antibody followed by immunoblotting with anti-HA antibody detected a band representative of AEG-1 only in AEG-1-transfected cells but not in pcDNA3.1-transfected cells (Fig. 2D) thereby documenting that AEG-1 and Ago2 reside in the same complex. Double immunofluorescence studies demonstrated co-localization of Ago2 AND AEG-1 (Fig. 2E) as well as that of Ago2 and SND1 (Fig. S4). To check the potential contribution of these proteins in the formation of RISC, AEG-1 and Ago2 interaction was analyzed in QGY-SND1si-12 clone (QGY-7703 cells with stable knockdown of SND1). SND1 knockdown resulted in significant reduction in AEG-1 and Ago2 interaction as observed by co-immunoprecipitation analysis (Fig. 3A and 3B). Knocking down AEG-1 in HepG3 cells did not interfere with SND1 and Ago2 interaction (Fig. 3C and 3D) indicating that SND1 might be the key molecule in RISC formation.
Fig. 3.
A. Cell lysates from QGY-SND1si-12 cells were subjected to immunoprecipitation (IP) using normal rabbit serum (IgG) or rabbit anti-AEG-1 antibody and immunoblotting (IB) was performed with mouse anti-Ago2 antibody. B. Cell lysates from QGY-SND1si-12 cells were subjected to IP using normal mouse serum (IgG) or mouse anti-Ago2 antibody and IB was performed with chicken anti-AEG-1 antibody. C. Cell lysates from Hep-Consi and Hep-AEG1si cells were subjected to immunoprecipitation (IP) using normal rabbit serum (IgG) or rabbit anti-SND1 antibody and immunoblotting (IB) was performed with mouse anti-Ago2 antibody. D. Cell lysates from Hep-Consi and Hep-AEG1si cells were subjected to immunoprecipitation (IP) using normal mouse serum (IgG) or mouse anti-Ago2 antibody and immunoblotting (IB) was performed with rabbit anti-SND1 antibody. For A-D, five per cent of total cell lysate was used as input.
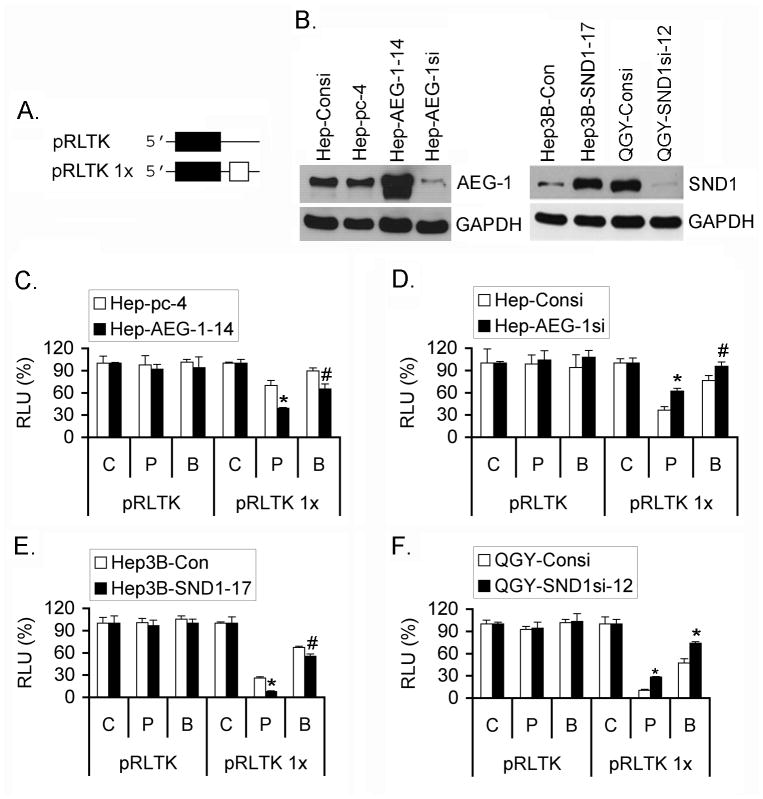
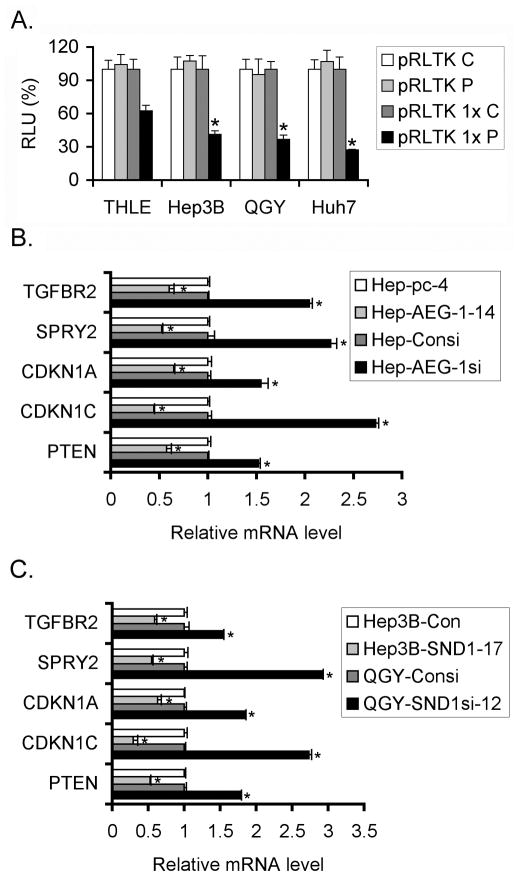
We next tested the impact of AEG-1 on RISC activity using a Renilla luciferase (Rluc) reporter gene bearing in its 3′ UTR one target of a microRNA (miRNA23) (Figure 4A and S5) as previously done to evidence the miRNA-dependent RISC activity in cell cultures (16). Plasmid pRLTK and pRLTK 1× (containing the miRNA23-target) were transfected into Hep-pc-4 and Hep-AEG-1-14 cells together with a plasmid expressing the Firefly luciferase gene (Fluc) for normalization. We used short duplex RNAs (sdRNAs) that have been demonstrated to work as miRNAs or siRNAs, depending upon their complementarity with the target. We tested both perfect (sdRNA P) and imperfect/bulged (sdRNA B) sdRNAs to mimic the siRNA or the miRNA pathways, respectively. In Hep-pc-4 and Hep-AEG-1-14 cells, when no target was present on the reporter gene (pRLTK) or when a non-specific sdRNA (sdRNA C) was used along with pRLTK 1×, no effect was observed (Figure 4C). In case of pRLTK 1×, a specific inhibition in Rluc activity (indicative of increased RISC activity) was observed in Hep-pc-4 cells with 10 nM sdRNA P (Fig. 4C). However this inhibition was significantly more pronounced in Hep-AEG-1-14 cells. The inhibition of Rluc activity was also observed for sdRNA B, although at a much lower efficiency than that of sdRNA P. There was a statistically significant increased inhibition of Rluc activity by sdRNA B in Hep-AEG-1-14 cells compared to Hep-pc-4 cells (Fig. 4C). These findings were confirmed using HepG3 cells stably expressing either control, scrambled siRNA (Hep-Consi) or AEG-1 siRNA (Hep-AEG-1si) (Fig. 4D). The RISC activity (inhibition of Rluc activity) was significantly less in Hep-AEG-1si cells compared to Hep-Consi cells for both sdRNA P and B, although the effect for sdRNA B was less pronounced compared to that for sdRNA P. Similar findings were observed using malignant glioma cells T98G stably expressing AEG-1 siRNA (Fig. S5). These findings demonstrate that as a component of RISC, AEG-1 contributes to its functional activity. We also document that Hep3B human HCC cells stably overexpressing SND1 demonstrate higher RISC activity compared to the control cells, while QGY-7703 cells stably expressing SND1 siRNA exhibits lower RISC activity compared to their control counterparts (Fig. 4E and 4F, respectively). The expression of AEG-1 and SND1 in the knockdown and overexpressing clones is shown in Fig. 4B.
Fig. 4.
AEG-1 and SND1 contribute to RISC activity. A. pRLTK is a Renilla luciferase (Rluc; black box) expression plasmid while pRLTK 1× is pRLTK containing a miRNA23 target sequence (white box) in the 3′-UTR of Rluc. B. Western blot analyses of the indicated proteins in the indicated cells. C-F. RISC activity measured in the indicated cells as described in the materials and methods. Rluc activity was normalized by Fluc activity. Data represent mean± SEM of three independent experiments. C: non-specific sdRNA C; P: sdRNA P with a perfect match; B: sdRNA B with imperfect/bulged match. THLE: THLE-3 cells that are normal immortal human hepatocytes.
Inhibition of enzymatic activity of SND1 by 3′, 5′-Deoxythymidine bisphosphate (pdTp) as well as knockdown of Ago2 by siRNA significantly inhibited RISC activity in QGY-7703 cells (Fig. S6). However, the effect of Ago2 siRNA was significantly more than that of pdTp in inhibiting RISC activity indicating that although SND1 contributes to optimum RISC activity, Ago2 is the more important nuclease in conferring RISC function.
Since AEG-1 expression is markedly higher in HCC compared to normal liver, we tested whether RISC activity is higher in human HCC cells compared to THLE-3 cells that are normal human hepatocytes immortalized by SV40 T/t Ag. Indeed, RISC activity was significantly lower in THLE-3 cells (38% decrease in RLuc activity) compared to Hep3B, QGY-7703 and Huh7 cells (59%, 63% and 73% decrease in RLuc activity), respectively (Fig. 5A). We hypothesized that increased RISC activity might contribute to hepatocarcinogenesis by augmenting oncomiR-mediated degradation of tumor suppressor mRNAs. Accordingly, we selected several mRNAs that are regulated by miRNAs overexpressed in HCC. These mRNAs include PTEN, target of miR-221 and miR-21; CDKN1C (p57), target of miR-221; CDKN1A (p21), target of miR-106b; SPRY2, target of miR-21 and TGFBR2, target of miR-93 (17, 18). Indeed, we observed that overexpression of AEG-1 or SND1 downregulates while knockdown of AEG-1 or SND1 upregulates all these mRNA levels in HCC cells thus supporting our hypothesis (Fig. 5B and 5C).
Fig. 5.
RISC activity is increased in human HCC cells. A. RISC activity was measured in the indicated cells. Rluc activity was normalized by Fluc activity. Data represent mean± SEM of three independent experiments. C: non-specific sdRNA C; P: sdRNA P with a perfect match. B and C. Analysis of expression of indicated mRNAs in the indicated cells by real-time PCR. Data represent mean± SEM. *: p<0.05.
SND1 inhibition abrogates AEG-1 function
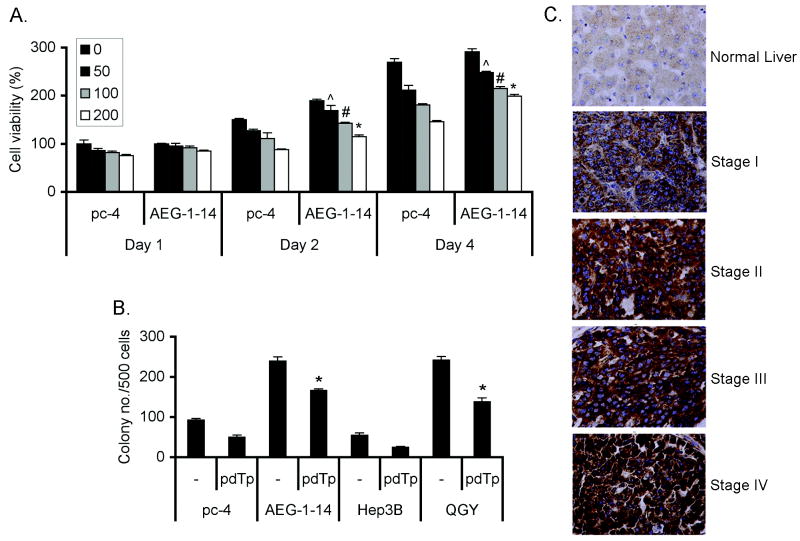
We next checked the importance of AEG-1/SND1 interaction, and therefore RISC activity, in mediating AEG-1 function by inhibiting enzymatic activity of SND1. 3′, 5′-Deoxythymidine bisphosphate (pdTp), a specific competitive inhibitor of staphylococcal nucleases, inhibits SND1 at 100 μM concentration (10). Hep-pc-4 and Hep-AEG-1-14 cells were treated with pdTp at 50, 100 and 200 μM concentrations and cell viability was measured by standard MTT assay. Both the cell lines showed significant growth inhibition upon pdTp treatment (Fig. 6A). However, Hep-pc-4 cells showed more sensitivity to pdTp compared to Hep-AEG-1-14 cells. On day 4, there was 46% and 32% reduction in cell viability in Hep-pc-4 and Hep-AEG-1-14 cells, respectively, upon treatment with 200 μM pdTp. The colony formation ability of Hep-pc-4, Hep-AEG-1-14, Hep3B and QGY-7703 cells were analyzed next. The expression level of both AEG-1 and SND1 is higher in QGY-7703 cells compared to Hep3B cells (Fig. 4B). The clonogenic activity was significantly inhibited by pdTp treatment by 46%, 30%, 55% and 43% in Hep-pc-4, Hep-AEG-1-14, Hep3B and QGY-7703 cells, respectively (Fig. 6B). These findings indicate that inhibition of RISC activity inhibits cell growth and overexpression of AEG-1 can partially protect from this effect. Transient transfection of SND1 siRNA also resulted in significant inhibition of anchorage-independent growth in soft agar in Hep-AEG-1-14 and QGY-7703 cells (Fig. S7). However, SND1 inhibition (either by pdTp or by siRNA) did not affect increased matrigel invasion activity conferred by AEG-1 (data not shown) indicating that SND1 primarily plays a role in regulating cell growth and proliferation.
Fig. 6.
Inhibition of SND1 enzymatic activity inhibits cell viability and AEG-1 function. A. Hep-pc-4 and Hep-AEG-1-14 cells were treated or not with 50, 100 and 200 μM pdTp for 1 to 4 days and cell viability was measured by standard MTT assay. B. Hep-pc-4, Hep-AEG-1-14, Hep3B and QGY-7703 cells were treated with 100 μM pdTp and colony formation assay was performed. The colonies were scored after two weeks. Data represent mean± SEM of three independent experiments. C. Analysis of SND1 expression in tissue microarray by immunohistochemistry. ˆ: p<0.05, #: p<0.02 and *: p<0.01 vs the corresponding data point in Hep-pc-4 cells.
SND1 is overexpressed in HCC
The observation that inhibition of SND1 can significantly inhibit cell growth and viability prompted us to probe deeper into SND1 involvement in HCC. At first we examined SND1 expression pattern by immunohistochemistry in tissue microarrays containing 86 primary HCC, 23 metastatic HCC and 9 normal adjacent liver samples. SND1 expression was detected predominantly in the cytoplasm (Fig. 6C). None of the normal liver and HCC samples stained negative for SND1 (Fig. 6C and Table 1). However, compared to normal liver there was a significant increase in SND1 expression in 81 out of 109 HCC patients (∼74%). SND1 expression gradually increased with the stages of the disease based on the BCLC staging system that showed significant statistical correlation (Table 1).
Table 1. Immunoperoxidase staining of normal liver and different stages of HCC by tissue microarray using anti-SND1 antibody.
| Intensity of SND1 staining | |||||
|---|---|---|---|---|---|
| 0 | + | ++ | +++ | Total cases | |
| Normal Liver | 0 | 9 | 9 | ||
| Stage I HCC | 0 | 11 | 12 | 0 | 23 |
| Stage II HCC | 0 | 9 | 16 | 0 | 25 |
| Stage III HCC | 0 | 7 | 23 | 8 | 38 |
| Stage IV HCC | 0 | 1 | 7 | 15 | 23 |
To assess the strength of association between SND1 expression and stages of HCC, an ordinal logistic regression was conducted with the stage of HCC as the ordinal response and SND1 expression as the independent variable in the proportional odds model. The hypothesis of association is highly significant: P value<0.001 using Pearson's chi-square test with Yates' continuity correction. A total of 109 HCC cases were analyzed.
SND1 promotes tumorigenesis by human HCC cells
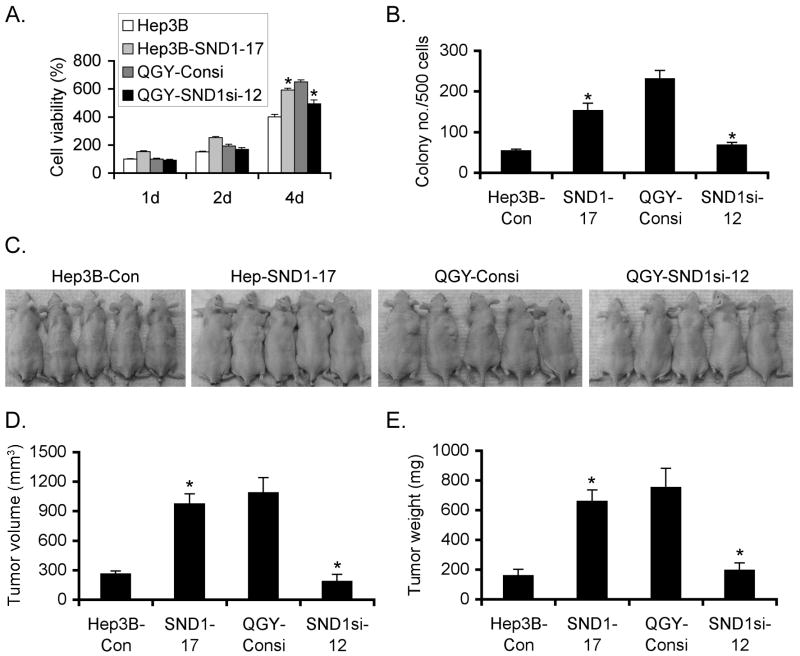
We next checked the consequence of stable overexpression of SND1 in Hep3B and stable knockdown of SND1 in QGY-7703 human HCCs in the contexts of cell growth and tumorigenicity. Compared to the control neomycin-resistant cells (Hep3B-Con), Hep3B-SND1-17 clones significant augmentation in cell growth and proliferation as observed by standard MTT and colony forming assays (Fig. 7A and 7B, respectively). On the contrary, QGY-SND1si-12 clone showed significantly slower cell growth and proliferation compared to QGY-Consi clone stably expressing control scrambled siRNA (Fig. 7A and 7B). In in vivo nude mice xenograft assay, Hep3B-SND1-17 clone formed significantly larger subcutaneous tumors compared to Hep3B-Con clone (Fig. 7C-E). As a corollary, QGY-Consi clone formed significantly larger tumor compared to QGY-SND1si-12 clone (Fig. 7C-E). Similar findings were observed in additional SND1-overexpressing clones of Hep3B cells and SND1-knockdown clones of QGY-7703 cells (Fig. S8).
Fig. 7.
SND1 promotes HCC growth in vitro and in vivo. A. Cell viability assay in the indicated cells by standard MTT assay. B. Colony formation assay using the indicated cells. The colonies were scored after 2 weeks. C. A representative photograph of athymic nude mice bearing subcutaneous xenografts from the indicated cells. Graphical representation of tumor volume (D) and tumor weight (E). Data represent mean± SEM of at least 15 mice in each group. *: p<0.05.
Discussion
Nuclear SND1 functions as a transcriptional co-activator and helps in pre-mRNA splicing and AEG-1 also modulates transcription (6, 7, 14, 19). However, we did not detect co-localization of AEG-1 and SND1 in the nucleus and we documented that AEG-1 interacts with SND1 in the cytoplasm facilitating RISC activity. Cells lacking fragile X mental retardation protein, another component of RISC, has normal RISC activity (16), further supporting the contribution of AEG-1 in maintaining optimum RISC function. More importantly, we demonstrate that both AEG-1 and SND1 are overexpressed in HCC compared to normal liver and human HCC cells exhibit higher RISC activity compared to normal immortal hepatocytes. We hypothesized that augmented RISC activity might lead to enhanced degradation of tumor suppressor mRNAs by oncomiRs and indeed we document that knocking down AEG-1 or SND1 increases while overexpression of AEG-1 or SND1 decreases the level of several tumor suppressor mRNAs, targets of miRNAs that are overexpressed in HCC (Fig. 5B and 5C). What might be the role of AEG-1 in RISC? The lack of any enzymatic domain indicates that AEG-1 might be a scaffold protein favoring formation of complex multiprotein structures such as RISC.
We identified that the region of AEG-1 protein containing a.a. 101-205 interacts with SND1. Interestingly, the same region also interacts with p65 subunit of NF-κB and a.a. 72-169 interacts with another AEG-1 interacting protein BCCIPα (14, 20). Bioinformatic analysis could not identify any known potential protein/protein interaction domain or motif in this region of AEG-1 indicating that this region might be a unique and novel protein/protein interaction domain. Mutational analysis of this region will help identify which amino acid residues of AEG-1 are critical for mediating these interactions and thus might be potential hot spots that might be targeted by small molecules to inhibit AEG-1 function.
Apart from a few isolated studies, little is known about the role of SND1 in tumorigenesis. As such we were surprised to find the relatively high expression of SND1 in human HCC samples compared to normal liver. Indeed we observed that overexpression of SND1 in Hep3B cells, expressing low level of SND1, augments while inhibition of SND1 in QGY-7703 cells, expressing high level of SND1, abrogates in vitro viability and in vivo tumorigenicity in nude mice. We also observed that inhibition of enzymatic (nuclease) activity of SND1 by the chemical inhibitor pdTp decreases viability of human HCC cells indicating that functional SND1, or functional RISC activity, is required for maintaining cell viability. Our findings are supported by a recent study demonstrating that SND1 is cleaved by caspases during drug-induced apoptosis (21). A non-cleavable SND1 mutant increased cell viability and knocking down SND1 promoted drug-induced apoptosis in HeLa cells (21). Incubation with caspases completely blocked RNase activity of SND1 indicating that SND1 enzymatic activity is required for maintaining cell viability or protection from apoptosis.
Hepatocellular carcinoma is one of the top five malignancies world-wide (22). The advanced disease is highly resistant to standard radio- and chemotherapy and virtually no effective treatment is available even for palliative treatment. Identification of novel targets thus facilitates development of new modalities of effective treatment for this fatal disease. Screening for small molecule inhibitors of SND1 enzymatic activity with a clinically achievable dose might usher in an effective therapeutic regimen not only for HCC but also for other SND1-overexpressing tumors.
Supplementary Material
Acknowledgments
Financial Support: The present study was supported in part by grants from The James S. McDonnell Foundation and The Dana Foundation and National Cancer Institute Grant R01 CA138540-01A1 (DS) and National Institutes of Health Grants R01 CA134721 (PBF). DS is the Harrison Endowed Scholar in Cancer Research and Blick scholar. PBF holds the Thelma Newmeyer Corman Chair in Cancer Research and is a Samuel Waxman Cancer Research Foundation (SWCRF) Investigator.
Abbreviations
- AEG-1
Astrocyte elevated gene-1
- RISC
RNA-induced silencing complex
- SND1
Staphylococcal nuclease domain containing 1
References
- 1.Sarkar D, Emdad L, Lee SG, Yoo BK, Su ZZ, Fisher PB. Astrocyte elevated gene-1: far more than just a gene regulated in astrocytes. Cancer Res. 2009;69:8529–8535. doi: 10.1158/0008-5472.CAN-09-1846. [DOI] [PMC free article] [PubMed] [Google Scholar]
- 2.Yoo BK, Emdad L, Su ZZ, Villanueva A, Chiang DY, Mukhopadhyay ND, Mills AS, et al. Astrocyte elevated gene-1 regulates hepatocellular carcinoma development and progression. J Clin Invest. 2009;119:465–477. doi: 10.1172/JCI36460. [DOI] [PMC free article] [PubMed] [Google Scholar]
- 3.Hu G, Chong RA, Yang Q, Wei Y, Blanco MA, Li F, Reiss M, et al. MTDH activation by 8q22 genomic gain promotes chemoresistance and metastasis of poor-prognosis breast cancer. Cancer Cell. 2009;15:9–20. doi: 10.1016/j.ccr.2008.11.013. [DOI] [PMC free article] [PubMed] [Google Scholar]
- 4.Emdad L, Lee SG, Su ZZ, Jeon HY, Boukerche H, Sarkar D, Fisher PB. Astrocyte elevated gene-1 (AEG-1) functions as an oncogene and regulates angiogenesis. Proc Natl Acad Sci U S A. 2009;106:21300–21305. doi: 10.1073/pnas.0910936106. [DOI] [PMC free article] [PubMed] [Google Scholar]
- 5.Leverson JD, Koskinen PJ, Orrico FC, Rainio EM, Jalkanen KJ, Dash AB, Eisenman RN, et al. Pim-1 kinase and p100 cooperate to enhance c-Myb activity. Mol Cell. 1998;2:417–425. doi: 10.1016/s1097-2765(00)80141-0. [DOI] [PubMed] [Google Scholar]
- 6.Yang J, Aittomaki S, Pesu M, Carter K, Saarinen J, Kalkkinen N, Kieff E, et al. Identification of p100 as a coactivator for STAT6 that bridges STAT6 with RNA polymerase II. Embo J. 2002;21:4950–4958. doi: 10.1093/emboj/cdf463. [DOI] [PMC free article] [PubMed] [Google Scholar]
- 7.Yang J, Valineva T, Hong J, Bu T, Yao Z, Jensen ON, Frilander MJ, et al. Transcriptional co-activator protein p100 interacts with snRNP proteins and facilitates the assembly of the spliceosome. Nucleic Acids Res. 2007;35:4485–4494. doi: 10.1093/nar/gkm470. [DOI] [PMC free article] [PubMed] [Google Scholar]
- 8.Paukku K, Kalkkinen N, Silvennoinen O, Kontula KK, Lehtonen JY. p100 increases AT1R expression through interaction with AT1R 3′-UTR. Nucleic Acids Res. 2008;36:4474–4487. doi: 10.1093/nar/gkn411. [DOI] [PMC free article] [PubMed] [Google Scholar]
- 9.Paukku K, Yang J, Silvennoinen O. Tudor and nuclease-like domains containing protein p100 function as coactivators for signal transducer and activator of transcription 5. Mol Endocrinol. 2003;17:1805–1814. doi: 10.1210/me.2002-0256. [DOI] [PubMed] [Google Scholar]
- 10.Caudy AA, Ketting RF, Hammond SM, Denli AM, Bathoorn AM, Tops BB, Silva JM, et al. A micrococcal nuclease homologue in RNAi effector complexes. Nature. 2003;425:411–414. doi: 10.1038/nature01956. [DOI] [PubMed] [Google Scholar]
- 11.Tong X, Drapkin R, Yalamanchili R, Mosialos G, Kieff E. The Epstein-Barr virus nuclear protein 2 acidic domain forms a complex with a novel cellular coactivator that can interact with TFIIE. Mol Cell Biol. 1995;15:4735–4744. doi: 10.1128/mcb.15.9.4735. [DOI] [PMC free article] [PubMed] [Google Scholar]
- 12.Ho J, Kong JW, Choong LY, Loh MC, Toy W, Chong PK, Wong CH, et al. Novel Breast Cancer Metastasis-Associated Proteins. J Proteome Res. 2009;8:583–594. doi: 10.1021/pr8007368. [DOI] [PubMed] [Google Scholar]
- 13.Tsuchiya N, Ochiai M, Nakashima K, Ubagai T, Sugimura T, Nakagama H. SND1, a component of RNA-induced silencing complex, is up-regulated in human colon cancers and implicated in early stage colon carcinogenesis. Cancer Res. 2007;67:9568–9576. doi: 10.1158/0008-5472.CAN-06-2707. [DOI] [PubMed] [Google Scholar]
- 14.Sarkar D, Park ES, Emdad L, Lee SG, Su ZZ, Fisher PB. Molecular basis of nuclear factor-kappaB activation by astrocyte elevated gene-1. Cancer Res. 2008;68:1478–1484. doi: 10.1158/0008-5472.CAN-07-6164. [DOI] [PubMed] [Google Scholar]
- 15.Hutvagner G, Simard MJ. Argonaute proteins: key players in RNA silencing. Nat Rev Mol Cell Biol. 2008;9:22–32. doi: 10.1038/nrm2321. [DOI] [PubMed] [Google Scholar]
- 16.Didiot MC, Subramanian M, Flatter E, Mandel JL, Moine H. Cells lacking the fragile X mental retardation protein (FMRP) have normal RISC activity but exhibit altered stress granule assembly. Mol Biol Cell. 2009;20:428–437. doi: 10.1091/mbc.E08-07-0737. [DOI] [PMC free article] [PubMed] [Google Scholar]
- 17.Imbeaud S, Ladeiro Y, Zucman-Rossi J. Identification of novel oncogenes and tumor suppressors in hepatocellular carcinoma. Semin Liver Dis. 30:75–86. doi: 10.1055/s-0030-1247134. [DOI] [PubMed] [Google Scholar]
- 18.Ji J, Wang XW. New kids on the block: diagnostic and prognostic microRNAs in hepatocellular carcinoma. Cancer Biol Ther. 2009;8:1686–1693. doi: 10.4161/cbt.8.18.8898. [DOI] [PubMed] [Google Scholar]
- 19.Thirkettle HJ, Mills IG, Whitaker HC, Neal DE. Nuclear LYRIC/AEG-1 interacts with PLZF and relieves PLZF-mediated repression. Oncogene. 2009;28:3663–3670. doi: 10.1038/onc.2009.223. [DOI] [PubMed] [Google Scholar]
- 20.Ash SC, Yang DQ, Britt DE. LYRIC/AEG-1 overexpression modulates BCCIPalpha protein levels in prostate tumor cells. Biochem Biophys Res Commun. 2008;371:333–338. doi: 10.1016/j.bbrc.2008.04.084. [DOI] [PMC free article] [PubMed] [Google Scholar]
- 21.Sundstrom JF, Vaculova A, Smertenko AP, Savenkov EI, Golovko A, Minina E, Tiwari BS, et al. Tudor staphylococcal nuclease is an evolutionarily conserved component of the programmed cell death degradome. Nat Cell Biol. 2009;11:1347–1354. doi: 10.1038/ncb1979. [DOI] [PubMed] [Google Scholar]
- 22.Llovet JM, Burroughs A, Bruix J. Hepatocellular carcinoma. Lancet. 2003;362:1907–1917. doi: 10.1016/S0140-6736(03)14964-1. [DOI] [PubMed] [Google Scholar]
Associated Data
This section collects any data citations, data availability statements, or supplementary materials included in this article.


